Abstract
Background
Intensive insulin therapy (IIT) for glycemic control in critically ill patients has been shown to be beneficial. Continuous glucose monitoring systems (CGMSs) have been approved as an adjunct to complement standard glucose monitoring in type 2 diabetes mellitus. This study was designed to evaluate the accuracy of a real-time CGMS (DexComTM STS) in the intensive care unit (ICU). We also evaluated its reliability and accuracy using a hyperinsulinemic-euglycemic and a hyperglycemic clamp study.
Methods
Nineteen patients were enrolled in this 7-day study [13 = surgical intensive care unit (SICU), 6 = burn intensive care unit (BICU)]. The patients were on IIT for at least 2 h prior the subcutaneous sensor insertion. Mean age and body mass index for SICU and BICU patients were 60.3 ± 3.7 and 64.5 ± 6.2 years and 36.6 ± 5.0 and 33.85 ± 3.4 kg/m2, respectively. DexCom accuracy was analyzed separately for the Johnson & Johnson (J&J) calibration finger sticks, Roche Accucheck finger sticks, and the Hitachi 917 analyzer measurements on serum using Clarke error grid analysis and Bland–Altman analysis. In the clamp studies, 20 patients were enrolled, and the data were analyzed similarly.
Results
There were 1065 pairs of DexCom–Accucheck, 232 pairs of DexCom–J&J, and 84 pairs of DexCom–Hitachi in ICU patients. For DexCom–Accucheck, 68.26% of the pairs fell into zone A, 31.83% into zone B, and 0.75% into zone C. There were no values in zones D or E.
From the 1102 matching DexCom–Beckman pairs in clamp studies, 42.29% were in zone A, 55.90% were in zone B, and 4.08% were in zone C.
Conclusions
Despite the high percentage of measurements in zones A and B, underestimation of hypoglycemia by DexCom measurements makes it an unreliable device in the ICU setting.
Keywords: continuous glucose monitors, DexCom, diabetes, glycemic control, intensive care unit, intensive insulin therapy
Introduction
During the stress of critical illness, levels of endogenous catecholamines, glucocorticoids, glucagon, and cytokines are all increased and contribute to the development of hyperglycemia.1,2 This leads to a state of insulin resistance despite normal or increased insulin levels.3 In addition, critically ill and injured patients receive various medications, such as vasopressors, dextrose solution, and nutritional support, which contribute to the development of hyperglycemia.1 Furthermore, as many as 10% of hospitalized adult patients have either diagnosed or occult diabetes mellitus.
Hyperglycemia in the critically ill and injured population can lead to increased mortality and morbidity. Several mechanisms for adverse outcomes associated with hypoglycemia and hyperglycemia have been proposed, among which impairment of immune system, leukocyte dysfunction, changes in immunoglobulin structure, and leucopenia are notable.4–6 Restoration of euglycemia in critical illness has been shown to be associated with several positive outcomes such as decreased mortality, decreased morbidity, and reduced rate of infection.7 Euglycemia in the intensive care unit (ICU) can be accomplished with intensive insulin therapy (IIT), but despite the clinical benefits of glycemic control,1 there are major obstacles to the widespread adoption of intensive insulin regimens.
The sustained effort required on the part of nursing staff to maintain normoglycemia has been suggested as one of the barriers to successful IIT. Furthermore, despite frequent blood glucose measurements during IIT, the risk of hypoglycemia and its untoward outcomes remain a major deterrent to the acceptance of IIT as standard of care.8
Continuous glucose monitoring systems (CGMSs) have been approved for outpatient use in diabetes patients as an adjunct to conventional measurements of glucose (i.e., finger sticks). The use of CGMSs in the hospital setting has been studied by different groups, yet their accuracy and reliability remains unclear.9–13
The purpose of our study was to evaluate the accuracy and reliability of a CGMS device during IIT in the surgical and burn ICU setting. Specifically, we evaluated the newly approved DexComTM STS device (San Diego, CA) in these settings and compared the values obtained with those of two finger-stick glucose measurement systems as well as standard laboratory serum analyzer values. Additionally, we evaluated the accuracy of the device during hyperinsulinemic-euglycemic clamp studies as well as during hyperglycemic clamp studies. In the latter studies, we compared accuracy of the device during sustained stable plateaus of glycemia as well as during the rapid fall of plasma glucose from the hyperglycemic state toward the basal and hypoglycemic state.
Methods
The accuracy and reliability of DexCom, was evaluated in two different groups of patients: critically ill and injured ICU patients receiving IIT and volunteers undergoing clamp studies. Nineteen patients (8 females and 11 males) were enrolled from the general surgical intensive care unit (SICU) (n = 13) and from the burn intensive care unit (BICU) (n = 6) at Johns Hopkins Bayview Medical Center (JHBMC). The SICU patients had the following conditions: respiratory complications (e.g., severe asthma, respiratory failure, bronchopneumonia, or bronchitis), gastrointestinal complications, oncological problems, trauma cases, and orthopedic operations. The BICU patients had an average total body surface area burn of 33% (range 10% to 80%). All subjects who were evaluated with DexCom during clamp studies were morbidly obese patients who were undergoing metabolic studies before and after bariatric surgery. A total of 20 clamp studies were performed in 13 patients. In the SICU/BICU study, patients who were started on IIT as a standard of care were further screened for eligibility for the CGMS protocol. The inclusion criteria for IIT was an anticipated length of ICU stay more than 24 h and a blood glucose value above 119 mg/dl. The protocol for IIT was approved by the JHBMC Pharmacy and Therapeutics Committee for implementation in the mixed service SICU and BICU in October 2006. Upon initiation of IIT, blood glucose levels were measured at least hourly until three consecutive glucose values were within the target range of 90–120 mg/dl. The frequency of blood glucose measurement after this varied depending on the patient's clinical condition and previous glucose level. The patients who had been on IIT for at least 2 h were considered possible candidates for the insertion of the CGMS sensor. Written informed consent was obtained from all the patients or their proxy. The sensor was inserted in the subcutaneous tissue (usually over the abdomen). The DexCom transmitter was placed within 5 ft of the sensor. The device was able to display the individual 5 min values as well as the glucose trend.
After sensor insertion, the DexCom device was calibrated within 2 h as described by the manufacturer, using a Johnson & Johnson (J&J) glucometer (Milpitas, CA), and was re-calibrated at least every 12 h after the initial calibration. The sensor remained in the subcutaneous tissue for up to 7 days, even if the patient was taken off the insulin infusion protocol or transferred out of the ICU. The adjustments in insulin infusion and all clinical decision making were based on values obtained with the standard hospital glucometer (Roche Accucheck, Mannheim, Germany) or serum glucose values (Hitachi 917 analyzer, Tokyo, Japan). The display of the DexCom was masked. However, if the alarm went off (glucose values of 55 mg/dl or below), the nursing staff was advised to obtain a finger stick using the Accucheck glucometer. Upon completion of the 7-day study course, the DexCom data were downloaded and compared to the data obtained from J&J glucometer, Accucheck glucometer, and serum glucose values measured by the Hitachi glucose analyzer (considered the “gold standard”). All measurements with Accucheck recording (both electronically and in charts) were performed by clinical nurses in our SICU/BICU.
Because controlling for all the factors that can potentially affect blood glucose measurements in the ICU is difficult and since interstitial fluid kinetics may be different in ICU patients than in a normal setting, we also evaluated the accuracy of DexCom during controlled glucose clamp studies performed in volunteer subjects. A hyper-insulinemic-euglycemic clamp was performed for 2 h with a primed infusion followed by a continuous infusion of insulin (480 pmol/m-2/min-1, Humulin, Eli Lilly). The plasma glucose was clamped at 95 mg/dl for 2 h followed by a 1 h recovery. Immediately after this step, a hyperglycemic clamp (98 mg/dl above basal level, i.e., 193 mg/dl) was performed for 2 h, after which the glucose infusion was terminated and plasma glucose was allowed to fall toward the basal level. The sensor was inserted on the day of the study and calibrated within 2 h before initiating the clamp procedure. During the 5.5 h of the clamp procedure, 5 min plasma glucose measurements were obtained using a Beckman glucose analyzer II (Fullerton, CA).
The DexCom glucose values for the ICU protocol were compared to each of the three different measurement methods using point error grid analysis (EGA). Furthermore, the four different measurements were plotted for each patient to determine the discrepancies and to evaluate the effect of possible drug interactions. Results were divided into five zones: A, B, C, D, and E.14 Values in zones A and B are taken to be accurate or acceptable results. Values in zone C are not accurate, and their use may result in unnecessary correction, leading to poor outcome. Values in zone D are taken as a dangerous failure to detect and may result in potentially life-threatening errors in insulin infusion therapy. Values in zone E are taken as inaccurate values resulting in “erroneous” therapy. In order to further evaluate the difference between individual methods, the difference between each of the two measurements was plotted against the method of interest using a Bland and Altman analysis.15,16 This method is used to compare the bias [mean difference (MD) between the two measurements] and limits of agreement [bias ± 2 standard deviation (SD) of bias]. We also calculated mean absolute difference (MAD). The difference between reference and individual estimated values is plotted against the reference values and the mean ± 2 SD is also presented. The Bland and Altman analysis was used to compare glucose values in three clinically relevant regions, hypoglycemia (<70 mg/dl), euglycemia (70–180 mg/dl), and hyperglycemia (>180 mg/dl), according to Clarke EGA.17 Correlation between reference blood glucose measurements and by DexCom was evaluated by calculating Pearson's correlations coefficient. Data from the clamp studies were analyzed in the same fashion described for the ICU patients.
Results
Surgical Intensive Care Unit / Burn Intensive Care Unit Study
The mean age for the SICU and BICU patients was 60.3 ± 3.7 and 64.5 ± 6.2 years, and their corresponding body mass index was 36.6 ± 5.0 and 33.85 ± 3.4 kg/m2, respectively. Eight (62%) SICU patients and three (50%) BICU patients were diagnosed with type 2 diabetes mellitus before admission to the ICU. The mean duration of IIT for SICU and BICU patients was 4.8 and 4.0 days, respectively.
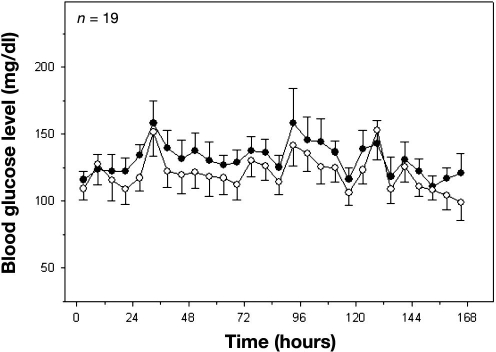
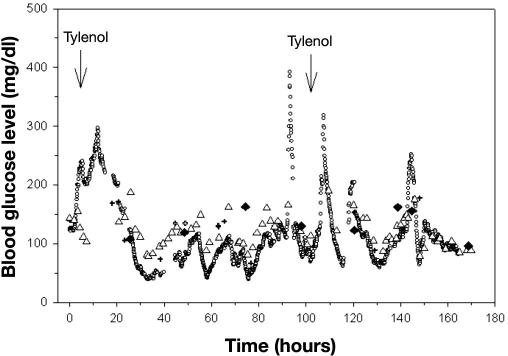
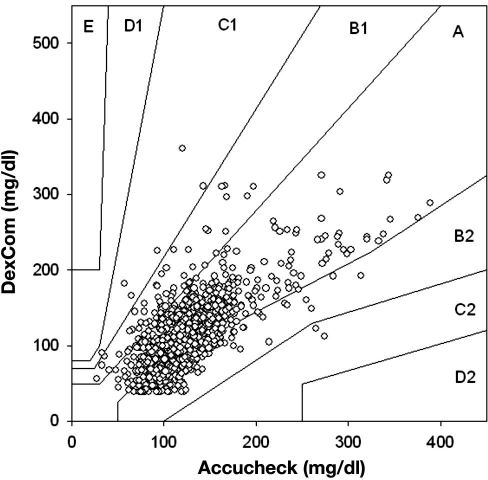
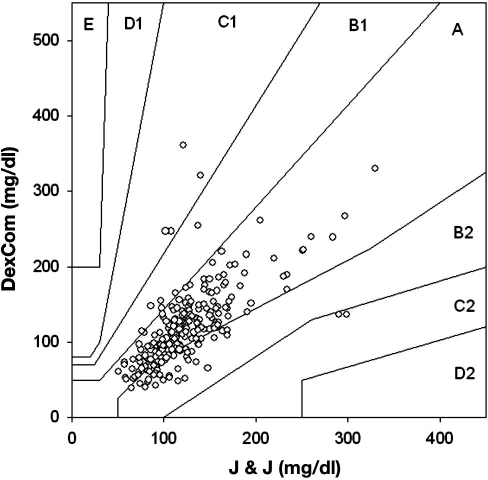
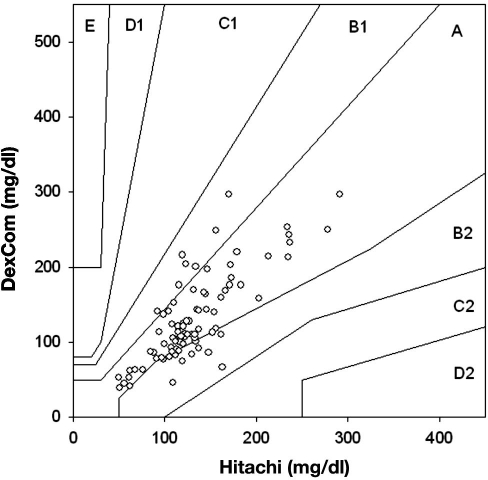
There were 1065 matching data points comparing Roche Accucheck to DexCom. The mean glucose level for all patients in the ICU during the seven day evaluation, as measured by Roche Accucheck and by DexCom, is presented in Figure 1. During the 7-day evaluation, often there were periods (1–7 h) where the DexCom device failed to detect any glucose values. A representative plot of an individual patient demonstrating differences between Roche Accucheck and DexCom is shown in Figure 2. As previously described, administration of acetaminophen, a drug commonly used in the ICU, significantly interfered with measurement of glucose levels by the DexCom. Using the EGA, 68.26% of the data fell in zone A while 31.83% and 0.75% were in zones B and C, respectively (r = 0.718, p < .001, Figure 3). There were no glucose values in zones D or E. It is noteworthy that there were frank hypoglycemic levels detected by the Roche Accucheck that were in the euglycemic or hyperglycemic level by the DexCom. This result was deemed not clinically acceptable, especially in the ICU setting, where the patient may be unconscious or otherwise unable to communicate symptoms. Two hundred thirty-two matching data points were analyzed for DexCom and J&J measurements, and 75% of the data were in zone A, 23.28% were in zone B, and 2.59% were in zone C ( r = 0.674, p = <.001, Figure 4). Comparing the DexCom data to the gold standard method of measurement (Hitachi glucose analyzer), 84 time points were found, 75% of which fell in zone A and 25% in zone B (r = 0.796, p = <.001, Figure 5).
Figure 1.
Mean 6 h blood glucose values over a 7-day study course for 19 ICU patients. Closed circles represent Accucheck glucometer measurements, and open circles represent DexCom values.
Figure 2.
Blood glucose measurements for an ICU patient. Tylenol administration was recorded at two different time points. Open circles represent DexCom, open triangles represent Accucheck, crosses represent the J&J glucometer, and closed diamonds represent the Hitachi analyzer.
Figure 3.
Scatter plot of DexCom–Accucheck blood glucose pairs using point EGA.
Figure 4.
Scatter plot of DexCom–J&J glucometer blood glucose pairs using point EGA.
Figure 5.
Scatter plot of DexCom–Hitachi blood glucose pairs using point EGA.
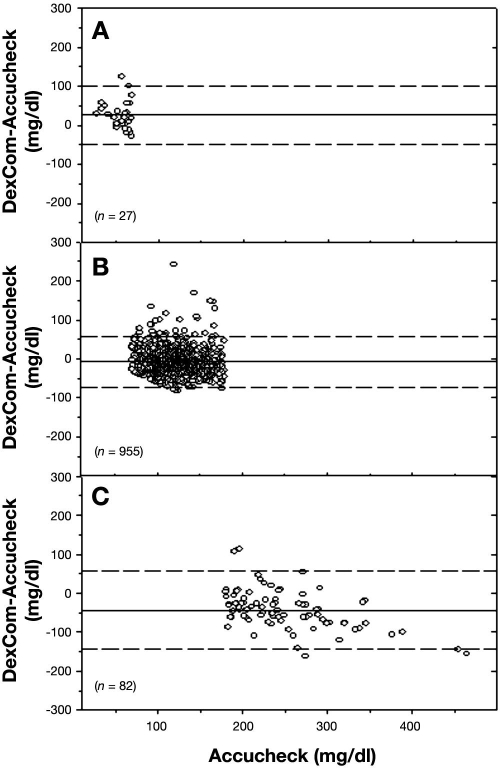
Comparing the Accucheck data to Hitachi glucose analyzer measurements, there were 82% matching time points in zone A, 17% in zone B, and 1% in zone C (r = 0.80, p = <.001). The Bland–Altman plot for the Roche Accucheck and DexCom measurements is presented in Figure 6. The MD and MAD ± SD for the hypoglycemic levels (<70 mg/dl), euglycemic levels (70–180 mg/dl), and hyperglycemic levels (>180 mg/dl) are presented in There were 30 hypoglycemic events detected by the Accucheck, and only half of these were detected by DexCom. There were 167 hypoglycemic events detected by DexCom with alarm notification, which led to finger-stick verification with the Accucheck. However, only 14 of these events were actually in the hypoglycemic range.
Figure 6.
Bland–Altman plot of blood glucose measurements from Accucheck and DexCom. The solid line represents the MD, and the dashed line represents ±2 SD. The top, middle, and lower panels represent hypoglycemic, normoglycemic, and hyperglycemic regions, respectively.
Clamp Studies
The mean age and body mass index of the patients at their first clamp study was 45.3 ± 3.0 years and 42.3 ± 1.8 kg/m2, respectively. Six patients (46%) had a fasting plasma glucose level above 100 mg/dl at the time of the first study.
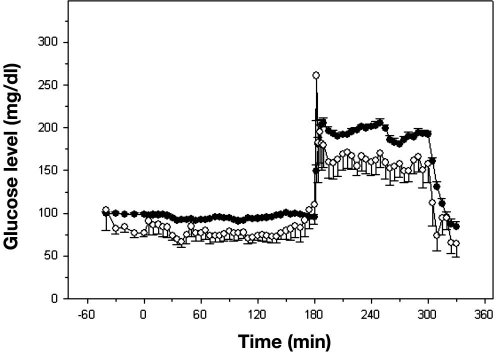
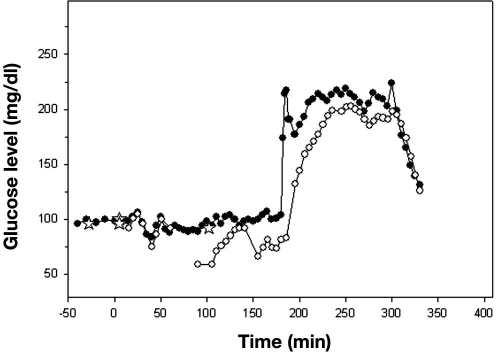
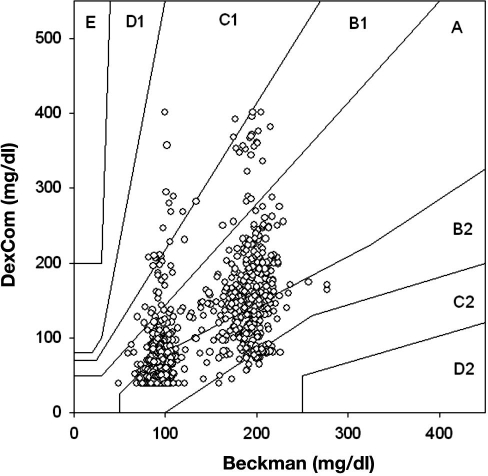
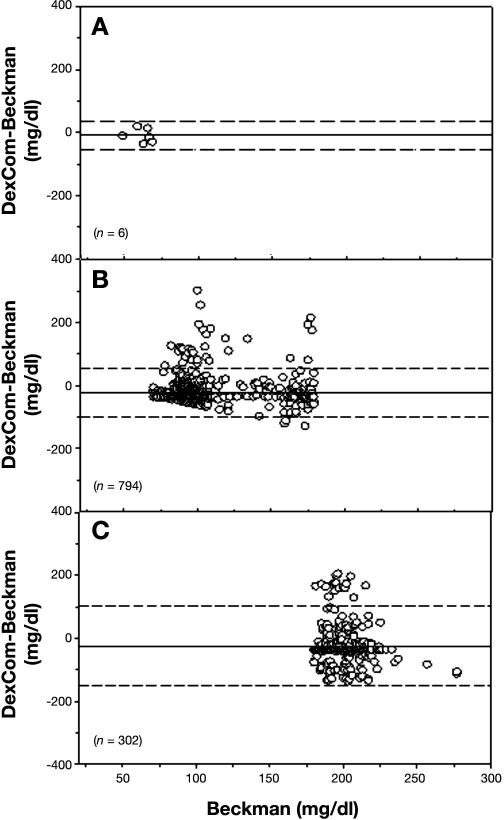
During each clamp, we obtained four samples before the start of the insulin infusion and then a sample every 5 min for the duration of the clamp to 330 min (i.e., 70 samples). We evaluated the DexCom in 20 clamps, and therefore we should have 1400 matching data points. However, there were only 1102 matching points because of occasional failures of the DexCom device to detect any glucose values during the clamp procedure. The mean glucose levels for all clamp studies as measured by Beckman and DexCom is presented in Figure 7, and a representative plot of an individual patient, demonstrating differences between the two devices, is presented in Figure 8. Using EGA, 42.29% of the data fell in zone A, 55.90% in zone B, and 4.08% in zone C (r = 0.638, p < .001, Figure 9). The Bland–Altman plot for the Beckman and DexCom measurement is presented in Figure 10. The MD and MAD ± SD for the hypoglycemic, euglycemic, and hyperglycemic levels are presented in Table 2.
Figure 7.
Mean 5 min plasma and blood glucose values over a 330 min clamp study for 20 patients. Closed circles represent Beckman plasma measurements, and open circles represent DexCom blood glucose values.
Figure 8.
Plasma and blood glucose measurements for a clamp study. Open circles represent DexCom, closed circles represent Beckman, and stars represent the J&J glucometer. Note that, from 60–90, 139–150, and 185–200 min, there were no glucose values detected by DexCom.
Figure 9.
Scatter plot of DexCom–Beckman blood glucose pairs using point EGA.
Figure 10.
Bland–Altman plot of plasma glucose measurements from Beckman and blood glucose measurements from DexCom. The solid line represents the MD, and the dashed line represents ±2 SD. The top, middle, and lower panels represent hypoglycemic, normoglycemic, and hyperglycemic regions, respectively.
Table 2.
Mean Difference and Mean Absolute Difference between Beckman Analyzer and DexCom Glucose Values for Hypoglycemic Range (<70 mg/dl), Euglycemic Range (70–179 mg/dl), and Hyperglycemic Range (≥180 mg/dl)
| Hypoglycemic range | Euglycemic range | Hyperglycemic range | |
|---|---|---|---|
| MD ± SD (mg/dl) | -9.5 ± 22.7 | -22.6 ± 39.5 | -24.6 ± 62.8 |
| MAD ± SD (mg/dl) | 20.8 ± 10.1 | 36.3 ± 27.4 | 53.9 ± 40.4 |
Table 1.
Mean Difference and Mean Absolute Difference between Accucheck and DexCom Glucose Values for Hypoglycemic Range (<70 mg/dl), Euglycemic Range (70–179 mg/dl), and Hyperglycemic Range (≥180 mg/dl)
| Hypoglycemic range | Euglycemic range | Hyperglycemic range | |
|---|---|---|---|
| MD ± SD (mg/dl) | 26.0 ± 36.8 | -43.3 ± 50.3 | 33.1 ± 30.2 |
| MAD ± SD (mg/dl) | 33.2 ± 30.2 | 25.7 ± 21.7 | 54.4 ± 37.9 |
Discussion
Since the Van den Berghe and colleagues publication of 2001,7 attention to the benefits of strict control of glucose levels in SICU patients has increased markedly. This Belgian study of >1500 patients revealed that the mortality rate in ventilated, mixed SICU patients was reduced by almost half (44%) by the use of a continuous insulin infusion designed to maintain blood glucose levels between 80 and 110 mg/dl, as compared with conventional insulin therapy for hyperglycemia (≥150 mg/dl). This and other recent studies reporting the beneficial effects of strict glucose control in high-risk patients have also addressed the limitations on broad acceptance of strict glucose control, both in the ICU and beyond it.18–20 Problems such as the risk of insulin-induced hypoglycemia, the added nursing attention required for close glycemic control, and the appropriate length of strict control to achieve long-term benefit with the currently approved methodologies are current subjects of investigation and debate. The availability of an accurate, reliable device that does not require a great deal of sophistication by the nurses will be of enormous benefit in the ICU setting. A major obstacle to widespread adoption of strict euglycemic control is the documented risk of hypoglycemia associated with IIT. Although insulin infusions are now common in the SICU, the important step is to lower the glycemic goal to the true range of euglycemia (80–120 mg/dl) and keep it there for the duration of the ICU stay. Because of the perceived risk of hypoglycemia and the sustained effort on the part of physicians and nursing staff required to maintain this level of glycemic control, the success of Van den Berghe and associates has been difficult to replicate in this country.
Despite these obstacles, IIT has been adopted by most if not all SICUs. What remains controversial is the target for blood glucose level. Nearly all intensivists agree that blood glucose levels should be below 180 mg/dl (10 mmol/liter). Whether the level should be at the target suggested by Van den Berghe and coworkers (110 mg/dl) is hampered by the inability to measure blood glucose level accurately and frequently in the ICU. The reluctance to maintain tight control is due to the fact that “usual” finger-stick measurements are taken too infrequently, which can contribute to hypoglycemic episodes. This can be prevented, theoretically, with the use of a real-time CGMS. Further, a CGMS has the added benefit of potentially reducing the workload of nursing staff, provided that the system is sufficiently sensitive and accurate. We therefore evaluated the accuracy and reliability of a Food and Drug Administration-approved CGMS system, DexCom, which is approved as an adjunct method of measurement in diabetes patients, in our ICU.
There are known physiological differences that affect the measurement of blood, interstitial, and capillary glucose levels, among which are the time lag associated with interstitial and blood glucose level during changing levels of glycemia, as well as the metabolic gradient of glucose utilization during periods of high glucose uptake. Although there are differences between blood (artery or venous) and capillary glucose level, the differences are not as large as with blood and interstitial glucose values. The interstitial glucose level can be influenced by states of hydration, such as edema, or hypoperfusion, which are common in an ICU setting. Intensive insulin therapy is based on the capillary measurement of glucose level. Nevertheless, an accurate and reliable measurement of interstitial glucose level that accurately reflects the capillary glucose level would facilitate implementation of IIT.
We observed sufficient discrepancies, especially within the hypoglycemic range, between the DexCom and Roche Accucheck, so we abandoned the use of DexCom in the ICU. The discrepancy seen at hypoglycemic levels was assessed to be dangerous, as the DexCom measurement was often within the euglycemic range when the simultaneous Accucheck measurement reflected hypoglycemia. Furthermore, there were episodes where the DexCom would abruptly cease to provide any data and required recalibration.
In addition, we observed episodes where the use of acetaminophen caused a transient but profound over-estimation of glycemic level by the DexCom, but we also observed episodes where similar and sudden errors were observed without any documented acetaminophen exposure.
During stable euglycemia or hyperglycemia created by the glucose clamp protocol, there was a consistent underrepresentation of glycemic level by the DexCom device, and this error increased with time. The DexCom device tended to underestimate glycemic level most of the time during clamp studies; however, the overestimation of glucose levels in the ICU, which was noticeable during this study, is of main and utmost concern. Furthermore, the hypoglycemic episodes detected by the DexCom device were in the actual hypoglycemic range only 12% of the time, and this led to unnecessary finger-stick evaluation without adding any benefit to the patient or nursing staff. Meanwhile, DexCom was only able to detect hypoglycemia in half of the documented hypoglycemic episodes as detected by Accucheck.
There are some limitations to our study. The DexCom device that was used required calibration, specifically with J&J, per manufacturer's specifications. Initially, two calibrations are required 2 h after the sensor insertion, and then one at least every 12 h thereafter. Thus the number of blood comparison between the J&J device and DexCom values were far fewer than between DexCom and Accucheck, the approved standard of care device used routinely by the ICU nurses. Nevertheless, there was a sufficient number of simultaneous J&J and Accucheck measurements that allowed us to compare the accuracy of the two instruments. It should be noted that the Accucheck device has a wider linear range than the J&J device and that the Accucheck is an instrument of choice in the ICU setting because it requires double security for its use by the nurses and electronically records both glucose values and patient identification. The J&J device requires manual recording of all parameters. Usually, calibration of both J&J and Accucheck were performed with blood obtained from an indwelling catheter. However, this was not the case at every instance, and finger sticks were sometimes obtained for this purpose. The nurses in the ICU as well as our research staff have been instructed with accurate finger-stick sampling (e.g., second drop of blood). Nevertheless, it should be acknowledged that finger-stick glucose measurements may be inaccurate, and interstitial blood glucose measurements have different kinetic distribution of glycemic level than blood, most notably a delay in response to glucose administration. The former are most likely further altered in the obese state. With respect to the DexCom comparison during the hyperinsulinemic-euglycemic clamp and hyperglycemic clamp procedure, it should be noted that all evaluations were performed in morbidly obese patients, and the kinetics of interstitial glucose transport from blood in states of severe obesity may well be different than in normal-weight individuals.
In summary, over 90% of simultaneous DexCom measurements and glucometer or serum glucose measurements were within 25–50 mg/dl of agreement, but the occurrence of significant overestimation of glycemia at low glucose levels suggests that a dependence on this CGMS device in the ICU setting may lead to unrecognized hypoglycemic episodes. Further refinements in the CGMS technology are required before this device can be considered a candidate to replace finger-stick glucose measurements in the ICU setting. A CGMS device that requires intravenous insertion, although more invasive than a subcutaneous insertion, is more desirable and likely to be more efficacious for the control of blood glucose level both in the ICU and during surgery.
Acknowledgments
We are grateful to all the volunteers who participated in this study and extend our appreciation to them. We also thank the nursing staff of the SICU and BICU at JHBMC for their assistance in the conduct of this study. We thank Denis C. Muller for statistical assistance, Dr. Garry M. Steil for advice with regard to EGA, and Melissa L. Scudder for assistance in the preparation of this article.
Abbreviations
- BICU
burn intensive care unit
- CGMS
continuous glucose monitoring system
- EGA
error grid analysis
- ICU
intensive care unit
- IIT
intensive insulin therapy
- J&J
Johnson & Johnson
- JHBMC
Johns Hopkins Bayview Medical Center
- MAD
mean absolute difference
- MD
mean difference
- SD
standard deviation
- SICU
surgical intensive care unit
References
- 1.De Block C, Manuel YKB, Van Gaal L, Rogiers P. Intensive insulin therapy in the intensive care unit: assessment by continuous glucose monitoring. Diabetes Care. 2006;29(8):1750–1756. doi: 10.2337/dc05-2353. [DOI] [PubMed] [Google Scholar]
- 2.Finnerty CC, Herndon DN, Przkora R, Pereira CT, Oliveira HM, Queiroz DM, Rocha AM, Jeschke MG. Cytokine expression profile over time in severely burned pediatric patients. Shock. 2006;26(1):13–19. doi: 10.1097/01.shk.0000223120.26394.7d. [DOI] [PubMed] [Google Scholar]
- 3.Mizock BA. Alterations in carbohydrate metabolism during stress: a review of the literature. Am J Med. 1995;98(1):75–84. doi: 10.1016/S0002-9343(99)80083-7. [DOI] [PubMed] [Google Scholar]
- 4.Clement S, Braithwaite SS, Magee MF, Ahmann A, Smith EP, Schafer RG, Hirsch IB American Diabetes Association Diabetes in Hospitals Writing Committee. Management of diabetes and hyperglycemia in hospitals. Diabetes Care. 2004;27(2):553–591. doi: 10.2337/diacare.27.2.553. [DOI] [PubMed] [Google Scholar]
- 5.Black CT, Hennessey PJ, Andrassy RJ. Short-term hyperglycemia depresses immunity through nonenzymatic glycosylation of circulating immunoglobulin. J Trauma. 1990;30(7):830–832. doi: 10.1097/00005373-199007000-00012. discussion 832–3. [DOI] [PubMed] [Google Scholar]
- 6.Von Känel R, Mills PJ, Dimsdale JE. Short-term hyperglycemia induces lymphopenia and lymphocyte subset redistribution. Life Sci. 2001;69(3):255–262. doi: 10.1016/s0024-3205(01)01127-4. [DOI] [PubMed] [Google Scholar]
- 7.Van den Berghe G, Wouters P, Weekers F, Verwaest C, Bruyninckx F, Schetz M, Vlasselaers D, Ferdinande P, Lauwers P, Bouillon R. Intensive insulin therapy in the critically ill patients. N Engl J Med. 2001;345(19):1359–1367. doi: 10.1056/NEJMoa011300. [DOI] [PubMed] [Google Scholar]
- 8.Brunkhorst FM, Engel C, Bloos F, Meier-Hellmann A, Ragaller M, Weiler N, Moerer O, Gruendling M, Oppert M, Grond S, Olthoff D, Jaschinski U, John S, Rossaint R, Welte T, Schaefer M, Kern P, Kuhnt E, Kiehntopf M, Hartog C, Natanson C, Loeffler M, Reinhart K German Competence Network Sepsis (SepNet) Intensive insulin therapy and pentastarch resuscitation in severe sepsis. N Engl J Med. 2008;358(2):125–139. doi: 10.1056/NEJMoa070716. [DOI] [PubMed] [Google Scholar]
- 9.Yamashita S, Nakamura T, Shimomura I, Nishida M, Yoshida S, Kotani K, Kameda-Takemuara K, Tokunaga K, Matsuzawa Y. Insulin resistance and body fat distribution. Diabetes Care. 1996;19(3):287–291. doi: 10.2337/diacare.19.3.287. [DOI] [PubMed] [Google Scholar]
- 10.Chee F, Fernando T, van Heerden PV. Closed-loop glucose control in critically ill patients using continuous glucose monitoring system (CGMS) in real time. IEEE Trans Inf Technol Biomed. 2003;7(1):43–53. doi: 10.1109/titb.2003.808509. [DOI] [PubMed] [Google Scholar]
- 11.Murakami A, Gutierrez MA, Lage SHG, Rebelo MFS, Guiraldelli RHG, Ramires JAF. A continuous glucose monitoring system in critical cardiac patients in the intensive care unit. Computers in Cardiology. 2006;33:233–236. [Google Scholar]
- 12.Goldberg PA, Siegel MD, Russell RR, Sherwin RS, Halickman JI, Cooper DA, Dziura JD, Inzucchi SE. Experience with the continuous glucose monitoring system in a medical intensive care unit. Diabetes Technol Ther. 2004;6(3):339–347. doi: 10.1089/152091504774198034. [DOI] [PubMed] [Google Scholar]
- 13.Corstjens AM, Ligtenberg JJ, van der Horst IC, Spanjersberg R, Lind JS, Tulleken JE, Meertens JH, Zijlstra JG. Accuracy and feasibility of point-of-care and continuous blood glucose analysis in critically ill ICU patients. Crit Care. 2006;10(5):R135. doi: 10.1186/cc5048. [DOI] [PMC free article] [PubMed] [Google Scholar]
- 14.Parkes JL, Slatin SL, Pardo S, Ginsberg BH. A new consensus error grid to evaluate the clinical significance of inaccuracies in the measurement of blood glucose. Diabetes Care. 2000;23(8):1143–1148. doi: 10.2337/diacare.23.8.1143. [DOI] [PubMed] [Google Scholar]
- 15.Bland JM, Altman DJ. Regression analysis. Lancet. 1986;1(8486):908–909. doi: 10.1016/s0140-6736(86)91008-1. [DOI] [PubMed] [Google Scholar]
- 16.Bland JM, Altman DG. Calculating correlation coefficients with repeated observations: part 2—correlation between subjects. BMJ. 1995;310(6980):633. doi: 10.1136/bmj.310.6980.633. [DOI] [PMC free article] [PubMed] [Google Scholar]
- 17.Clarke WL. The original Clarke Error Grid Analysis (EGA) Diabetes Technol Ther. 2005;7(5):776–779. doi: 10.1089/dia.2005.7.776. [DOI] [PubMed] [Google Scholar]
- 18.Finfer S, Delaney A. Tight glycemic control in critically ill adults. JAMA. 2008;300(8):963–965. doi: 10.1001/jama.300.8.963. [DOI] [PubMed] [Google Scholar]
- 19.NICE-SUGAR Study Investigators. Finfer S, Chittock DR, Su SY, Blair D, Foster D, Dhingra V, Bellomo R, Cook D, Dodek P, Henderson WR, Hébert PC, Heritier S, Heyland DK, McArthur C, McDonald E, Mitchell I, Myburgh JA, Norton R, Potter J, Robinson BG, Ronco JJ. Intensive versus conventional glucose control in critically ill patients. N Engl J Med. 2009;360(13):1283–1297. doi: 10.1056/NEJMoa0810625. [DOI] [PubMed] [Google Scholar]
- 20.Borggreve HF, Zijlstra JG, Ligtenberg JJ. Benefits of tight glycemic control still outweigh the harm of hypoglycemia. Crit Care Med. 2008;36(2):663–664. doi: 10.1097/CCM.0b013e318162b935. [DOI] [PubMed] [Google Scholar]


