Abstract
Background
Adrenaline release and excess insulin during hypoglycemia stimulate the uptake of potassium from the bloodstream, causing low plasma potassium (hypokalemia). Hypokalemia has a profound effect on the heart and is associated with an increased risk of malignant cardiac arrhythmias. It is the aim of this study to develop a physiological model of potassium changes during hypoglycemia to better understand the effect of hypoglycemia on plasma potassium.
Method
Potassium counterregulation to hypokalemia was modeled as a linear function dependent on the absolute potassium level. An insulin-induced uptake of potassium was modeled using a negative exponential function, and an adrenaline-induced uptake of potassium was modeled as a linear function. Functional expressions for the three components were found using published data.
Results
The performance of the model was evaluated by simulating plasma potassium from three published studies. Simulations were done using measured levels of adrenaline and insulin. The mean root mean squared error (RMSE) of simulating plasma potassium from the three studies was 0.09 mmol/liter, and the mean normalized RMSE was 14%. The mean difference between nadirs in simulated and measured potassium was 0.12 mmol/liter.
Conclusions
The presented model simulated plasma potassium with good accuracy in a wide range of clinical settings. The limited number of hypoglycemic episodes in the test set necessitates further tests to substantiate the ability of the model to simulate potassium during hypoglycemia. In conclusion, the model is a good first step toward better understanding of changes in plasma potassium during hypoglycemia.
Keywords: diabetes, hypokalemia, physiological model, potassium
Introduction
Cardiac arrhythmia triggered by hypoglycemia is thought to be the cause of the dead-in-bed syndrome in which young, otherwise healthy persons with diabetes die during sleep in an undisturbed bed.1 It has been shown that both experimentally induced and spontaneous episodes of hypoglycemia cause prolongation of the QT interval notable on the electrocardiogram.2–4 Prolongation of the QT interval is known as a surrogate biomarker associated with an increased risk of malignant arrhythmias.5
Evidence shows that low serum potassium levels (hypokalemia) are indeed one of the mechanisms behind QT interval prolongation during hypoglycemia.6,7 In addition, hypokalemia has a profound effect on the heart and increases the risk of serious arrhythmias.8 Hypokalemia may occur as a result of insulin therapy or because of adrenaline release during episodes of hypoglycemia, which both stimulate the uptake of potassium from the bloodstream.9,10
The effect of hypoglycemia on potassium levels has been studied primarily using the hypoglycemic hyper-insulinemic clamp4,11 or hypoglycemia induced by an intravenous bolus of insulin.9,10 Results from such studies are, however, in nature difficult to apply to the spontaneous episodes of hypoglycemia experienced by a patient.
We propose a novel way to analyze the effect of hypoglycemia on potassium levels, namely a physiological model of potassium changes. Physiological models have the ability to synthesize information from many studies, making them suitable for simulations in a wide range of situations. Another advantage of such models is that they can provide a deeper understanding of the physiology. It was the aim of this study to develop and test a physiological model of potassium changes during hypoglycemia on the basis of known physiology and data from the literature.
Methods
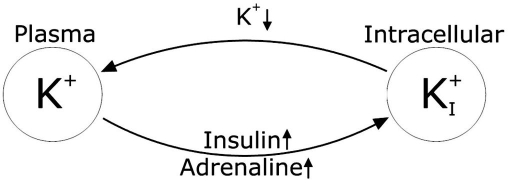
The fall in plasma potassium concentration during hypoglycemia is governed by two mechanisms related to, respectively, an increased adrenaline concentration and an increased insulin concentration.7 As the plasma potassium level falls below a certain threshold, the body initiates mechanisms to oppose the fall. These mechanisms are jointly called potassium counterregulation to hypokalemia as proposed by Minaker and colleagues.12 An overview of plasma potassium regulation during hypokalemia is shown in Figure 1.
Figure 1.
Overview of plasma potassium regulation during hypoglycemia. Increased levels of insulin and adrenaline stimulate the influx of potassium. Low plasma potassium triggers the potassium counterregulation to hypoglycemia, causing an increased efflux of potassium.
An intracellular compartment was not included in the current model for two reasons. First, the intracellular compartment contents of potassium are 15–20 times larger than the extracellular compartment contents. Second, the equilibrium is seen to depend very little on the intracellular concentration.8
It was assumed that insulin and adrenaline were the only effects causing potassium levels to fall during hypoglycemia. In addition, it was assumed that the potassium counterregulation to hypokalemia depended only on the plasma potassium concentration and was the only factor causing an increased potassium efflux.
Potassium uptake after meals, renal excretion of potassium, and hepatic uptake and release of potassium were not included explicitly in the model because available data did not allow for these effects to be modeled separately.
On the basis of the aforementioned assumptions, the model for changes in the plasma potassium concentration during hypoglycemia is described by Equation (1):
| (1) |
In the following three components of the model, f1 (the potassium counterregulation to hypokalemia), f2(uptake of potassium due to insulin), and f3(uptake of potassium due to adrenaline) are described. All data used for building the model were from healthy subjects. In addition, most of the studies only used male subjects. In studies where subjects suffered from a condition or disease or where the effects of a drug were tested, only the control and/or placebo group was used to fit model parameters unless otherwise stated.
Potassium Counterregulation to Hypokalemia—f1
The potassium counterregulation to hypokalemia was modeled using data from euglycemic hyperinsulinemic glucose clamp studies as described elsewhere.12,13 Since this procedure is not expected to produce any change in the adrenaline concentration, the effect of adrenaline was disregarded.
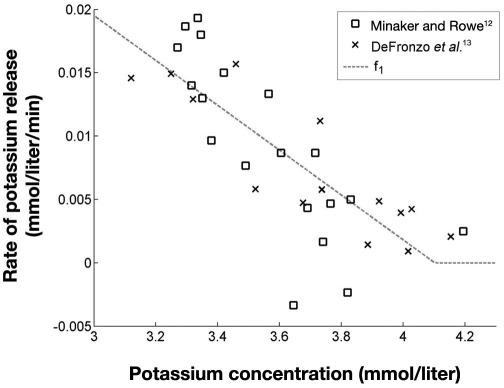
The function f1 was estimated using the measured potassium during six clamps from Minaker and Rowe12 and five clamps from Defronzo and colleagues.13 The change in potassium concentration during the clamps clearly indicated an initial steep gradient, which gradually got smaller with a decreasing plasma potassium concentration. This was interpreted as counterregulation, increasing as potassium decreased.
For each clamp, the mean potassium gradient during the first 30 minutes, , was assumed to be caused by insulin alone with no presence of potassium counterregulation. The remaining 90 minutes of the clamp were divided into parts of 30 minutes. For each of these parts a mean gradient was calculated, and the difference between this mean gradient and expressed the magnitude of the potassium counterregulation. By pairing the magnitude of potassium counterregulation with the corresponding mean potassium level, three data points for each clamp were obtained. In Figure 2 the data points for estimating f1 are shown along with a linear fit.
Figure 2.
Magnitude of hypokalemia counterregulation, f1, as a function of potassium concentration. R2 = 0.65 for the fit of f1.
Data from Minaker and Rowe12 showed a tendency toward exponential development, but considering both data sets, a linear relationship was chosen. The two negative rates in Figure 2 are both from a single clamp from Minaker and Rowe.12 This clamp did not have the largest fall in potassium the first 30 minutes, unlike all the other clamps from both Minaker and Rowe12 and DeFronzo and colleagues.13 Therefore, the subsequent falls in potassium resulted in negative rates for this clamp.
Hence by fitting data points extracted from DeFronzo and colleagues13 and Minaker and Rowe,12 the potassium counterregulation to hypokalemia, f1, could be described by Equation (2):
| (2) |
Because f1is only expressing the potassium counter-regulation to hypokalemia, the function is, by definition, positive and hence equal to zero when K+ >4.1 mmol/liter, as values above 4.1 mmol/liter will produce negative rates.
Insulin-Induced Potassium Uptake—f2
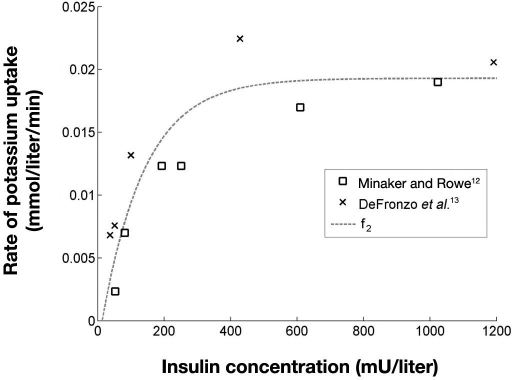
The insulin-induced uptake of potassium from plasma, f2, was also estimated using data from Minaker and Rowe12 and DeFronzo and colleagues.13 The steady-state insulin levels during the different clamps ranged from 37 to 1191 mU/liter12–14 and provided a good basis for estimating the effect of different insulin levels on the plasma potassium. As explained previously, the mean potassium gradient during the first 30 minutes of each clamp, , was assumed to be caused by insulin alone. Thus data points for estimating f2 were obtained by pairing the for each clamp with its steady-state insulin concentration.
Data points, along with an exponential fit, are shown in Figure 3. Data points in Figure 3 indicate that the two studies produce two different curves. The difference could be caused by differences in study population, design, and/or analytical procedures.
Figure 3.
Rate of insulin-induced uptake of potassium, f2, as a function of insulin concentration. R2 = 0.81 for the fit of f2.
A negative exponential function [Equation (3)] was fitted to data points, as also shown in Figure 3.
| (3) |
In Equation (3), f2 is constrained to positive rates as we only model the potassium-lowering effect of insulin. Therefore, the rate is equal to zero where the fit would otherwise predict a negative rate.
Adrenaline-Induced Uptake of Plasma Potassium—f3
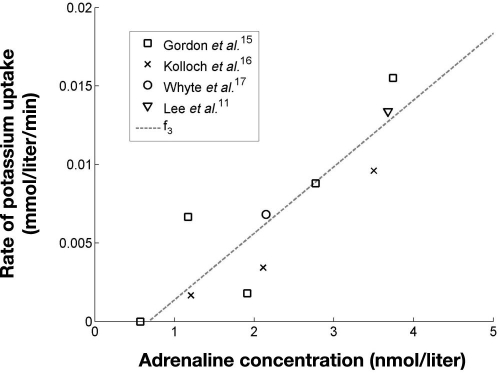
The adrenaline-induced uptake of potassium, f3, was modeled using data obtained elsewhere.11,15–17 In all studies, adrenaline was infused either at one or at different rates and plasma potassium was measured, thus giving the opportunity to estimate the effect of adrenaline alone on potassium.
To be able to isolate the effect of adrenaline, f3 was isolated from Equation (1). This is shown in Equation (4):
| (4) |
In three of the studies,11,16,17 adrenaline was infused at different rates for at least 1 hour and it was assumed that potassium had reached steady state, implying ΔK+/Δt = 0. Therefore, the effect of adrenaline could be estimated using Equation (2) and Equation (5):
| (5) |
Insulin concentrations were measured only in the study by Gordon and colleagues15 where they did not change significantly from baseline during the different infusions. It was, therefore, assumed that the insulin concentration in the three other studies was 19 mU/liter, which was the mean insulin level from Gordon and associates.15
In the study by Gordon and associates,15 adrenaline was infused at increasing rates, with each infusion rate maintained for 30 minutes. Because the potassium steady state cannot be assumed after 30 minutes of infusion,18 data points from Gordon and colleagues15 were not extracted using Equation (5). Instead the potassium concentration measured every 30 minutes was differentiated, which enabled ΔK+/Δt to be estimated. The corresponding adrenaline level, insulin level, and degree of potassium counterregulation were determined by interpolating between the two points used in the differentiation.
The calculation of f3 is shown in Equation (6), where “i” indicates a measurement and “i + 1” is the next measurement taken 30 minutes after “i”.
| (6) |
Data points for estimating f3, along with a linear fit of data [Equation (7)], are shown in Figure 4.
| (7) |
Figure 4.
Rate of adrenaline-induced uptake of potassium, f3, as a function of adrenaline concentration. R2 = 0.78 for the fit of f3.
As with f2, f3is constrained to positive values and set to zero where the function would otherwise produce a negative result.
Model Implementation
The model was implemented in MATLAB version 7.7.0.471 (MathWorks, Natick, MA), and a fourth-order Runge–Kutta algorithm was used for numerical simulation of the model. All simulations were carried out using measured values of insulin and adrenaline if applicable. Baseline measurements of plasma potassium were used as the initial potassium concentration in the simulations. If a baseline measurement of potassium was not available, the first measurement in the data series was used as the baseline.
Model Evaluation
Model simulations were evaluated using the root mean squared error (RMSE) and normalized RMSE (NRMSE). Only data points at times where measurements of plasma potassium were available were used to calculate the RMSE. Baseline measurements were not used in calculations of the RMSE. Equation (8) and Equation (9) show the calculations of RMSE and NRMSE, respectively.
| (8) |
| (9) |
In addition to RMSE and NRMSE, the difference in nadir (DIN) between measured and simulated plasma potassium was also calculated as a direct measure of the ability of the model to simulate the degree of hypokalemia. DIN was calculated as shown in Equation (10):
| (10) |
Results
The developed model was tested on data obtained elsewhere.4,10,19
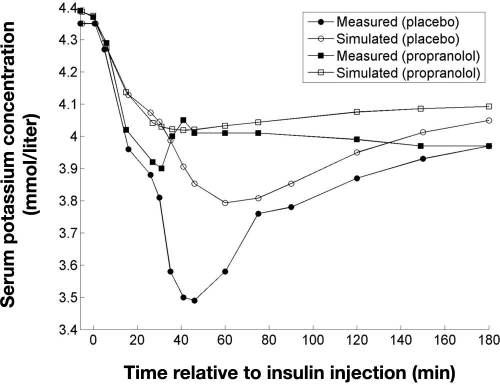
In the study by Petersen and associates,10 hypoglycemia was induced in healthy subjects by an intravenous bolus of porcine insulin (0.1 U/kg) with oral administration of either propranolol or a placebo. Potassium was measured in serum instead of plasma in this study but concentrations were assumed equivalent. Simulation of plasma potassium under the administration of propranolol was done by setting f3 = 0, as propranolol eliminates the effect of adrenaline. The result of simulating plasma potassium, along with the measured serum potassium levels, is shown in Figure 5.
Figure 5.
Measured serum potassium and simulated plasma potassium following an intravenous injection of insulin (0.1 U/kg) resulting in hypoglycemia (blood glucose <32 mg/dl) 30 minutes after injection. Subjects were given an oral dose of propranolol (160 mg) or placebo before the insulin injection. Data adapted from Petersen and colleagues.10
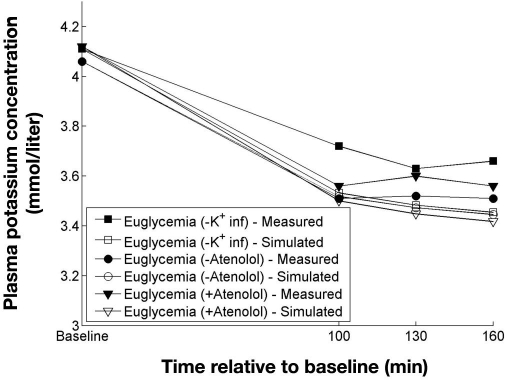
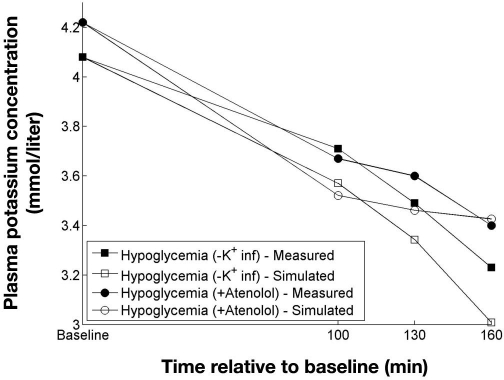
Robinson and colleagues4 performed euglycemic and hypoglycemic clamps in a study with and without potassium infusion, as well as with and without atenolol. The clamps with potassium infusion were not used and neither was the hypoglycemic clamp without atenolol, as adrenaline measurements for this clamp were not available. Insulin was only measured at baseline and at the end of the clamps. Because fixed insulin infusions (80 mU/m2/kg) were used from baseline to the end of the clamps, it was assumed that the insulin concentration was constant throughout the clamps. Results of simulating the clamps from Robinson and associates4 are shown in Figures 6 and 7.
Figure 6.
Measured and simulated potassium concentrations from three euglycemic clamps. Data adapted from Robinson and colleagues.4
Figure 7.
Measured and simulated potassium concentrations from two hypoglycemic clamps. Data adapted from Robinson and colleagues.4
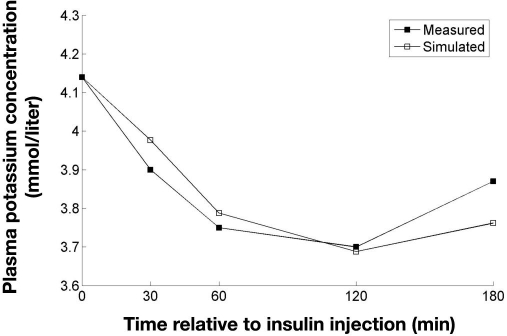
Beretta-Piccoli and colleagues19 used the oral glucose tolerance test (OGTT) on 10 normal subjects and measured both insulin and potassium. Adrenaline was not measured, but because hypoglycemia was not induced in this study, the effect of adrenaline was disregarded in the simulations. Simulation of experimental data from Beretta-Piccoli and colleagues19 is shown in Figure 8.
Figure 8.
Measured and simulated potassium levels following an OGTT. Data adapted from Beretta-Piccoli and colleagues.19
Table 1 shows the RMSE, NRMSE, and DIN of the simulations of plasma potassium in the three studies.
Table 1.
Results from Simulations of Plasma Potassium from Three Published Studiesa
| Study | Group | RMSE (mmol/liter) | NRMSE (%) | DIN (mmol/liter) |
|---|---|---|---|---|
| Petersen and colleagues10 | Placebo | 0.17 | 20 | 0.30 |
| Propranolol | 0.06 | 14 | 0.12 | |
| Robinson and colleagues4 | Euglycemia | 0.11 | 22 | 0.12 |
| Hypoglycemia | 0.14 | 16 | 0.12 | |
| Beretta-Piccoli and colleagues19 | Normal | 0.05 | 10 | 0.01 |
| Overall mean | 0.11 | 17 | 0.14 | |
Results are expressed as mean RMSE, NRMSE, and DIN.
Discussion
This article describes to the authors' knowledge the first published attempt to simulate changes in plasma potassium using a physiological model. In general, the ability of the model to simulate potassium was good, as indicated by the mean values of RMSE and NRMSE of 0.11 mmol/liter and 17%, respectively. The ability to simulate the degree of hypokalemia expressed by the DIN varied in the tests from 0.01 to 0.3 mmol/liter with a mean of 0.14 mmol/liter.
A closer look at the result from the test in Figure 5 reveals that the model underestimates the effect of both insulin and adrenaline, resulting in a large DIN of 0.3 and 0.12 mmol/liter for placebo and propranolol, respectively. A possible explanation is that the model is built on data from continuous infusions and thus simulates the effect of insulin and adrenaline as if the plasma concentrations were in steady state. However, an intravenous injection of insulin as used in the test gives a large transient rise in insulin, which means that the effect on plasma potassium is possibly different. The same applies to the adrenaline concentration, which increases rapidly as a consequence of the sudden severe hypo-glycemia. Data from Defronzo and colleagues13 show that a large rise in insulin during the first 10 minutes causes a greater fall in potassium compared to the subsequent 10 minutes, which indicates that a sudden rise in insulin has a different effect than continuous infusion.
In the tests using euglycemic (Figure 6) and hypoglycemic (Figure 7) clamps, the model overestimated the effect of insulin and adrenaline, although the performance of the model in general is better than in the test using an intravenous bolus of insulin. Indeed the intravenous bolus of insulin and the hyperinsulinemic clamp represent two extremes. While the former has large transient rises in insulin and adrenaline, the latter maintains the same concentrations for extended periods of time. It is thus no surprise that the model performs differently when tested on data from these two study designs.
The test on data from the OGTT in Figure 8 shows that the model simulates the effect of endogenous insulin secretion on plasma potassium very well, with a DIN of 0.01. The goal in insulin therapy is to mimic the endogenous insulin secretion, and in this respect it is more important that the model be able to simulate potassium during an OGTT than from an intravenous injection of insulin.
In general, tests show that the model is able to simulate the potassium concentration in several clinical settings with an overall good performance. However, a significant issue is the small number of hypoglycemic episodes in the test set. It will be necessary to test the model using more episodes of hypoglycemia to establish the ability of the model to simulate potassium during episodes of hypoglycemia.
Several factors, such as blood pH and certain drugs, are known to affect the potassium level8 but were not included in the model for complexity reasons. Renal function was not included in the model either, although the kidney plays a major role in potassium homeostasis. The reaction time for the kidney is, however, measured in hours and days so its effect is limited when considering changes in potassium during hypoglycemia.20
The performance of the model might suffer from the fact that the physiological mechanisms regulating plasma potassium are not included directly in the model. It is known that both insulin and adrenaline cause an uptake of potassium through activation of the membrane (Na+/K+) ATPase.21,22 It is possible that if the membrane (Na+/K+) ATPase is already activated by one hormone then the effect of the other may be reduced. Such an interaction is not possible in the proposed model. Thus, a future improvement of the model could be to incorporate physiological mechanisms such as the membrane (Na+/K+) ATPase activity directly in the model.
A possible limitation of the model is that it is developed and tested on data from healthy subjects, as data from diabetes subjects were unavailable. There is, however, no clear indication that the effect of either insulin or adrenaline on plasma potassium should be different in people with diabetes. Lee and associates23 investigated changes in potassium during induced hypoglycemia in both normal subjects and subjects with diabetes. They found that normal subjects had a larger fall in potassium but that it was attributed to the higher concentrations of adrenaline seen in normal subjects as compared to subjects with diabetes.
The presented model is a first step toward a method for estimating the potassium-lowering effect of hypoglycemia and thus to predict when hypoglycemia can lead to hypokalemia. It is necessary to further evaluate the model using more physiologically correct data. Such data could include spontaneous hypoglycemia or, alternatively, subcutaneously induced hypoglycemia, preferably from subjects with diabetes.
Conclusion
A model for simulating plasma potassium during hypoglycemia was developed and comprised three components: potassium counterregulation to hypokalemia, insulin-induced potassium uptake of potassium, and adrenaline-induced uptake of potassium. The model was developed and tested on data available from the published literature. Evaluations of the ability of the model to simulate plasma potassium resulted in a mean root mean squared error of 0.11, a mean normalized root mean squared error of 17%, and a mean difference in nadir between measured and simulated potassium of 0.14 mmol/liter. Because the test set consisted of a limited number of hypoglycemic episodes, further tests should be carried out to substantiate the ability of the model to simulate potassium during hypoglycemia. The model is a first step toward being able to estimate the risk of hypokalemia in diabetes and presents a novel view on potassium regulation during hypoglycemia. Additional development and tests of the presented model are subjects of further research.
Abbreviations
- DIN
difference in nadir
- NRMSE
normalized root mean squared error
- OGTT
oral glucose tolerance test
- RMSE
root mean squared error
References
- 1.Tattersall RB, Gill GV. Unexplained deaths of type 1 diabetic patients. Diabet Med. 1991;8(1):49–58. doi: 10.1111/j.1464-5491.1991.tb01516.x. [DOI] [PubMed] [Google Scholar]
- 2.Robinson RT, Harris ND, Ireland RH, Macdonald IA, Heller SR. Changes in cardiac repolarization during clinical episodes of nocturnal hypoglycaemia in adults with Type 1 diabetes. Diabetologia. 2004;47(2):312–315. doi: 10.1007/s00125-003-1292-4. [DOI] [PubMed] [Google Scholar]
- 3.Meinhold J, Heise T, Rave K, Heinemann L. Electrocardiographic changes during insulin-induced hypoglycemia in healthy subjects. Horm Metab Res. 1998;30(11):694–697. doi: 10.1055/s-2007-978960. [DOI] [PubMed] [Google Scholar]
- 4.Robinson RT, Harris ND, Ireland RH, Lee S, Newman C, Heller SR. Mechanisms of abnormal cardiac repolarization during insulin-induced hypoglycemia. Diabetes. 2003;52(6):1469–1474. doi: 10.2337/diabetes.52.6.1469. [DOI] [PubMed] [Google Scholar]
- 5.Moss AJ. Measurement of the QT interval and the risk associated with QTc interval prolongation: a review. Am J Cardiol. 1993;72(6):23B–25B. doi: 10.1016/0002-9149(93)90036-c. [DOI] [PubMed] [Google Scholar]
- 6.Gastaldelli A, Emdin M, Conforti F, Camastra S, Ferrannini E. Insulin prolongs the QTc interval in humans. Am J Physiol Regul Integr Comp Physiol. 2000;279(6):R2022–R2025. doi: 10.1152/ajpregu.2000.279.6.R2022. [DOI] [PubMed] [Google Scholar]
- 7.Heller SR, Robinson RT. Hypoglycaemia and associated hypokalaemia in diabetes: mechanisms, clinical implications and prevention. Diabetes Obes Metab. 2000;2(2):75–82. doi: 10.1046/j.1463-1326.2000.00050.x. [DOI] [PubMed] [Google Scholar]
- 8.Poole-Wilson PA. Potassium and the heart. Clin Endocrinol Metab. 1984;13(2):249–268. doi: 10.1016/s0300-595x(84)80021-3. [DOI] [PubMed] [Google Scholar]
- 9.Fisher BM, Thomson I, Hepburn DA, Frier BM. Effects of adrenergic blockade on serum potassium changes in response to acute insulin-induced hypoglycemia in nondiabetic humans. Diabetes Care. 1991;14(7):548–552. doi: 10.2337/diacare.14.7.548. [DOI] [PubMed] [Google Scholar]
- 10.Petersen KG, Schluter KJ, Kerp L. Regulation of serum potassium during insulin-induced hypoglycemia. Diabetes. 1982;31(7):615–617. doi: 10.2337/diab.31.7.615. [DOI] [PubMed] [Google Scholar]
- 11.Lee S, Harris ND, Robinson RT, Yeoh L, Macdonald IA, Heller SR. Effects of adrenaline and potassium on QTc interval and QT dispersion in man. Eur J Clin Invest. 2003;33(2):93–98. doi: 10.1046/j.1365-2362.2003.01123.x. [DOI] [PubMed] [Google Scholar]
- 12.Minaker KL, Rowe JW. Potassium homeostasis during hyperinsulinemia: effect of insulin level, beta-blockade, and age. Am J Physiol. 1982;242(6):E373–E377. doi: 10.1152/ajpendo.1982.242.6.E373. [DOI] [PubMed] [Google Scholar]
- 13.DeFronzo RA, Felig P, Ferrannini E, Wahren J. Effect of graded doses of insulin on splanchnic and peripheral potassium metabolism in man. Am J Physiol. 1980;238(5):E421–E427. doi: 10.1152/ajpendo.1980.238.5.E421. [DOI] [PubMed] [Google Scholar]
- 14.Rowe JW, Minaker KL, Pallotta JA, Flier JS. Characterization of the insulin resistance of aging. J Clin Invest. 1983;71(6):1581–1587. doi: 10.1172/JCI110914. [DOI] [PMC free article] [PubMed] [Google Scholar]
- 15.Gordon RD, Bachmann AW, Ballantine DM, Thompson RE. Potassium, glucose, insulin interrelationships during adrenaline infusion in normotensive and hypertensive humans. Clin Exp Pharmacol Physiol. 1991;18(5):291–294. doi: 10.1111/j.1440-1681.1991.tb01448.x. [DOI] [PubMed] [Google Scholar]
- 16.Kolloch RE, Kruse HJ, Friedrich R, Ruppert M, Overlack A, Stumpe KO. Role of epinephrine-induced hypokalemia in the regulation of renin and aldosterone in humans. J Lab Clin Med. 1996;127(1):50–56. doi: 10.1016/s0022-2143(96)90165-1. [DOI] [PubMed] [Google Scholar]
- 17.Whyte KF, Whitesmith R, Reid JL. The effect of diuretic therapy on adrenaline-induced hypokalaemia and hypomagnesaemia. Eur J Clin Pharmacol. 1988;34(4):333–337. doi: 10.1007/BF00542432. [DOI] [PubMed] [Google Scholar]
- 18.Brown MJ, Brown DC, Murphy MB. Hypokalemia from beta2-receptor stimulation by circulating epinephrine. N Engl J Med. 1983;309(23):1414–1419. doi: 10.1056/NEJM198312083092303. [DOI] [PubMed] [Google Scholar]
- 19.Beretta-Piccoli C, Weidmann P, Flammer J, Glück Z, Bachmann C. Effects of standard oral glucose loading on the renin-angiotensin-aldosterone system and its relationship to circulating insulin. J Mol Med. 1980;58(9):467–474. doi: 10.1007/BF01476801. [DOI] [PubMed] [Google Scholar]
- 20.Field MJ, Giebisch GJ. Hormonal control of renal potassium excretion. Kidney Int. 1985;27(2):379–387. doi: 10.1038/ki.1985.20. [DOI] [PubMed] [Google Scholar]
- 21.Gavryck WA, Moore RD, Thompson RC. Effect of insulin upon membrane-bound (Na++ K+)-ATPase extracted from frog skeletal muscle. J Physiol. 1975;252(1):43–58. doi: 10.1113/jphysiol.1975.sp011133. [DOI] [PMC free article] [PubMed] [Google Scholar]
- 22.Clausen T, Flatman JA. The effect of catecholamines on Na-K transport and membrane potential in rat soleus muscle. J Physiol. 1977;270(2):383–414. doi: 10.1113/jphysiol.1977.sp011958. [DOI] [PMC free article] [PubMed] [Google Scholar]
- 23.Lee SP, Yeoh L, Harris ND, Davies CM, Robinson RT, Leathard A, Newman C, Macdonald IA, Heller SR. Influence of autonomic neuropathy on QTc interval lengthening during hypoglycemia in type 1 diabetes. Diabetes. 2004;53(6):1535–1542. doi: 10.2337/diabetes.53.6.1535. [DOI] [PubMed] [Google Scholar]


