A method for distinguishing and displaying the arrival times of intravenously administered contrast material in a vascular territory, as determined with three-dimensional time-resolved contrast-enhanced MR angiography, is presented.
Abstract
This study was HIPAA compliant and institutional review board approved, and informed consent was obtained from all volunteers. The authors describe a method for generating a time-of-arrival (TOA) map of intravenously administered contrast material, as observed in a time series of three-dimensional (3D) contrast material–enhanced magnetic resonance (MR) angiograms. The method may enable visualization and interpretation, on one 3D image, of the temporal enhancement patterns that occur in the vasculature. Colorization of TOA values may further aid interpretation. The quality of the results depends not only on the adequacy of the frame rate, spatial resolution, and signal-to-noise ratio of the MR image acquisition method but also on the accuracy and clarity with which the leading edge of the contrast material bolus is depicted. The criteria for optimizing these parameters are described. The TOA mapping technique is demonstrated by using vascular studies of the hands, brain, and lower leg regions.
© RSNA, 2009
Introduction
Since the introduction of contrast material–enhanced magnetic resonance (MR) angiography more than a decade ago (1), there have been steady improvements in the technique. Early advances include the reduction in repetition times for three-dimensional (3D) sequences (2), the development of centric view orders (3,4), and methods for synchronizing image acquisitions with the arterial phase of contrast enhancement (5–7). There has also been interest in generating a time series of 3D image sets (8), but this was subject to a trade-off in temporal resolution for adequate spatial resolution (9).
In the late 1990s, several methods of parallel imaging (10,11) that facilitated a reduction in acquisition time for a given spatial resolution were developed. These methods were initially applied along one phase-encoding direction, and an early application was contrast-enhanced MR angiography (12,13). However, parallel acquisition was also shown to be applicable along the two phase-encoding directions of a 3D Fourier transform acquisition (14). Moreover, for a given acceleration factor, there will be a considerably lower penalty in lost signal-to-noise ratio (SNR) if one achieves the acceleration cumulatively by applying smaller accelerations in each of the two phase-encoding directions as opposed to applying the acceleration factor solely in one direction. Thus, for 3D contrast-enhanced MR angiography, two-dimensional acceleration factors as high as five to eight can be routinely used (15–19).
A consequence of the reduced acquisition time is that a series of high-spatial-resolution 3D images can now be generated within a time period during which only one image might have been obtained previously. With this increased speed, it has become possible to visualize, with high spatial resolution, the dynamic processes that occur within a volume, such as the passage of an intravenously administered contrast agent. This information can be presented as a time series of 3D images. However, it may also be useful to provide this information more concisely, on a single image, and thus possibly allow the observer to clearly distinguish an artery from a nearby vein on the basis of how each vessel is depicted on this image.
Time-of-arrival (TOA) mapping has been used previously with several imaging modalities. In x-ray digital subtraction angiography, the passage of contrast material was imaged at several frames per second in patients with arteriovenous malformations, and the contrast material arrival time was determined and converted into a color display (20). At ultrasonography, the TOA of contrast material and the peak signal have been determined after the intravenous administration of contrast material and converted into a color display (21). At MR imaging, investigators have used a time series of 3D contrast-enhanced angiograms as input in a process used to segment voxels of the vasculature into two groups—arterial and venous—on the basis of binary binning of the contrast material arrival time (22). This segmentation process was used to isolate the venous system.
The purpose of this work was to evaluate a method of generating a TOA map of intravenously administered contrast material, as observed in a time series of 3D contrast-enhanced MR angiograms. Specifically, the TOA of contrast material is determined for all voxels in the volume and then depicted on a single 3D image.
Materials and Methods
Description of Basic TOA Method
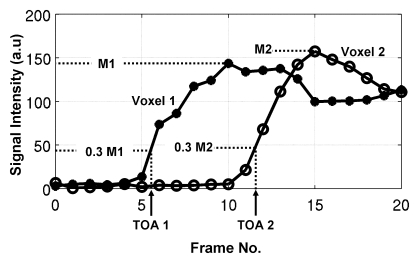
A patent application for the TOA technique described herein, which was invented by one of the authors (S.J.R.), has been filed with the U.S. Patent Office. The basic idea of TOA mapping is to first consider all voxels in the 3D volume of interest. It is assumed that an MR imaging technique that generates a time series of images that encompass contrast material wash-in for all voxels will be performed. The signal intensity (SI) values determined over time are analyzed voxel by voxel according to a specific algorithm. Typically, before contrast material arrival, each voxel has a mean baseline SI. When the contrast material arrives, then depending on the image acquisition rate, characteristic time constant of contrast material passage, and nature of how the contrast material affects the MR imaging signal, the SI at that location will be altered over time. SI analysis can be used to assign a TOA of contrast material in that voxel, and this is repeated for all voxels in the volume. This process is illustrated in Figure 1, which is a plot of SI versus time for two voxels in a volume imaged with a time-resolved 3D MR angiographic sequence. For the first several frames, the SIs are at baseline; deviations are due to statistical noise. The SI of the first voxel then starts to increase until it reaches a maximal value. This behavior is subsequently mimicked by the SI in voxel 2.
Figure 1:
SI versus frame number for two voxels at time-resolved MR angiography. SIs increase in response to arrival and transit of contrast material. TOA is determined for each voxel by first identifying maximal measured SIs (M1 and M2for Voxel 1 and Voxel 2, respectively), next calculating 0.30 of maximal values (0.3 M1, 0.3 M2), and finally interpolating between the frame numbers whose respective SIs straddle these 0.30 values. In this example, for voxel 1, TOA is determined to be 5.5 frame intervals after time origin. For voxel 2, TOA is 11.6 frame intervals. From knowledge that frame interval is 5.4 seconds, absolute TOA values for voxels 1 and 2 are 29.7 and 62.6 seconds, respectively. a.u = Arbitrary unit.
There are multiple ways to define the TOA, given a set of SI values, such as those shown in Figure 1. The approach used in this research involves first determining for each voxel the maximal SI measured in the time series. The TOA of contrast material in a voxel is then defined as the time at which the SI in that voxel first attains 30% of its maximal value. Generally, this does not occur exactly at one of the measured times, so the TOA is determined by means of linear interpolation between those two time points whose SI values straddle the 30% level. This process is shown in Figure 1. The 30% threshold is somewhat arbitrary. As seen in Figure 1, smaller values might be allowed at the SNR levels of the data, but larger values would undesirably generate TOA values well along the rising enhancement curve. This process is repeated for all voxels in the 3D volume and yields a set of TOA values that can be presented as an image. In this work, all voxels were treated independently and thus yielded different TOA values across any vessel lumen larger than the typical 1-mm-voxel dimension. Other algorithms for selecting the TOA are possible and include the technique described by Cover et al (20).
One can computationally set an arbitrarily small numeric increment between the TOA values for display. The important factor is that this increment is smaller than the intrinsic uncertainty or temporal resolution of the TOA values themselves. This is akin to the 1-HU increment in displayed values on an x-ray computed tomography (CT) scanner being selected as a fraction of the intrinsic uncertainty in CT values (typically 5–10 HU). For this work, we estimated the uncertainty in TOA values by first computing the mean difference between the SI values on consecutive MR images that straddled the 30% threshold and then dividing this difference by the standard deviation of the noise level on the images. For enhancing vasculature, this ratio is typically 4.0 or higher. This ratio was then converted to an intrinsic precision, or temporal resolution, in the TOA values of the reciprocal of 4.0, or one-quarter of the frame time.
Specifications of MR Image Acquisition
In the formation of a TOA image, a set of MR images are used as input data, with each 3D set of images reconstructed at a specific time point. Owing to the flexible manner in which MR images are formed, there is considerable latitude in terms of what the term time point means in this context. For 3D contrast-enhanced MR angiography, the measurement time necessary to acquire the k-space data for a single 3D image set is generally 10 seconds or longer. The issue of extended acquisition time in MR imaging is further complicated by the fact that the SIs measured near the k-space center have a disproportionately larger effect in dictating the overall appearance of the image than do the SIs measured away from the center. This effect forms the basis of centric view orders, as used for MR angiography (3,4).
One obvious requirement for generating a TOA image is that the MR imaging technique have an adequately high frame rate. However, owing to the k-space considerations just described, a high frame rate alone is not adequate for guaranteeing that an MR acquisition technique will have high temporal fidelity. The following additional properties are desirable: (a) The MR image acquisition strategy should be consistent, (b) the k-space center should be compactly measured, (c) the duration of the acquisition per image, referred to as the temporal footprint, should be minimized, and (d) other artifactual SIs should be minimized or avoided. These properties have been studied in related studies (23) and are explained as follows:
The first criterion, a consistent image acquisition strategy, as applied to time-resolved MR angiography means that the time ordering used to measure k-space positions for the formation of one image should be the same for all images. In other words, if the k-space center is measured early within the acquisition time for a given first image, then it should be measured at the same relative time point for all subsequent images. This ensures that the leading edge of the contrast material bolus moving at a fixed velocity will be accurately depicted at equally spaced intervals in the resultant time series of MR images, as shown experimentally with phantoms (23). Measurement of this edge forms the basis of the TOA estimation.
The second criterion, compact k-space center measurement, means that the measurement of the k-space center should be obtained in as short a time as possible, typically during a 3D Fourier transform acquisition with some kind of centric phase encode ordering. This reduces blurring of the leading edge of the contrast material bolus (23). To meet the third criterion, reduction in the overall acquisition time per image, use of an acceleration technique such as two-dimensional sensitivity encoding (14) is useful. Improved temporal fidelity due to a reduction in the temporal footprint has been observed at in vivo contrast-enhanced MR angiography (19).
The final criterion pertains to the reduction of any additional artifacts. Even if all of the preceding criteria are met, the image of an advancing contrast material bolus reconstructed at some time point will invariably deviate from the ideal and unattainable image on which all data are instantaneously acquired. For example, for any one time frame, measurement of high-spatial-frequency k-space values after the central k-space is sampled results in a nonzero SI value in advance of the leading edge of the contrast material bolus (23). Such “anticipation” artifact can be reduced by measuring the central k-space near the end of the acquisition time for each time frame.
MR Image Acquisition and TOA Image Formation
TOA images of the calves and hands of three volunteers were generated from 3D MR angiograms formed by using the Cartesian acquisition with projection-reconstruction–like sampling technique (19). The imaging protocol was Health Insurance Portability and Accountability Act compliant and institutional review board approved, and all volunteers provided written informed consent. All examinations were performed with a 3.0-T MR imaging system (Signa, version 14.0; GE Healthcare, Milwaukee, Wis) by using a fast spoiled gradient-echo sequence with a flip angle of 30° and a bandwidth of ±62.5 kHz. For the calf and hand examinations, the acquisition was coronal in the section-selection anterior-to-posterior, phase-encoding left-to-right, and frequency-encoding superior-to-inferior directions. Also, custom-built multielement coils were used for signal reception (24).
Two-dimensional sensitivity encoding (14) was performed in the transverse plane, with accelerations in the phase (left-to-right) direction (RY) and section (anterior-to-posterior) direction (RZ) that yielded a net sensitivity-encoding acceleration (R): R = RY × RZ. In addition, two-dimensional homodyne acceleration was performed (25) and resulted in a further acceleration of 1.8. Other acquisition parameters are summarized in the Table. For all examinations, 20 mL of contrast material (gadobenate dimeglumine, MultiHance; Bracco Diagnostics, Princeton, NJ) was injected intravenously at 3 mL/sec and followed by a 20-mL saline flush at 3 mL/sec.
Parameters of Time-resolved MR Angiogram Acquisitions for TOA Mapping
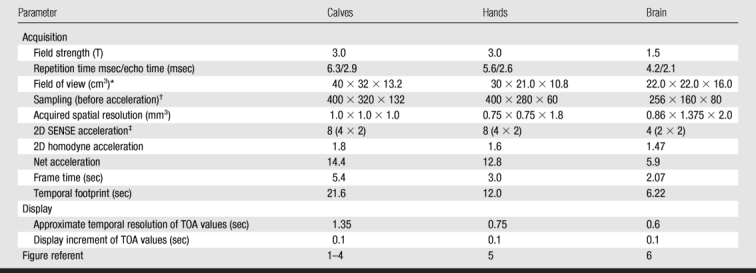
* Field of view in superior-to-inferior times left-to-right times anterior-to-posterior directions.
† Sampling before acceleration is indicated as Nx (frequency encoding) × Ny (phase encoding) × Nz (section encoding).
‡ Two-dimensional (2D) sensitivity-encoding (SENSE) acceleration was calculated by multiplying the acceleration in the phase (left-to-right) direction by the acceleration in the section (anterior-to-posterior) direction.
TOA images were also generated from a patient study in which brain MR angiography was clinically indicated for visualization of an intracranial arteriovenous malformation. The patient provided written informed consent. The arteriovenous malformation examination differed from the volunteer examinations in that it was performed at 1.5 T, the acquisition orientation was sagittal (section-selection left-to-right, phase-encoding anterior-to-posterior, and frequency-encoding superior-to-inferior directions), and an eight-element receiver coil (MRI Devices, Waukesha, Wis) designed for brain imaging was used. Other acquisition and display parameters are summarized in the Table.
Image acquisition was initiated at the time of contrast material administration and typically continued for 2 minutes. Image reconstruction was performed by using a custom computer system interfaced to the MR imaging unit; images were available for viewing 2 minutes after the acquisition. The resultant time series of 3D MR angiograms was then electronically transferred to another computer where TOA maps were created offline by using the algorithm described earlier. The computation time for TOA map creation typically was less than 1 minute.
The Cartesian acquisition with projection-reconstruction–like sampling sequence was designed to meet the criteria for high temporal fidelity described earlier. Each time frame is reconstructed from a single sampling of the center of the kY–kZ space by using elliptical centric ordering and from four subsets of samples of the outer k-space. Central k-space samples and one subset of outer k-space samples are updated at each time frame, while the other three subsets are shared frame to frame. The updated subset changes at each frame. In each frame, the central k-space is sampled at the same phase near the end of the acquired data. This sequence has been shown experimentally—in phantom studies—to have high accuracy and precision in the depiction of the leading edge of an advancing contrast material bolus (23). For example, for a leading edge moving at 16 mm/sec, the depicted edge position is within 3% of the true edge position at the instant of sampling of the central-most phase encode, with edge blurring at less than 20% of the distance moved from frame to frame. This velocity is typical of the velocity of an advancing contrast material bolus in the lower legs (25).
Enhancements of the Basic TOA Algorithm
In a typical 3D volume containing a vascular bed, the majority of voxels are located in nonvascular materials such as soft tissue, fat, and bone, and it may not be useful or desirable to define a TOA of contrast material in these structures. In this study, the MR angiogram series comprised difference images, the first 3D image of which was acquired well before the contrast material arrival and subtracted from all subsequent images. Thus, on the difference images, background tissues showed very little enhancement. To exclude background tissue from the TOA display, we assigned an opacity value, which was greater than or equal to 0 but less than or equal 1, to each voxel during TOA map generation, with the opacity of a voxel increasing approximately in proportion to the maximal SI observed in that voxel. The opacity value was used to weight the TOA value in the display. Thus, voxels with low maximal SI had minimal opacity and tended to be excluded from the display.
Once the TOA information is acquired, there are various ways that it can be presented. One method is to convert each arrival time to a gray shade, with the earliest arrival times encoded in black and the latest times encoded in white. An alternative is to use a color scale—for example, encode early arrival times in dark red and late arrival times in dark blue, with a red-to-blue color scale used for intermediate TOA values. A variation of this approach is to apply a time window to the TOA image, on which only those voxels whose TOA values fall within the two endpoints of the window are displayed. This window, similar to alterations in the window and level of MR and CT data displays, can be moved interactively with subsecond response along the TOA scale to display specific ranges of arrival time.
Results
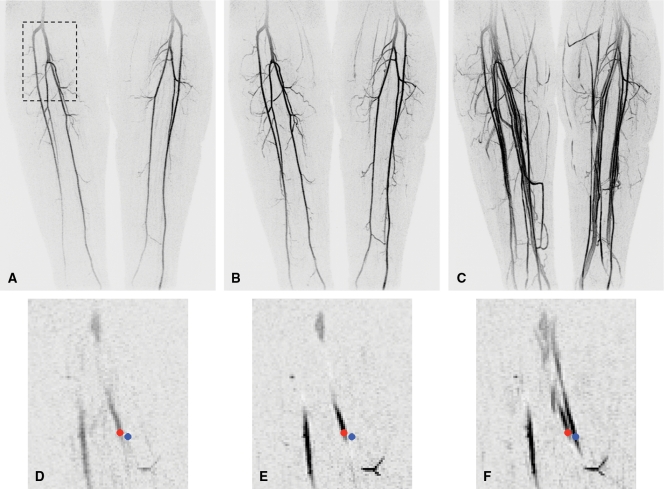
The images in Figure 2 illustrate TOA determination. Coronal maximum intensity projections (MIPs) of the lower leg vasculature are shown at several frame times after the contrast material injection. TOA values are not determined from the MIP results; rather, they are formed voxel by voxel in the entire 3D volume. These input data are illustrated as enlarged portions of a coronal partition taken from within the 3D volume. Red and blue markers in the partitions mark two locations: one in the posterior tibial artery and one in a nearby vein. Each marker is approximately 9 voxels in area, and the SIs measured in the central voxel of each marker are presented in Figure 1; resultant TOA values are 29.7 and 62.6 seconds.
Figure 2:
Initial data set and sample voxels for TOA mapping at MR angiography of calves. A–C, Full coronal MIPs of frames 7 (A), 10 (B), and 17 (C) from 3D time-resolved examination. At frame time of 5.4 seconds, these correspond to 37.8, 54.0, and 91.8 seconds, respectively, after initiation of contrast material injection. D–F, Portions of coronal partition taken midway through stack of partitions comprising entire 3D volume. Superior-to-inferior and left-to-right boundaries of these image portions are outlined by dashed box in A. Frame times of D–F correspond to those of A–C, respectively. Small red dots are in right posterior tibial artery, and small blue dots are in nearby vein. Central voxels in red and blue markers were used to define voxels 1 and 2, respectively, in Figure 1, and time series of SIs measured at these points are plotted in Figure 1.
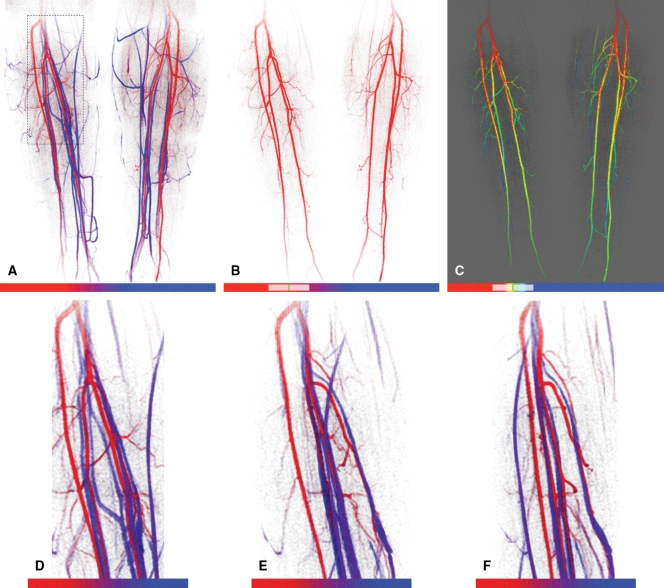
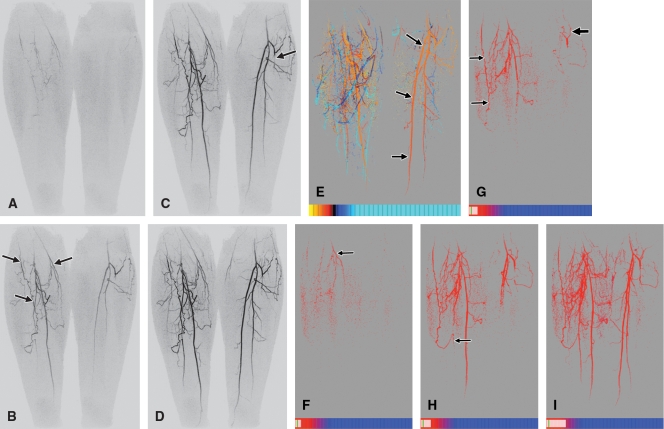
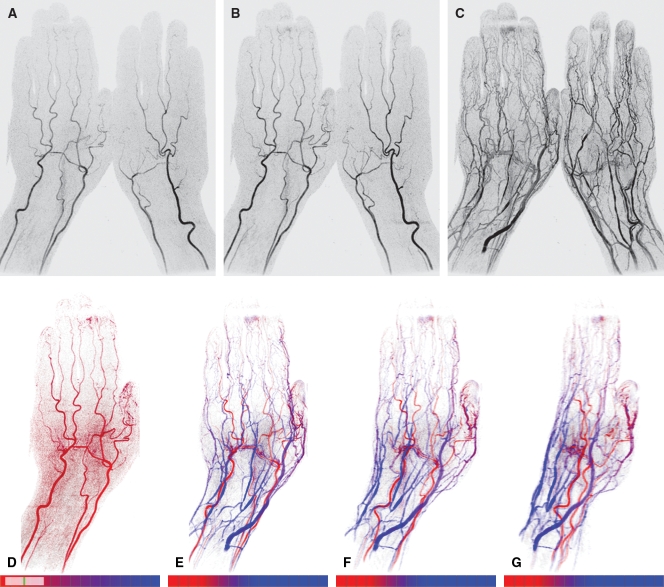
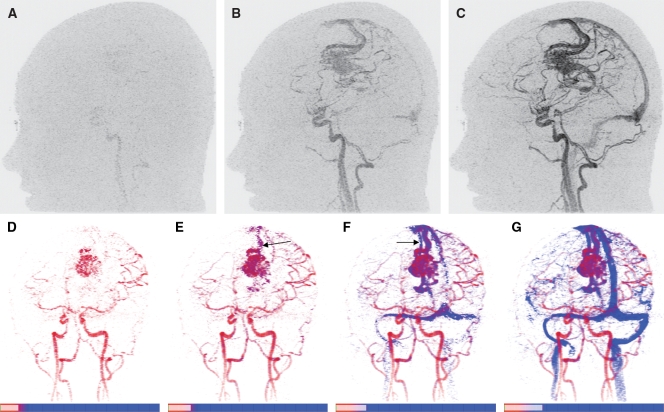
The TOA values were converted into a color scale, and the resultant anterior projection of the full volume is shown in Figure 3. The color scale was constructed such that dark red corresponded to the earliest possible arrival time in the volume, 0 seconds after contrast material injection, while dark blue corresponded to the latest arrival time, 83 seconds. The use of a limited temporal window applied to the TOA values is illustrated in Figures 3, B, and, 3, C, with the depiction of only those TOA values in the range of 23.2–44.8 seconds in both cases. In Figure 3, C, a red-green-blue color scale is used to discriminate TOA values obtained during the arterial phase. Magnifications of the right popliteal trifurcation at several oblique angles are also shown to illustrate the 3D nature and spatial resolution of the TOA map. This is further illustrated in an online movie (Movie 1 [online]). Figure 4 shows TOA results from an MR angiographic examination in a patient with peripheral artery disease. Figure 5 shows TOA results from an MR angiographic examination of the hands. Results from Figures 4 and 5 are further illustrated in online movies (Movies 2, 3 [online]). Figure 6 shows TOA results from an MR angiographic examination in a patient with arteriovenous malformation.
Figure 3:
TOA mapping from MR angiographic examination in Figure 2. A, Anterior projection of TOA map; TOA values of all pixels are subject to the opacity criterion described in text. Red-to-blue scale spans TOA values from frames 0–21 (0–113.4 seconds after contrast material injection). On color scales (bottom), hash marks indicate individual 5.4-second frame intervals. Color transition from red to blue occurs across frames 6–13. B, Anterior TOA map of anatomic region in A but with display limited to arrival times between frames 4.3 and 8.3 (23.2–44.8 seconds), as indicated schematically on color scale. This tends to limit display to major arterial vasculature in calves. C, Same limited extent of TOA values as in B but with color mapping adjusted from red only to red, green, and blue to better distinguish early versus late arrival times within 23.2–44.8-second range displayed. D–F, Magnifications of anatomic region at right popliteal trifurcation outlined by dashed rectangle in A, with same TOA color scale as in A. Images are shown as if viewed directly from anterior direction (0°) (A) and at 45° (B) and 80° (C) medially.
Figure 4:
TOA mapping in patient with peripheral vascular disease. A–D, Coronal full-field-of-view MIPs of lower legs show time-resolved data from frames 5–8, corresponding to 27.0 (A), 32.4 (B), 37.8 (C), and 43.2 (D) seconds after contrast material injection. Note prominent genicular arteries (arrows) on right side in B and occluded left anterior tibial artery (arrow) just distal to origin in C. E, Anterior TOA map of full volume. As keyed on scales at bottom, TOA window starts at frame 3 (16.2 seconds) after injection, and each division represents one 5.4-second time frame. Red-green-blue-cyan scale was chosen to differentiate arrival times across arterial and venous phases. Orange-to-red color change from proximal to distal region in left posterior tibial artery (arrows) illustrates progressively longer arrival times in range of four to six frames after injection. In right leg, superficial calf veins (deep blue) have earlier TOAs than ankle vessels (cyan). F–I, TOA windowing illustrates contrast material progression in collateral vessels. All images were constructed at same right anterior oblique projection. Red-to-blue scale is different from that in E but, as before, the smallest TOA displayable, and the starting value of TOA window is frame 3. End values of TOA window are at frames 4.6 (24.8 seconds) (F), 5.3 (28.6 seconds) (G), 5.8 (31.3 seconds) (H), and 8.5 (45.9 seconds) (I). Progression of TOA images illustrates filling of medial right genicular arteries (arrow) (F), distal filling of lateral posterior right artery (thin arrows) and filling of left genicular artery (thick arrow) (G), spontaneous anastomosis of genicular artery with right posterior tibial artery (arrow) and filling of proximal portions of left posterior tibial artery and left peroneal artery (H), and later filling of posterior tibial artery and peroneal arteries bilaterally (I).
Figure 5:
TOA mapping in hand. A–C, Coronal full-field-of-view MIPs show time-resolved MR angiographic data set from frames 10 (A), 11 (B), and 19 (C). These data correspond to 30.0, 33.0, and 57.0 seconds, respectively, after contrast material injection. D, Dorsal TOA map of same left hand, with display limited to TOA values from frames 7.8–11.0 (23.4–33.0 seconds after injection). This map tends to highlight arterial vasculature. E–G, TOA maps display full range of TOA values from 24 to 72 seconds, with use of red-to-blue scale, on pure (0°) dorsal view (E) matching that in D and at oblique angulations of 30° (F) and 60° (G).
Figure 6:
TOA mapping of brain vasculature in patient with left-hemisphere arteriovenous malformation. A–C, Sagittal full-field-of-view MIPs illustrate progressive enhancement of vasculature. Frames 9 (A), 10 (B), and 11 (C) were generated 18.6, 20.7, and 22.8 seconds, respectively, after contrast material injection. D–G, TOA maps of 3D volume at same left anterior oblique projection. Same color mapping is used for all images: Deep red corresponds to shortest TOA, eight frames (16.6 seconds) after injection, and red-to-blue transition occurs across frames 9–11, approximately matching TOA times in nidus of arteriovenous malformation. Range of TOA values is encoded in scales (bottom), with each division marking one time frame (2.07 seconds each). Specific TOA range for each image increases from 8.0 frames to 9.7 frames (D), to 10.2 frames (E), to 10.8 frames (F), and to 11.6 frames (G). Early draining vein (arrow) is seen in E, and late-filling draining vein (arrow) is seen in F. Example illustrates how temporal resolution of TOA mapping, shown here as 0.5–0.8-frame intervals between TOA images, is finer than temporal sampling in original time-resolved MR angiographic data set (1.0-frame interval).
Discussion
We describe a method of distinguishing and displaying the arrival times of intravenously administered contrast material in a vascular territory, as determined with 3D time-resolved contrast-enhanced MR angiography. TOA maps may facilitate the differentiation between arterial and venous structures in a 3D volume.
The accuracy of TOA mapping depends on the quality of the time-resolved MR angiograms from which the TOA information is derived. It is critical that the MR images, in addition to having adequate frame rate, SNR, and spatial resolution, depict the leading edge of the contrast material bolus with high accuracy and precision. Specific criteria required for these characteristics include consistency of k-space sampling from one time frame to the next for accurate depiction of moving objects, compactness of central k-space sampling to freeze the position of the leading edge of the bolus, minimization of the acquisition time per frame to reduce temporal blurring, and minimization of any artifacts such as premature signal enhancement of vascular structures.
We believe that this work represents an advance over the study of Du et al (22). The intrinsic spatial resolution of the images of the lower legs obtained in this study (1.0 mm3 isotropic vs 1.0 × 1.0 × 1.5 mm) within a comparable time frame (5.4 vs 4.3 seconds) but shorter total acquisition time per image (21.6 vs 70.0 seconds) was superior. This improvement was due to the greater than 10-fold acceleration facilitated by the parallel acquisition and the homodyne of the Cartesian acquisition with projection-reconstruction–like sampling in our study. This examination also extends beyond separating veins from arteries, as in the Du et al study (22), to also enable accurate determination of the absolute TOA value for all enhancing vessels, with precision in the range of 1 second. To this end, we believe that in this work we have identified a more detailed level of evaluating time-resolved MR angiographic findings compared with those used previously. We believe that the interactive color scale and temporal windowing, also introduced herein, facilitate the presentation of this TOA information.
It was beyond the scope of this work to consider other time-resolved techniques such as time-resolved imaging of contrast kinetics (TRICKS) (8), keyhole (17,26), time-resolved imaging with stochastic trajectories (TWIST) (27), and highly constrained back projection (HYPR) (28). Because the quality of the TOA mapping depends on the temporal accuracy and spatial sharpness, or fidelity, with which the leading edge of the contrast material bolus is depicted in a sequence of images, it is important that the demonstration of these characteristics for these sequences is similar to that in studies performed for Cartesian acquisition with projection-reconstruction–like sampling (23). Specific aspects of these other time-resolved sequences that may degrade fidelity are k-space interpolation (TRICKS), sampling of high-frequency k-space at times distant from the time of central k-space sampling (keyhole), extensive sampling of high-frequency k-space after sampling of central k-space (TWIST), and prolonged sampling of the k-space center intrinsic to projection-reconstruction methods (HYPR). It is conceivable, however, that each of these methods could yield accurate TOA values.
It is important that the time-resolved MR angiogram set that constitutes the input for TOA mapping have adequate SNR. The MR angiograms acquired in this study were typical of those generated in multiple previous studies and had adequate SNR for radiologic interpretation (19,29). We believe this was attributable to (a) receiver coil arrays that were matched to the anatomic region being studied (24), (b) our use of two-dimensional rather than one-dimensional acceleration techniques to preserve the SNR (14), and (c) some intrinsic preservation of the SNR at accelerated contrast-enhanced MR angiography (30). In the future, it may be desirable to extend the superior-to-inferior coverage of the custom-built leg coils.
Several other points can be made. First, the use of opacity of the TOA values gives directionality to TOA maps. Second, TOA mapping may address the ambiguity in distinguishing arteries from veins that one encounters when interpreting MR angiograms with use of intravascular contrast agents (31). Third, TOA mapping is quantitative: By synchronizing the MR data acquisition with the initiation of contrast material injection, one can measure the TOA values in absolute time. The TOA values calculated in this work are consistent with those previously reported for contrast-enhanced MR angiography of the calves (32) and hands (33).
This study had several limitations. First, the effects of the SNR of the acquired images on TOA accuracy should be studied more rigorously. Second, similar to flow determination with phase-difference methods, partial volume effects at edge voxels that include both the lumen and the vessel wall may cause inaccurate TOA values. Third, although the 20-mL contrast material dose used in these examinations is characteristic of our clinical practice, smaller doses might be used. Fourth, although the described results were not disrupted by patient motion, it remains to be seen whether accurate TOA mapping is possible in anatomic regions with higher levels of motion, such as the thorax and abdomen. Finally, although much of the TOA mapping process is already automated, it would be useful to develop the automation further to include, for example, automatic matching of the color transitions to the range of TOA values in the examination.
In summary, a TOA map may be generated from image sets formed from 3D time-resolved contrast-enhanced MR angiography to enable visualization, on one image, of the temporal enhancement patterns of the vasculature in a 3D volume. The technique is best performed in conjunction with MR image acquisition methods that have a high degree of temporal fidelity.
Advances in Knowledge.
Time-of-arrival (TOA) maps can be generated from three-dimensional (3D) time-resolved contrast-enhanced MR angiograms to depict, on a single image, the contrast material arrival times in the enhancing vasculature.
The isotropic spatial resolution of TOA maps of the peripheral vasculature was 1 mm.
TOA mapping is quantitative, yielding TOA values that represent the absolute time after injection that contrast material arrives in a voxel.
TOA values can be calculated and presented with a temporal resolution of approximately 1 second.
Implication for Patient Care.
TOA maps may facilitate the interpretation of time-resolved contrast-enhanced 3D MR angiograms.
Supplementary Material
Acknowledgments
We acknowledge the assistance of Norbert G. Campeau, MD, and James F. Glockner, MD, PhD.
Received January 12, 2009; revision requested February 6; revision received April 1; accepted May 5; final version accepted May 12.
Funding: This research was supported by National Institutes of Health (grants EB000212, HL070620, RR018898).
See Materials and Methods for pertinent disclosures.
Supplemental material: http://radiology.rsna.org/lookup/suppl/doi:10.1148/radiol.2532082322/-/DC1
Abbreviations:
- MIP
- maximum intensity projection
- SI
- signal intensity
- SNR
- signal-to-noise ratio
- 3D
- three-dimensional
- TOA
- time of arrival
References
- 1.Prince MR. Gadolinium-enhanced MR aortography. Radiology 1994;191:155–164 [DOI] [PubMed] [Google Scholar]
- 2.Prince MR, Narasimham DL, Stanley JC, et al. Breath-hold gadolinium-enhanced MR angiography of the abdominal aorta and its major branches. Radiology 1995;197:785–792 [DOI] [PubMed] [Google Scholar]
- 3.Wilman AH, Riederer SJ. Performance of an elliptical centric view order for signal enhancement and motion artifact suppression in breathhold three dimensional gradient echo imaging. Magn Reson Med 1997;38:793–802 [DOI] [PubMed] [Google Scholar]
- 4.Willinek WA, Gieseke J, Conrad R, et al. Randomly segmented central k-space ordering in high-spatial-resolution contrast-enhanced MR angiography of the supraaortic arteries: initial experience. Radiology 2002;225:583–588 [DOI] [PubMed] [Google Scholar]
- 5.Earls JP, Rofsky NM, DeCorato DR, Krinsky GA, Weinreb JC. Breath-hold single-dose gadolinium-enhanced three-dimensional MR aortography: usefulness of a timing examination and MR power injector. Radiology 1996;201:705–710 [DOI] [PubMed] [Google Scholar]
- 6.Foo TK, Saranathan M, Prince MR, Chenevert TL. Automated detection of bolus arrival and initiation of data acquisition in fast, three-dimensional, gadolinium-enhanced MR angiography. Radiology 1997;203:275–280 [DOI] [PubMed] [Google Scholar]
- 7.Wilman AH, Riederer SJ, King BF, Debbins JP, Rossman PJ, Ehman RL. Fluoroscopically triggered contrast-enhanced three-dimensional MR angiography with elliptical centric view order: application to the renal arteries. Radiology 1997;205:137–146 [DOI] [PubMed] [Google Scholar]
- 8.Korosec FR, Frayne R, Grist TM, Mistretta CA. Time-resolved contrast-enhanced 3D MR angiography. Magn Reson Med 1996;36:345–351 [DOI] [PubMed] [Google Scholar]
- 9.Mistretta CA, Grist TM, Korosec FR, et al. 3D time-resolved contrast-enhanced MR DSA: advantages and tradeoffs. Magn Reson Med 1998;40:571–581 [DOI] [PubMed] [Google Scholar]
- 10.Sodickson DK, Manning WJ. Simultaneous acquisition of spatial harmonics (SMASH): fast imaging with radiofrequency coil arrays. Magn Reson Med 1997;38:591–603 [DOI] [PubMed] [Google Scholar]
- 11.Pruessmann KP, Weiger M, Scheidegger MB, Boesiger P. SENSE: sensitivity encoding for fast MRI. Magn Reson Med 1999;42:952–962 [PubMed] [Google Scholar]
- 12.Sodickson DK, McKenzie CA, Li W, Wolff S, Manning WJ, Edelman RR. Contrast-enhanced 3D MR angiography with simultaneous acquisition of spatial harmonics: a pilot study. Radiology 2000;217:284–289 [DOI] [PubMed] [Google Scholar]
- 13.Weiger M, Pruessmann KP, Kassner A, et al. Contrast-enhanced 3D MRA using SENSE. J Magn Reson Imaging 2000;12:671–677 [DOI] [PubMed] [Google Scholar]
- 14.Weiger M, Pruessmann KP, Boesiger P. 2D SENSE for faster 3D MRI. MAGMA 2002;14:10–19 [DOI] [PubMed] [Google Scholar]
- 15.Meckel S, Mekle R, Taschner C, et al. Time-resolved 3D contrast-enhanced MRA with GRAPPA on a 1.5-T system for imaging of craniocervical vascular disease: initial experience. Neuroradiology 2006;48:291–299 [DOI] [PubMed] [Google Scholar]
- 16.Hu HH, Campeau NG, Huston J, 3rd, Kruger DG, Haider CR, Riederer SJ. High-spatial-resolution contrast-enhanced MR angiography of the intracranial venous system with fourfold accelerated two-dimensional sensitivity encoding. Radiology 2007;243:853–861 [DOI] [PMC free article] [PubMed] [Google Scholar]
- 17.Hadizadeh DR, von Falkenhausen M, Gieseke J, et al. Cerebral arteriovenous malformation: Spetzler-Martin classification at subsecond-temporal-resolution four-dimensional MR angiography compared with that at DSA. Radiology 2008;246:205–213 [DOI] [PubMed] [Google Scholar]
- 18.Taschner CA, Gieseke J, Le Thuc V, et al. Intracranial arteriovenous malformation: time-resolved contrast-enhanced MR angiography with combination of parallel imaging, keyhole acquisition, and k-space sampling techniques at 1.5 T. Radiology 2008;246:871–879 [DOI] [PubMed] [Google Scholar]
- 19.Haider CR, Hu HH, Campeau NG, Huston J, 3rd, Riederer SJ. 3D high temporal and spatial resolution contrast-enhanced MR angiography of the whole brain. Magn Reson Med 2008;60:749–760 [DOI] [PMC free article] [PubMed] [Google Scholar]
- 20.Cover KS, Lagerwood FJ, van den Berg R, Buis DR, Slotman BJ. Color intensity projection of digitally subtracted angiography for the visualization of brain arteriovenous malformations. Neurosurgery 2007;60:511–515 [DOI] [PubMed] [Google Scholar]
- 21.Sugimoto K, Moriyasu F, Kamiyama N, Metoki R, Iijima H. Parametric imaging of contrast ultrasound for the evaluation of neovascularization in liver tumors. Hepatol Res 2007;37:464–472 [DOI] [PubMed] [Google Scholar]
- 22.Du J, Thornton FJ, Mistretta CA, Grist TM. Dynamic MR venography: an intrinsic benefit of time-resolved MR angiography. J Magn Reson Imaging 2006;24:922–927 [DOI] [PubMed] [Google Scholar]
- 23.Mostardi PM, Haider CR, Rossman PJ, Borisch EA, Riederer SJ. Controlled experimental study depicting moving objects in view-shared time-resolved MRA. Magn Reson Med 2009;62:85–95 [DOI] [PMC free article] [PubMed] [Google Scholar]
- 24.Johnson CP, Haider CR, Rossman PJ, Hulshizer TC, Borisch EA, Riederer SJ. Coil design for highly accelerated 2D SENSE MRA of the lower legs [abstr]. In: Proceedings of the 16th Meeting of the International Society for Magnetic Resonance in Medicine. Berkeley, Calif: International Society for Magnetic Resonance in Medicine, 2008;1079 [Google Scholar]
- 25.Madhuranthakam AJ, Hu HH, Barger AV, et al. Undersampled elliptical centric view-order for improved spatial resolution in contrast-enhanced MR angiography. Magn Reson Med 2006;55:50–58 [DOI] [PubMed] [Google Scholar]
- 26.van Vaals JJ, Brummer ME, Dixon WT, et al. “Keyhole”method for accelerating imaging of contrast agent uptake. J Magn Reson Imaging 1993;3:671–675 [DOI] [PubMed] [Google Scholar]
- 27.Lim RP, Shapiro M, Wang EY, et al. 3D time-resolved MR angiography (MRA) of the carotid arteries with time-resolved imaging with stochastic trajectories: comparison with 3D contrast-enhanced bolus-chase MRA and 3D time-of-flight MRA. AJNR Am J Neuroradiol 2008;29:1847–1854 [DOI] [PMC free article] [PubMed] [Google Scholar]
- 28.Mistretta CA, Wieben O, Velikina J, Block W, Perry J, Wu Y. Highly constrained backprojection for time-resolved MRI. Magn Reson Med 2006;55:30–40 [DOI] [PMC free article] [PubMed] [Google Scholar]
- 29.Haider CR, Campeau NG, Glockner JF, Huston J, 3rd, Riederer SJ. Highly accelerated (>10×) parallel acquisition for 3D time-resolved CE-MRA of the calves [abstr]. In: Proceedings of the 16th Meeting of the International Society for Magnetic Resonance in Medicine. Berkeley, Calif: International Society for Magnetic Resonance in Medicine, 2008; 105 [Google Scholar]
- 30.Riederer SJ, Hu HH, Kruger DG, Haider CR, Campeau NG, Huston J., 3rd Intrinsic signal amplification in the application of 2D SENSE parallel imaging to 3D contrast-enhanced elliptical centric MRA and MRV. Magn Reson Med 2007;58:855–864 [DOI] [PMC free article] [PubMed] [Google Scholar]
- 31.Grist TM, Korosec FR, Peters DC, et al. Steady-state and dynamic MR angiography with MS-325: initial experience in humans. Radiology 1998;207:539–544 [DOI] [PubMed] [Google Scholar]
- 32.Prince MR, Chabra SG, Watts R, et al. Contrast material travel times in patients undergoing peripheral MR angiography. Radiology 2002;224:55–61 [DOI] [PubMed] [Google Scholar]
- 33.Winterer JT, Scheffler K, Paul G, et al. Optimization of contrast-enhanced MR angiography of the hands with a timing bolus and elliptically reordered 3D pulse sequence. J Comput Assist Tomogr 2000;24:903–908 [DOI] [PubMed] [Google Scholar]
Associated Data
This section collects any data citations, data availability statements, or supplementary materials included in this article.


