MR imaging findings may represent additional useful variables for predicting the disease extent in patients with clinically localized prostate cancer.
Abstract
Purpose:
To assess the diagnostic accuracy of endorectal magnetic resonance (MR) imaging and MR spectroscopic imaging for prediction of the pathologic stage of prostate cancer and the presence of clinically nonimportant disease in patients with clinical stage T1c prostate cancer.
Materials and Methods:
The institutional review board approved—and waived the informed patient consent requirement for—this HIPAA-compliant study involving 158 patients (median age, 58 years; age range, 40–76 years) who had clinical stage T1c prostate cancer, had not been treated preoperatively, and underwent combined 1.5-T endorectal MR imaging–MR spectroscopic imaging between January 2003 and March 2004 before undergoing radical prostatectomy. On the MR images and combined endorectal MR–MR spectroscopic images, two radiologists retrospectively and independently rated the likelihood of cancer in 12 prostate regions and the likelihoods of extracapsular extension (ECE), seminal vesicle invasion (SVI), and adjacent organ invasion by using a five-point scale, and they determined the probability of clinically nonimportant prostate cancer by using a four-point scale. Whole-mount step-section pathology maps were used for imaging–pathologic analysis correlation. Receiver operating characteristic curves were constructed and areas under the curves (AUCs) were estimated nonparametrically for assessment of reader accuracy.
Results:
At surgical-pathologic analysis, one (0.6%) patient had no cancer; 124 (78%) patients, organ-confined (stage pT2) disease; 29 (18%) patients, ECE (stage pT3a); two (1%) patients, SVI (stage pT3b); and two (1%) patients, bladder neck invasion (stage pT4). Forty-six (29%) patients had a total tumor volume of less than 0.5 cm3. With combined MR imaging–MR spectroscopic imaging, the two readers achieved 80% accuracy in disease staging and AUCs of 0.62 and 0.71 for the prediction of clinically nonimportant cancer.
Conclusion:
Clinical stage T1c prostate cancers are heterogeneous in pathologic stage and volume. MR imaging may help to stratify patients with clinical stage T1c disease for appropriate clinical management.
© RSNA, 2009
Introduction
In American men, prostate cancer continues to be the most common cancer and the second leading cause of noncutaneous cancer-related mortality (1). The American Cancer Society estimated that in 2009, 192 280 new cases of prostate cancer would be diagnosed and 27 360 deaths would occur owing to this disease in the United States (1). Serum prostate-specific antigen (PSA) screening has led to a dramatic decrease in prostate cancer stage at the time of diagnosis, and stage T1c is now the most commonly diagnosed clinical stage (2).
According to the TNM classification system, T1c prostate cancers are malignancies identified with needle biopsy (performed, for example, because of an elevated PSA level) that are not detectable at digital rectal examination or imaging (usually transrectal ultrasonography [US]) (3). In a study conducted by Humphrey et al (4), 78 of 100 consecutive patients who underwent radical prostatectomy for cancer detected with PSA screening had clinical stage T1c disease.
Patients with clinical stage T1c disease who are treated with radical prostatectomy may harbor either clinically nonimportant cancer or cancer that is substantial in size, grade, and extent at surgical-pathologic analysis (4–6). For example, in a case series of 157 consecutive men who underwent radical prostatectomy for clinical stage T1c prostate cancer, 26% of tumors were considered “insignificant” or “minimal” (no larger than 0.5 cm3, confined to the prostate, and Gleason score lower than 7), 37% were moderate (Gleason score lower than 7 and either larger than 0.5 cm3 or with capsular penetration), and 37% were advanced (capsular penetration, Gleason score higher than or equal to 7 or positive margins, or tumor involvement of seminal vesicles or lymph nodes) (5).
The effectiveness of the various treatment options for prostate cancer depends on the extent of disease. It has been reported that at 10 years after radical prostatectomy, the progression-free probability is 92.2% for patients with cancer confined to the prostate, 71.4% for patients with extracapsular extension only, and 37.4% for patients with seminal vesicle invasion (7). Therefore, to select the appropriate treatment option, accurate staging is required. Currently, the recommended preoperative staging approach involves the use of a number of clinical variables, including serum PSA level, digital rectal examination findings, and transrectal US–guided biopsy results. However, owing to the reductions in prostate cancer volume and stage that have resulted from PSA screening (2,8–10), these variables have become less useful for stratifying patients. For example, the correlation between PSA level and prostate cancer volume has decreased from 0.7 to 0.1 during the past 15 years (11).
The role of endorectal MR imaging in patients deemed to have clinical stage T1c disease has been investigated previously (12). However, to our knowledge, in no recent studies have investigators applied state-of-the-art MR spectroscopic imaging and MR imaging in the evaluation of both cancer stage and tumor extent in patients with clinical stage T1c prostate cancer. We, therefore, conducted this study to assess the diagnostic accuracy of endorectal MR imaging and combined endorectal MR imaging–MR spectroscopic imaging in the preoperative prediction of the pathologic stage and the presence of clinically nonimportant disease in patients with clinical stage T1c prostate cancers.
Materials and Methods
Patient Selection
Our institutional review board waived the requirement for informed consent to review the patients’ data in this retrospective study, which was compliant with Health Insurance Portability and Accountability Act guidelines. To be included in the study, patients had to have (a) undergone 1.5-T endorectal MR imaging combined with proton MR spectroscopic imaging before undergoing radical prostatectomy for prostate cancer between January 2003 and March 2004, (b) received a diagnosis of clinical stage T1c prostate cancer, and (c) had whole-mount step-section pathology maps available for imaging–pathologic analysis correlation. Patients who had undergone any neoadjuvant hormonal therapy, neoadjuvant chemotherapy, or radiation treatment of the pelvis were excluded from our study.
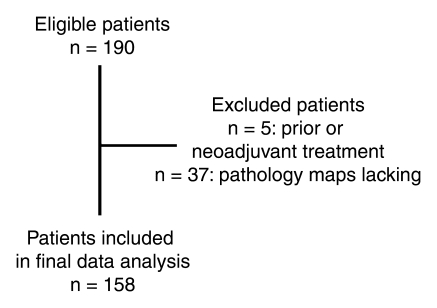
Through computerized searches of urology department and radiology department databases, 163 consecutive patients who met the study inclusion criteria were identified. Five patients were excluded because they had received prior or neoadjuvant treatment. Thus, our study included a total of 158 patients (median age, 58 years; age range, 40–76 years) (Fig 1). Only those patients who underwent imaging between January 2003 and March 2004 were selected because when our study was designed, there was a considerable time lag between the completion of surgery and the creation of pathology maps at our institution. Although our production of pathology maps has since become more efficient, our consent waiver applied to only those patients imaged until March 2004. For 59 patients, imaging was performed as part of a National Institutes of Health (NIH)–funded study (R01 CA76423) to investigate the use of MR imaging in patients with prostate cancer. All of these patients gave informed consent before enrolling in the NIH-funded study, which was Health Insurance Portability and Accountability Act compliant.
Figure 1:
Flowchart outlines the selection of patients for the study.
The patients’ clinical data, including biopsy and surgical-pathologic findings, were tabulated. Many patients were referred from outside our institution and thus had undergone biopsy elsewhere. Although representative biopsy samples from these patients were reviewed by our pathology department staff, the number of positive core-needle biopsy specimens was not always available.
Endorectal MR Imaging and MR Spectroscopic Imaging
Combined endorectal MR imaging–MR spectroscopic imaging was performed by using a 1.5-T whole-body MR unit (Signa; GE Medical Systems, Milwaukee, Wis) with a standardized protocol. Patients were examined in the supine position with use of a body coil for excitation and a phased-array pelvic coil (GE Medical Systems) combined with a commercially available balloon-covered expandable endorectal coil (Medrad, Pittsburgh, Pa) for signal reception. T1-weighted transverse spin-echo images were obtained from the aortic bifurcation to the symphysis pubis by using the following parameters: 700/8 (repetition time msec/echo time msec), 5-mm section thickness, 1-mm intersection gap, 24-cm field of view, 256 × 192 matrix, and one acquired signal. Thin-section high-spatial-resolution transverse, coronal, and sagittal T2-weighted fast spin-echo images of the prostate and seminal vesicles were obtained by using the following parameters: 4000–5060/96–108 (repetition time msec/effective echo time msec), echo train length of 10–16, 3-mm section thickness, no intersection gap, 14–20-cm field of view, (256–320) × 192 matrix, and three acquired signals.
The transverse T2-weighted images were used for MR spectroscopic imaging volume selection, which was performed by using the point-resolved spatial selection localization technique (13,14) and yielded an in-plane spatial resolution of 6.9 mm. The point-resolved spatial selection box was positioned to maximize coverage of the prostate while minimizing the inclusion of periprostatic fat. Water and lipid suppression within the point-resolved spatial selection volume was achieved by using the spectral or spatial pulses (15,16), and selective outer-voxel suppression pulses were used to reduce contamination from surrounding tissues (17). The MR spectroscopic imaging data were processed by using the Functool package with the GE Advantage workstation (GE Medical Systems), which enables one to align the spectral data with the MR images and archive arrays of spectral data with the corresponding images in Digital Imaging and Communications in Medicine format. The choline plus creatine–citrate ratios for all voxels were calculated. Choline and creatine integration ranges may contain polyamines because the polyamine peak resides between them and cannot be completely separated. Therefore, the choline plus creatine–citrate ratio may be interpreted as the choline plus polyamine plus creatine–citrate ratio, as has been described previously (18). All endorectal MR imaging–MR spectroscopic imaging data were downloaded to the departmental picture archiving and communication system (Centricity RA 1000; GE Medical Systems).
MR Imaging and MR Spectroscopic Imaging Data Analysis
MR images were retrospectively analyzed independently by two radiologists (O.A., J.Z.), each of whom had 5 years experience interpreting endorectal MR images of the prostate. They were unaware of all clinical and surgical-pathologic findings except the fact that all patients were considered to have clinical stage T1c prostate cancer. First, each radiologist evaluated the conventional endorectal MR images for the presence of tumor in 12 areas of the prostate gland: the peripheral zone divided into six sextants and the transition zone divided into six sextants. The central zone was grouped with the transition zone for image analysis. Scores for the probability of prostate cancer being present in each sextant of each zone and for the probabilities of extracapsular extension, seminal vesicle invasion, and adjacent organ invasion being present were assigned by using a scale of 1–5, with 1 meaning definitely absent; 2, probably absent; 3, possibly present; 4, probably present; and 5, definitely present. At data analysis, a score of 4 or 5 was considered to indicate a positive finding.
The MR spectroscopic imaging data were analyzed by a spectroscopist (A.S.) with more than 5 years experience reading prostate MR spectroscopic images. The spectroscopist was blinded to all clinical and surgical-pathologic findings except the fact that all patients were considered to have clinical stage T1c prostate cancer. Voxels in the peripheral (14,15,18,19) and transition (20) zones of the prostate gland were judged to be suspicious on the basis of established metabolic criteria, without reference to the MR findings. Subsequently, the radiologists reviewed the MR spectroscopic imaging results and, with knowledge of the MR imaging scores, assigned new scores for the presence of tumor, extracapsular extension, seminal vesicle invasion, and adjacent organ invasion on the basis of combined endorectal MR imaging–MR spectroscopic imaging data and by using the same five-point scale. Again, for the purposes of data analysis, a score of 4 or 5 was considered to indicate a positive finding.
Finally, each reader assigned a score of 1–4 for his or her overall impression of the clinical importance of the tumor: Clinically nonimportant prostate cancer was defined as pathologically organ-confined cancer with a total volume of 0.5 cm3 or less and no poorly differentiated components at histologic analysis (21). The scale of 1–4 (1 = definitely clinically nonimportant, 2 = probably clinically nonimportant, 3 = indeterminate, 4 = definitely clinically important) was based on a previously described scale of 0–3 that was used to score the probability of clinically nonimportant prostate cancer with MR imaging alone or combined MR imaging–MR spectroscopic imaging (21). At data analysis, a score of 1 or 2 was considered to indicate a finding positive for clinically nonimportant prostate cancer.
Pathologic Correlation
Whole-mount sections of the prostate were prepared as previously described (22). Prostate tumors were identified and precisely mapped in each section. The overall Gleason score was recorded as the score assigned to the portion of the tumor with the highest Gleason score. Approximately 3 months after the readers finished evaluating all of the MR examination data, three investigators (O.A., A.S., J.Z.) met to review all of the pathology maps in consensus. The three investigators were aware that all patients were considered to have clinical stage T1c prostate cancer but were blinded to all other clinical information and previous MR image readings. Again, the prostate was divided into the peripheral zone and the transition zone, and each zone was further divided into sextants. The presence of cancer in each sextant of each zone was recorded. Information about the pathologic stage (ie, presence of extracapsular extension, seminal vesicle invasion, and/or adjacent organ invasion) was extracted from the original pathology reports. Another investigator (L.J.C.), a research assistant who had 1 year of experience performing volumetric studies, subsequently measured the cross-sectional area of each tumor region outlined on the digital maps by using Image-Pro software (Media Cybernetics, Silver Spring, MD). The sum of all tumor areas and the total tumor volume in each patient were then calculated.
Statistical Analyses
We summarized the patient data by tabulating median values and ranges for continuous variables and tabulating percentages for categorical variables. To test for differences in the distributions of clinical variables based on pathologic stage and tumor size, we used the Fisher exact test for categorical variables and the Mann-Whitney test for continuous variables. To descriptively summarize the accuracy of combined endorectal MR imaging–MR spectroscopic imaging in disease staging, we tabulated the distribution of stages determined with combined endorectal MR imaging–MR spectroscopic imaging according to the true pathologic stages and calculated the percentages of patients with correctly classified and misclassified stages. To determine the readers’ accuracy in staging and diagnosing clinically nonimportant cancer in the prostate with use of MR imaging and combined endorectal MR imaging–MR spectroscopic imaging, we nonparametrically constructed receiver operating characteristic curves and estimated the corresponding areas under the curves (AUCs). We compared AUCs by using the methods described by DeLong et al (23). Analyses were performed by using SAS 9.1 for Windows (SAS Institute, Cary, NC) or Stata 9.0 for Windows (Stata, College Station, Tex). Statistical significance was defined on the basis of a P value of less than .05.
Results
Patient Characteristics
Although all 158 patients included in this study had clinical stage T1c disease, at surgical-pathologic analysis, 124 (78%) patients had organ-confined disease (stage pT2), 29 (18%) had extracapsular extension (stage pT3a), two (1%) had seminal vesicle invasion (stage pT3b), and two (1%) had bladder neck invasion (stage pT4). In one (0.6%) patient, no cancer was found in the radical prostatectomy specimen, although the patient had biopsy-proved prostate adenocarcinoma. In 46 (29%) patients, the tumor volume was less than 0.5 cm3 (Table 1). No adverse events resulted from the combined endorectal MR imaging–MR spectroscopic imaging examinations.
Table 1.
Patient and Tumor Characteristics
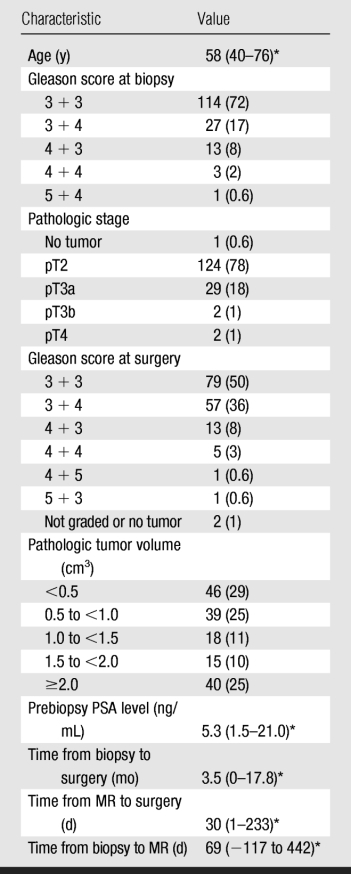
Note.—Unless otherwise noted, data are numbers of patients (n = 158), with percentages in parentheses.
* Median value, with range in parentheses.
Thirty (19%) of the patients in our study met the criteria to be considered for active surveillance as a management strategy: age 75 years or younger, clinical stage T1–T2a, Gleason score of 6 or lower at biopsy, PSA level of 10 ng/mL or lower, and three or fewer positive core-needle biopsy specimens at diagnostic biopsy (24). However, four (13%) of these 30 patients had extraprostatic extension of disease at surgical-pathologic analysis.
Staging Accuracy with Endorectal MR Imaging–MR Spectroscopic Imaging
The accuracy of the two readers in staging the prostate cancers, as stratified according to actual pathologic stage, with use of combined endorectal MR imaging–MR spectroscopic imaging is outlined in Table 2. Reader 1 correctly staged the cancers in 127 (80%) patients, and reader 2 correctly staged the cancers in 126 (80%) patients.
Table 2.
Reader Accuracy in Determining Disease Stage, as Stratified by Pathologic Stage, with Combined Endorectal MR Imaging–MR Spectroscopic Imaging
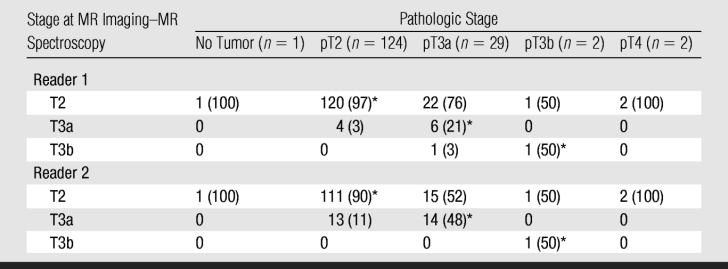
Note.—Data are numbers of patients (n = 158), with percentages in parentheses. In determining accuracy levels, an imaging score of 4 or higher was considered to indicate a positive finding.
* Cases in which disease was accurately staged by the given reader.
Tumor Volume and MR Staging Accuracy
The patients were further divided into four groups on the basis of their total pathologic tumor volumes: patients with very small (<0.5 cm3, n = 46 [29%]), small (0.5 to <1.0 cm3, n = 39 [25%]), intermediate (1.0 to <2.0 cm3, n = 33 [21%]), and large (≥2.0 cm3, n = 40 [25%]) volumes. The readers had the highest accuracy in staging the smallest tumor volumes. Both readers accurately staged the disease in 42 (91%) of the 46 patients with tumor volumes smaller than 0.5 cm3. Reader 1 accurately staged the disease in 32 (82%) of the 39 patients with small tumor volumes, and reader 2 accurately staged the disease in 31 (80%) of these patients. Both readers correctly staged the disease in 23 (70%) of the 33 patients with intermediate tumor volumes and in 30 (75%) of the 40 patients with large tumor volumes.
Detection of Extraprostatic Disease
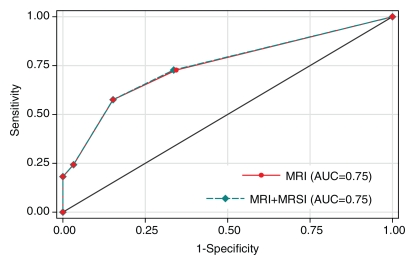
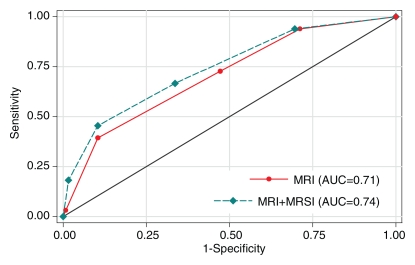
A total of 33 (21%) patients had cancer of pathologic stage T3a (pT3a) or higher. In the detection of extraprostatic disease, reader 1 had an AUC of 0.75 (95% confidence interval [CI]: 0.65, 0.85) with use of either MR imaging alone or combined endorectal MR imaging–MR spectroscopic imaging, and reader 2 had an AUC of 0.71 (95% CI: 0.61, 0.80) with use of MR imaging alone and 0.74 (95% CI: 0.65, 0.84) with use of combined endorectal MR imaging–MR spectroscopic imaging (Fig 2). The addition of MR spectroscopic imaging led to improved staging accuracy for reader 2, but the difference was not significant (P > .05). Examples of unexpected extraprostatic disease are shown in Figures 3 and 4.
Figure 2a:
Graphs illustrate accuracy in diagnosing prostate cancer of stage T3a or higher with MR imaging or combined endorectal MR imaging–MR spectroscopic imaging (MRSI) in patients with clinical stage T1c disease. (a) Reader 1 had an AUC of 0.75 (95% CI: 0.65, 0.85) at endorectal MR imaging, with or without MR spectroscopic imaging. (b) Reader 2 had an AUC of 0.71 (95% CI: 0.61, 0.80) with use of MR imaging alone and 0.74 (95% CI: 0.65, 0.84) with use of combined MR imaging–MR spectroscopic imaging.
Figure 2b:
Graphs illustrate accuracy in diagnosing prostate cancer of stage T3a or higher with MR imaging or combined endorectal MR imaging–MR spectroscopic imaging (MRSI) in patients with clinical stage T1c disease. (a) Reader 1 had an AUC of 0.75 (95% CI: 0.65, 0.85) at endorectal MR imaging, with or without MR spectroscopic imaging. (b) Reader 2 had an AUC of 0.71 (95% CI: 0.61, 0.80) with use of MR imaging alone and 0.74 (95% CI: 0.65, 0.84) with use of combined MR imaging–MR spectroscopic imaging.
Figure 3a:
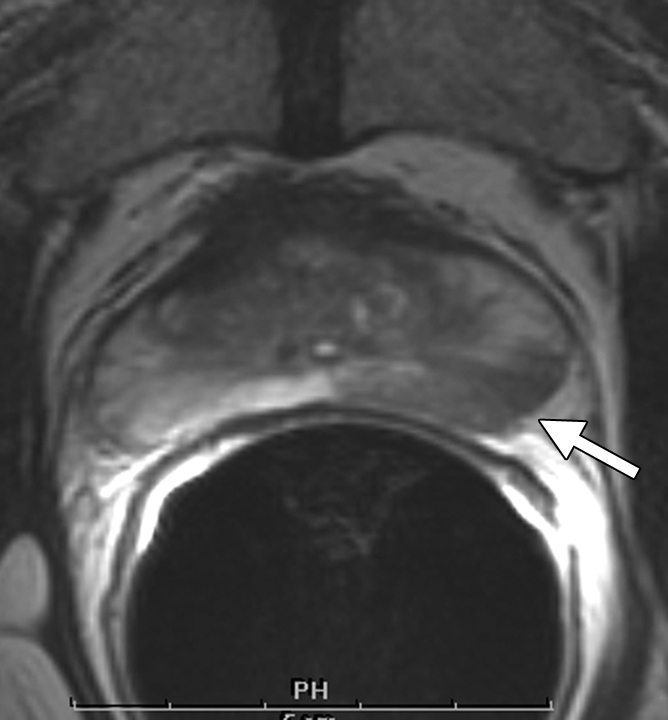
Clinical stage T1c prostate cancer in 52-year-old man. (a) Transverse T2-weighted endorectal MR image (4000/103, echo train length of 16, three acquired signals, 14-cm field of view, 256 × 192 matrix, 3-mm section thickness, no intersection gap) of prostate shows large area of abnormal signal intensity in left posterior peripheral zone. Mild capsular irregularity (arrow) is also present. These findings raise suspicion for prostate cancer with extracapsular extension. (b) MR spectroscopic grid overlaid on image in a. Asterisks indicate suspicious voxels in left posterior peripheral zone. MR spectroscopic imaging parameters are as follows: 1000/130, volume excitation with water and lipid suppression by means of spectral or spatial pulses, chemical shift imaging matrix of 16 × 8 × 8, 110 × 55 × 55-mm field of view, 6.9-mm spatial resolution, one acquired signal, and imaging time of 17 minutes. (c) Whole-mount step-section histopathologic specimen shows tumor (outlined in blue) with focal extracapsular extension (indicated by red dots) in left region. (Hematoxylin and eosin stain; original magnification, ×1.)
Figure 3b:
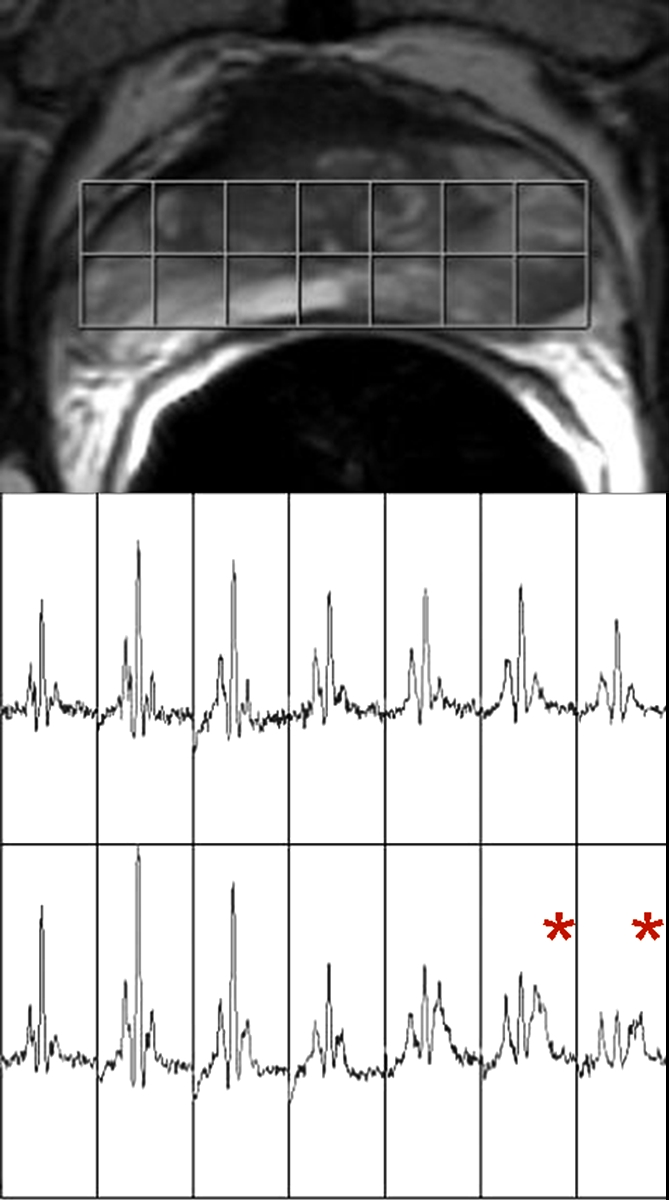
Clinical stage T1c prostate cancer in 52-year-old man. (a) Transverse T2-weighted endorectal MR image (4000/103, echo train length of 16, three acquired signals, 14-cm field of view, 256 × 192 matrix, 3-mm section thickness, no intersection gap) of prostate shows large area of abnormal signal intensity in left posterior peripheral zone. Mild capsular irregularity (arrow) is also present. These findings raise suspicion for prostate cancer with extracapsular extension. (b) MR spectroscopic grid overlaid on image in a. Asterisks indicate suspicious voxels in left posterior peripheral zone. MR spectroscopic imaging parameters are as follows: 1000/130, volume excitation with water and lipid suppression by means of spectral or spatial pulses, chemical shift imaging matrix of 16 × 8 × 8, 110 × 55 × 55-mm field of view, 6.9-mm spatial resolution, one acquired signal, and imaging time of 17 minutes. (c) Whole-mount step-section histopathologic specimen shows tumor (outlined in blue) with focal extracapsular extension (indicated by red dots) in left region. (Hematoxylin and eosin stain; original magnification, ×1.)
Figure 3c:
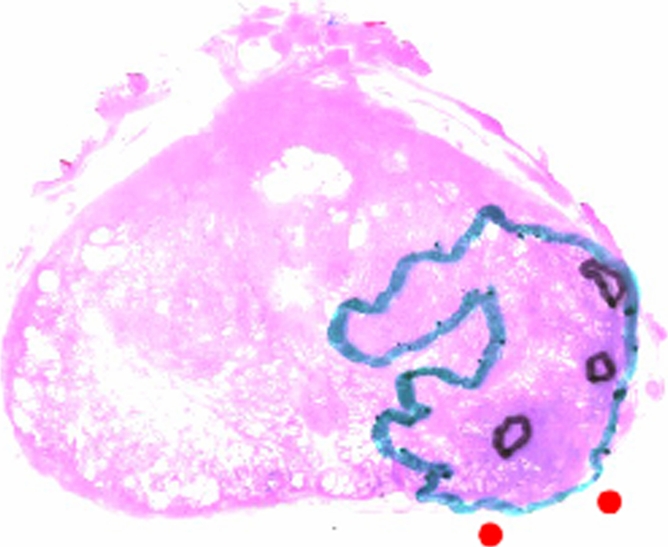
Clinical stage T1c prostate cancer in 52-year-old man. (a) Transverse T2-weighted endorectal MR image (4000/103, echo train length of 16, three acquired signals, 14-cm field of view, 256 × 192 matrix, 3-mm section thickness, no intersection gap) of prostate shows large area of abnormal signal intensity in left posterior peripheral zone. Mild capsular irregularity (arrow) is also present. These findings raise suspicion for prostate cancer with extracapsular extension. (b) MR spectroscopic grid overlaid on image in a. Asterisks indicate suspicious voxels in left posterior peripheral zone. MR spectroscopic imaging parameters are as follows: 1000/130, volume excitation with water and lipid suppression by means of spectral or spatial pulses, chemical shift imaging matrix of 16 × 8 × 8, 110 × 55 × 55-mm field of view, 6.9-mm spatial resolution, one acquired signal, and imaging time of 17 minutes. (c) Whole-mount step-section histopathologic specimen shows tumor (outlined in blue) with focal extracapsular extension (indicated by red dots) in left region. (Hematoxylin and eosin stain; original magnification, ×1.)
Figure 4a:
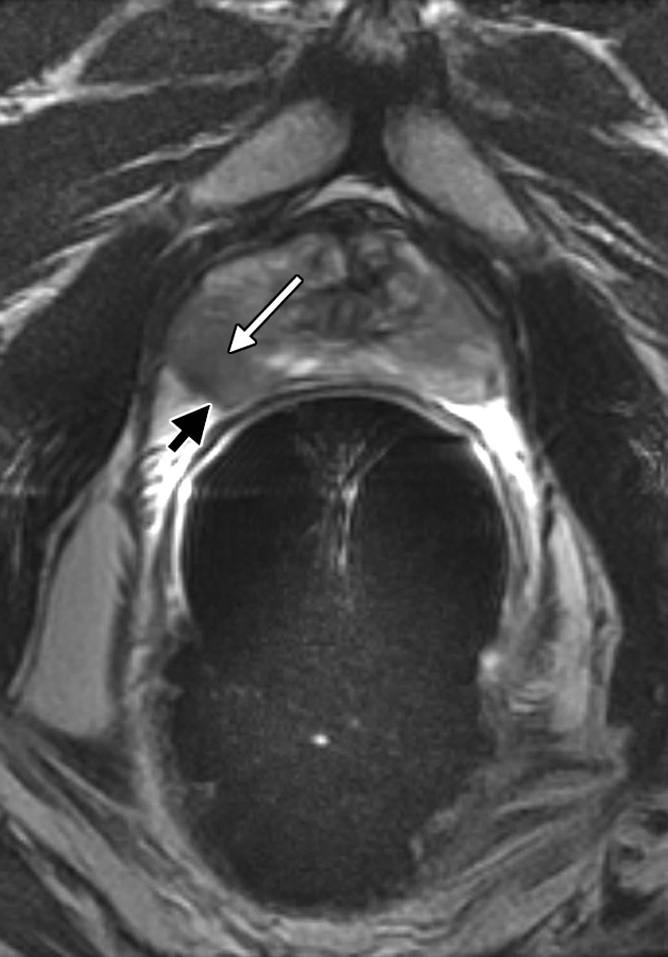
Clinical stage T1c prostate cancer in 60-year-old man. (a) Transverse T2-weighted endorectal MR image (4016/105, echo train length of 10, three acquired signals, 14-cm field of view, 256 × 192 matrix, 3-mm section thickness, no intersection gap) of prostate shows focal low-signal-intensity tumor (white arrow) in peripheral zone in right middle portion of prostate gland. The tumor is associated with capsular bulging, which is consistent with extracapsular extension (black arrow), which was later confirmed at surgical-pathologic analysis. (b) MR spectroscopic grid overlaid on image in a. Asterisks indicate suspicious voxels (elevated choline level and undetectable or reduced citrate level) in right posterior peripheral zone. MR spectroscopic imaging parameters are the same as those for Figure 3.
Figure 4b:
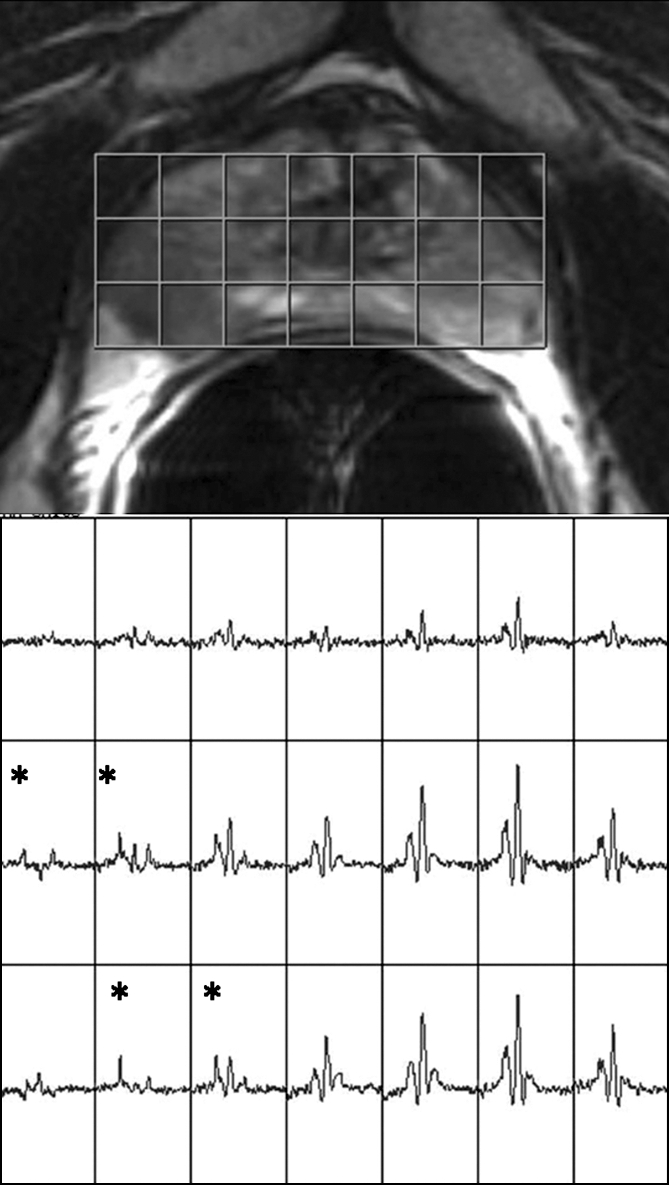
Clinical stage T1c prostate cancer in 60-year-old man. (a) Transverse T2-weighted endorectal MR image (4016/105, echo train length of 10, three acquired signals, 14-cm field of view, 256 × 192 matrix, 3-mm section thickness, no intersection gap) of prostate shows focal low-signal-intensity tumor (white arrow) in peripheral zone in right middle portion of prostate gland. The tumor is associated with capsular bulging, which is consistent with extracapsular extension (black arrow), which was later confirmed at surgical-pathologic analysis. (b) MR spectroscopic grid overlaid on image in a. Asterisks indicate suspicious voxels (elevated choline level and undetectable or reduced citrate level) in right posterior peripheral zone. MR spectroscopic imaging parameters are the same as those for Figure 3.
Prediction of Clinically Nonimportant Cancer
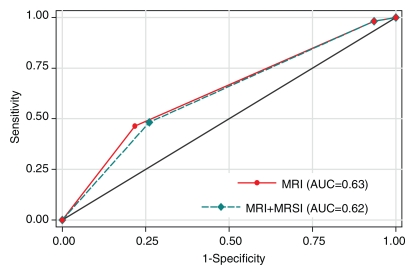
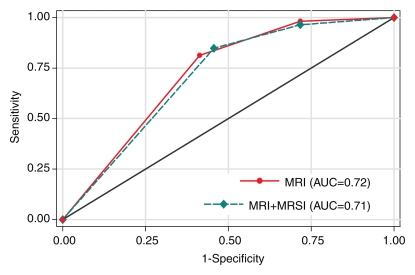
In the prediction of clinically nonimportant prostate cancer with MR imaging alone and combined MR imaging–MR spectroscopic imaging, reader 1 had AUCs of 0.63 (95% CI: 0.55, 0.71) and 0.62 (95% CI: 0.54, 0.70), respectively, while reader 2 had AUCs of 0.72 (95% CI: 0.64, 0.80) and 0.71 (95% CI: 0.63, 0.79), respectively. The difference in accuracy between endorectal MR imaging alone and endorectal MR imaging combined with MR spectroscopic imaging was not significant for either reader (Fig 5).
Figure 5a:
Graphs illustrate accuracy in diagnosing clinically nonimportant prostate cancer with endorectal MR imaging or combined endorectal MR imaging–MR spectroscopic imaging (MRSI) in patients with clinical stage T1c disease. (a) Reader 1 had an AUC of 0.63 (95% CI: 0.55, 0.71) with use of MR imaging alone and 0.62 (95% CI: 0.54, 0.70) with use of combined MR imaging–MR spectroscopic imaging. (b) Reader 2 had an AUC of 0.72 (95% CI: 0.64, 0.80) with use of MR imaging alone and 0.71 (95% CI: 0.63, 0.79) with use of combined MR imaging–MR spectroscopic imaging.
Figure 5b:
Graphs illustrate accuracy in diagnosing clinically nonimportant prostate cancer with endorectal MR imaging or combined endorectal MR imaging–MR spectroscopic imaging (MRSI) in patients with clinical stage T1c disease. (a) Reader 1 had an AUC of 0.63 (95% CI: 0.55, 0.71) with use of MR imaging alone and 0.62 (95% CI: 0.54, 0.70) with use of combined MR imaging–MR spectroscopic imaging. (b) Reader 2 had an AUC of 0.72 (95% CI: 0.64, 0.80) with use of MR imaging alone and 0.71 (95% CI: 0.63, 0.79) with use of combined MR imaging–MR spectroscopic imaging.
Cancer Detection Based on Location in the Prostate
Pathologic analysis results showed that all 158 patients had cancer in the peripheral zone. Sixty-two (39%) patients had peripheral zone cancer at the prostate base, 147 (93%) had peripheral zone cancer in the middle portion of the gland, and 131 (83%) had peripheral zone cancer at the apex. Thirty-eight (24%) patients had tumor in the transition zone at pathologic analysis (Fig 6). Nine (6%) patients had transition zone cancer at the base of the gland, 32 (20%) had transition zone cancer in the middle portion, and 17 (11%) had transition zone cancer at the apex. In most locations, reader accuracy was slightly improved with use of combined endorectal MR imaging–MR spectroscopic imaging compared with the accuracy achieved with MR imaging alone, although the differences were not significant (Table 3). Cancer detection accuracy did not differ significantly among the different regions of the prostate.
Figure 6:
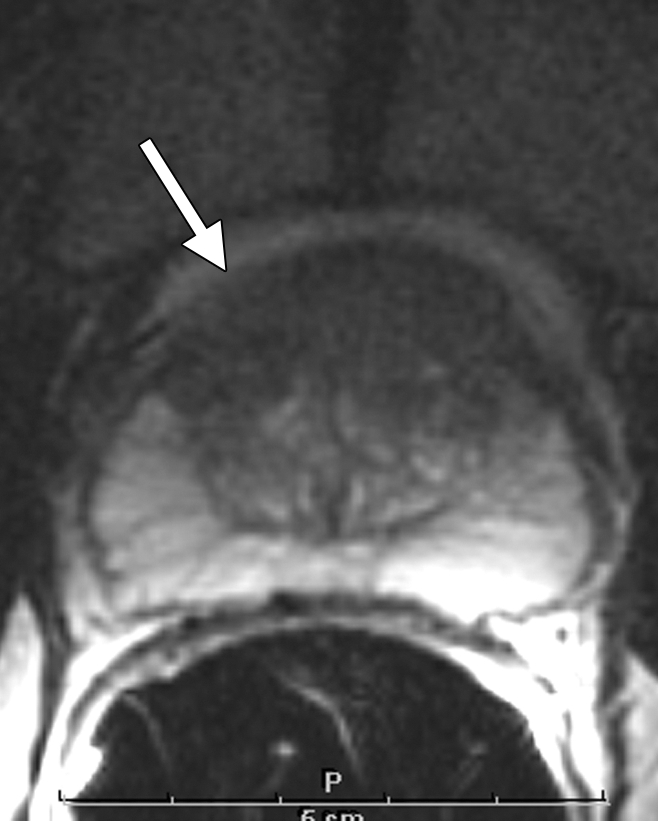
Clinical stage T1c prostate cancer in 65-year-old man. Transverse T2-weighted endorectal MR image (4850/100, echo train length of 12, three acquired signals, 14-cm field of view, 256 × 192 matrix, 3-mm section thickness, no intersection gap) of prostate shows homogeneous lenticular area of abnormal signal intensity (arrow) in the transition zone, which is consistent with tumor. The bulging of the prostatic contour indicates anterior extracapsular extension. Surgical pathology results confirmed the presence of transition zone cancer and anterior extracapsular extension. In addition, an anterior positive surgical margin was present.
Table 3.
Cancer Detection Accuracy with Endorectal MR Imaging and Combined Endorectal MR Imaging–MR Spectroscopic Imaging in Different Regions and Zones

Note.—Data are AUCs for reader accuracy in the detection of cancer in different zones and regions of the prostate. MR alone refers to endorectal MR imaging. Combined MR refers to combined endorectal MR imaging–MR spectroscopic imaging. Numbers in parentheses are 95% CIs.
Cancer Stage and Clinical Variables
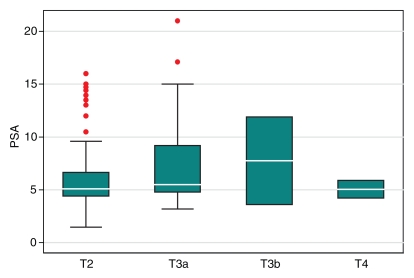
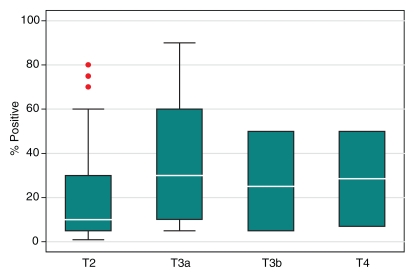
Compared with the patients who had stage pT3a cancer, the pT2 group had significantly lower prebiopsy PSA levels (P = .03), Gleason scores at biopsy (P < .001), and maximal percentages of tumor in positive core-needle biopsy specimens (P = .004) (Table 4). However, the ranges of these clinical variables overlapped substantially between these two patient groups (Fig 7). The number of patients with pT3b or pT4 disease was too small for statistical analysis.
Table 4.
Clinical Data Stratified by Pathologic Stage and Tumor Volume

* Data are numbers of patients (n = 158). Numbers in parentheses are percentages.
† Data are median values, with ranges in parentheses.
‡ Maximal percentages of tumor in positive core-needle biopsy specimens.
Figure 7a:
Graphs illustrate clinical variables, (a) prebiopsy PSA level and (b) maximal percentage of tumor in positive core-needle biopsy specimens, among patients with different pathologic stages of prostate cancer. White horizontal lines inside boxes indicate medians. Red dots indicate outlying values.
Figure 7b:
Graphs illustrate clinical variables, (a) prebiopsy PSA level and (b) maximal percentage of tumor in positive core-needle biopsy specimens, among patients with different pathologic stages of prostate cancer. White horizontal lines inside boxes indicate medians. Red dots indicate outlying values.
Tumor Volume and Clinical Variables
Compared with the tumors with volumes of less than 0.5 cm3, the larger tumors had significantly higher maximal percentages of tumor in the positive core-needle biopsy specimens (P = .001) and significantly higher Gleason scores at biopsy (P = .01), although the ranges of both these variables overlapped substantially. Prebiopsy PSA levels did not differ significantly between the tumors with volumes of less than 0.5 cm3 and the larger tumors (P > .05) (Table 4).
Discussion
With the routine practice of PSA screening, stage T1c has become the most commonly diagnosed clinical stage of prostate cancer. Patients with clinical stage T1c prostate cancer typically are considered to have localized early-stage disease of relatively low risk. Numerous treatment options are available for patients with clinically localized prostate cancer; these options include prostatectomy, external-beam radiation, brachytherapy, local ablative therapy, and deferred treatment. Clinical studies and decision analysis research have yielded conflicting results regarding the optimal management for early-stage prostate cancer. Some investigators have concluded that the potential benefits of therapy are offset by the risks for treatment-related morbidity and mortality in most cases (25), whereas others believe that all grades of clinically localized disease should be treated (26). Some investigators have determined that clinical variables should be used to stratify patients with early-stage prostate cancer for appropriate treatment management (27).
All of the patients in our study had received a diagnosis of clinical stage T1c prostate cancer. At surgical-pathologic analysis, however, approximately 20% of the patients had locally advanced disease, while almost 30% had very-small-volume, clinically nonimportant disease. These findings are consistent with findings in the literature (28). However, the proportion of patients with clinically nonimportant cancer in our study appeared to be higher than that in some earlier studies (4,29–32), perhaps because of the earlier detection of cancer at routine PSA screening. Furthermore, four (13%) of 30 patients whose clinical data met the criteria for active surveillance had extraprostatic extension of disease at surgical-pathologic analysis.
The development of a means to further stratify patients with a diagnosis of clinical stage T1c disease according to their risk of disease progression is essential to improving treatment selection. At present, there is no consensus as to what clinical variables should be used for this purpose. In our study, the distributions of some of the clinical variables differed significantly between the patients with clinically important cancers and those with clinically nonimportant cancers. However, the substantial overlap in the ranges of these variables would make it difficult to use these variables to predict pathologic tumor stage or volume in individual patients. Our study results show that MR imaging findings may represent additional useful variables for predicting disease extent in patients with clinically localized prostate cancer.
In our study, the overall accuracy of combined endorectal MR imaging–MR spectroscopic imaging in disease staging was 80% in patients with clinical stage T1c prostate cancer. This result suggests that as an addition to clinical data, combined endorectal MR imaging–MR spectroscopic imaging may yield useful diagnostic information in a substantial proportion of these patients. The addition of MR spectroscopic imaging to endorectal MR imaging improved one reader’s performance, although not significantly. This result may have been related to the experience levels of the two readers, which were roughly equivalent: Both readers had read more than 1000 prostate MR studies before taking part in this investigation. Previous study investigators have found that using MR spectroscopic imaging increases reader confidence and significantly improves reader performance in the interpretation of MR images—especially that of less experienced readers (33–35).
MR imaging is fairly accurate in the prediction of clinically nonimportant cancer in patients with clinically low-risk disease (21). The incorporation of other MR techniques, such as dynamic perfusion or diffusion-weighted imaging, can further improve the performance of MR examinations in the detection and staging of prostate cancer (36–39). It would be of clinical interest in the future to investigate whether multiparametric examinations in which all of these state-of-the-art techniques are combined can yield superior diagnostic information for stratifying patients with clinical stage T1c prostate cancer.
In our study, 38 (24%) patients had transition zone cancers, some of which were associated with locally advanced disease yet were clinically undetectable owing to their anterior location. In another study, 46% of patients with clinical stage T1c prostate cancer had transition zone cancer that was clinically undetectable because of its anterior location (29). Although in the past it has been considered difficult to diagnose transition zone cancer at MR imaging because the heterogeneous signal intensity in the transition zone is frequently associated with benign prostate hypertrophy, our study results confirm that MR imaging has similar accuracy in the diagnosis of transition zone and peripheral zone cancers, as reported in another relatively recent study (40).
Our study was limited in that the readers were aware that all of the patients had clinical stage T1c disease. Another limitation was the difficulty in correlating tumor location on MR images with tumor location on step-section pathology maps. We attempted to minimize this problem with consensus review of the tumor locations at step-section pathologic analysis. In addition, to ensure the feasibility of pathologic correlation, we included only those patients who had undergone surgery. We did not include patients who chose other types of treatment or deferred treatment. These limitations may have led to bias in our study.
In conclusion, clinical stage T1c prostate cancers are heterogeneous in pathologic stage and volume. Endorectal MR imaging can yield additional valuable diagnostic information about patients with these cancers. Future studies with larger patient populations and involving other state-of-the-art MR techniques, such as dynamic perfusion and diffusion-weighted examinations, may yield further insight into the potential role of MR imaging in stratifying patients with clinical stage T1c prostate cancer according to their risk of disease progression for individualized clinical management.
Advances in Knowledge.
Combined endorectal MR imaging–MR spectroscopic imaging had 80% accuracy in the staging of disease in patients with clinical stage T1c prostate cancer.
Endorectal MR imaging combined with MR spectroscopic imaging had moderate accuracy, 62%–72%, in the prediction of clinically nonimportant cancer in patients with clinical stage T1c disease.
Implication for Patient Care.
The pathologic stages and volumes of clinical stage T1c prostate cancers vary widely; endorectal MR imaging may have a role in the stratification of patients with clinical stage T1c disease for appropriate treatment management.
Acknowledgments
We thank Ada Muellner, BA, for editing this manuscript.
Received August 13, 2008; revision requested September 26; revision received March 11, 2009; accepted May 5; final version accepted May 26.
Funding: This research was supported by National Institutes of Health (grant R01 CA76423).
Authors stated no financial relationship to disclose.
Abbreviations:
- AUC
- area under receiver operating characteristic curve
- CI
- confidence interval
- PSA
- prostate-specific antigen
References
- 1.American Cancer Society Cancer facts and figures 2009 Atlanta, Ga: American Cancer Society, 2009 [Google Scholar]
- 2.Polascik TJ, Oesterling JE, Partin AW. Prostate specific antigen: a decade of discovery—what we have learned and where we are going. J Urol 1999;162:293–306 [DOI] [PubMed] [Google Scholar]
- 3.Schroder FH, Hermanek P, Denis L, Fair WR, Gospodarowicz MK, Pavone-Macaluso M. The TNM classification of prostate cancer. Prostate Suppl 1992;4:129–138 [DOI] [PubMed] [Google Scholar]
- 4.Humphrey PA, Keetch DW, Smith DS, Shepherd DL, Catalona WJ. Prospective characterization of pathological features of prostatic carcinomas detected via serum prostate specific antigen based screening. J Urol 1996;155:816–820 [PubMed] [Google Scholar]
- 5.Epstein JI, Walsh PC, Carmichael M, Brendler CB. Pathologic and clinical findings to predict tumor extent of nonpalpable (stage T1c) prostate cancer. JAMA 1994;271:368–374 [PubMed] [Google Scholar]
- 6.Carter HB, Sauvageot J, Walsh PC, Epstein JI. Prospective evaluation of men with stage T1C adenocarcinoma of the prostate. J Urol 1997;157:2206–2209 [PMC free article] [PubMed] [Google Scholar]
- 7.Hull GW, Rabbani F, Abbas F, Wheeler TM, Kattan MW, Scardino PT. Cancer control with radical prostatectomy alone in 1,000 consecutive patients. J Urol 2002;167:528–534 [DOI] [PubMed] [Google Scholar]
- 8.Boring CC, Squires TS, Tong T. Cancer statistics, 1993. CA Cancer J Clin 1993;43:7–26 [DOI] [PubMed] [Google Scholar]
- 9.Jemal A, Murray T, Samuels A, Ghafoor A, Ward E, Thun MJ. Cancer statistics, 2003. CA Cancer J Clin 2003;53:5–26 [DOI] [PubMed] [Google Scholar]
- 10.Jemal A, Murray T, Ward E, et al. Cancer statistics, 2005. CA Cancer J Clin 2005;55:10–30 [DOI] [PubMed] [Google Scholar]
- 11.Stamey TA, Caldwell M, McNeal JE, Nolley R, Hemenez M, Downs J. The prostate specific antigen era in the United States is over for prostate cancer: what happened in the last 20 years? J Urol 2004;172:1297–1301 [DOI] [PubMed] [Google Scholar]
- 12.Bernstein MR, Cangiano T, D’Amico A, et al. Endorectal coil magnetic resonance imaging and clinicopathologic findings in T1c adenocarcinoma of the prostate. Urol Oncol 2000;5:104–107 [DOI] [PubMed] [Google Scholar]
- 13.Bottomley P. Selective volume method for performing localized NMR spectroscopy. U.S. patent 4,480,228, October30, 1984
- 14.Kurhanewicz J, Vigneron DB, Hricak H, Narayan P, Carroll P, Nelson SJ. Three-dimensional H-1 MR spectroscopic imaging of the in situ human prostate with high (0.24–0.7-cm3) spatial resolution. Radiology 1996;198:795–805 [DOI] [PubMed] [Google Scholar]
- 15.Males RG, Vigneron DB, Star-Lack J, et al. Clinical application of BASING and spectral/spatial water and lipid suppression pulses for prostate cancer staging and localization by in vivo 3D 1H magnetic resonance spectroscopic imaging. Magn Reson Med 2000;43:17–22 [DOI] [PubMed] [Google Scholar]
- 16.Schricker AA, Pauly JM, Kurhanewicz J, Swanson MG, Vigneron DB. Dualband spectral-spatial RF pulses for prostate MR spectroscopic imaging. Magn Reson Med 2001;46:1079–1087 [DOI] [PubMed] [Google Scholar]
- 17.Tran TK, Vigneron DB, Sailasuta N, et al. Very selective suppression pulses for clinical MRSI studies of brain and prostate cancer. Magn Reson Med 2000;43:23–33 [DOI] [PubMed] [Google Scholar]
- 18.Pels P, Ozturk-Isik E, Swanson MG, et al. Quantification of prostate MRSI data by model-based time domain fitting and frequency domain analysis. NMR Biomed 2006;19:188–197 [DOI] [PubMed] [Google Scholar]
- 19.Zakian KL, Sircar K, Hricak H, et al. Correlation of proton MR spectroscopic imaging with Gleason score based on step-section pathologic analysis after radical prostatectomy. Radiology 2005;234:804–814 [DOI] [PubMed] [Google Scholar]
- 20.Zakian KL, Eberhardt S, Hricak H, et al. Transition zone prostate cancer: metabolic characteristics at 1H MR spectroscopic imaging—initial results. Radiology 2003;229:241–247 [DOI] [PubMed] [Google Scholar]
- 21.Shukla-Dave A, Hricak H, Kattan MW, et al. The utility of magnetic resonance imaging and spectroscopy for predicting insignificant prostate cancer: an initial analysis. BJU Int 2007;99:786–793 [DOI] [PubMed] [Google Scholar]
- 22.Cookson MS, Fleshner NE, Soloway SM, Fair WR. Correlation between Gleason score of needle biopsy and radical prostatectomy specimen: accuracy and clinical implications. J Urol 1997;157:559–562 [PubMed] [Google Scholar]
- 23.DeLong ER, DeLong DM, Clarke-Pearson DL. Comparing the areas under two or more correlated receiver operating curves: a nonparametric approach. Biometrics 1988;44:837–845 [PubMed] [Google Scholar]
- 24.Eggener SE, Mueller A, Berglund RK, et al. A multi-institutional evaluation of active surveillance for low risk prostate cancer. J Urol 2009;181:1635–1641 [DOI] [PMC free article] [PubMed] [Google Scholar]
- 25.Fleming C, Wasson JH, Albertsen PC, Barry MJ, Wennberg JE. A decision analysis of alternative treatment strategies for clinically localized prostate cancer: Prostate Patient Outcomes Research Team. JAMA 1993;269:2650–2658 [PubMed] [Google Scholar]
- 26.Beck JR, Kattan MW, Miles BJ. A critique of the decision analysis for clinically localized prostate cancer. J Urol 1994;152:1894–1899 [DOI] [PubMed] [Google Scholar]
- 27.Yoshimura N, Takami N, Ogawa O, et al. Decision analysis for treatment of early stage prostate cancer. Jpn J Cancer Res 1998;89:681–689 [DOI] [PMC free article] [PubMed] [Google Scholar]
- 28.Epstein JI, Chan DW, Sokoll LJ, et al. Nonpalpable stage T1c prostate cancer: prediction of insignificant disease using free/total prostate specific antigen levels and needle biopsy findings. J Urol 1998;160:2407–2411 [PubMed] [Google Scholar]
- 29.Elgamal AA, Van Poppel HP, Van de Voorde WM, Van Dorpe JA, Oyen RH, Baert LV. Impalpable invisible stage T1c prostate cancer: characteristics and clinical relevance in 100 radical prostatectomy specimens—a different view. J Urol 1997;157:244–250 [DOI] [PubMed] [Google Scholar]
- 30.Douglas TH, McLeod DG, Mostofi FK, et al. Prostate-specific antigen-detected prostate cancer (stage T1c): an analysis of whole-mount prostatectomy specimens. Prostate 1997;32:59–64 [DOI] [PubMed] [Google Scholar]
- 31.Goto Y, Ohori M, Arakawa A, Kattan MW, Wheeler TM, Scardino PT. Distinguishing clinically important from unimportant prostate cancers before treatment: value of systematic biopsies. J Urol 1996;156:1059–1063 [PubMed] [Google Scholar]
- 32.Lerner SE, Seay TM, Blute ML, Bergstralh EJ, Barrett D, Zincke H. Prostate specific antigen detected prostate cancer (clinical stage T1c): an interim analysis. J Urol 1996;155:821–826 [PubMed] [Google Scholar]
- 33.Scheidler J, Hricak H, Vigneron DB, et al. Prostate cancer: localization with three-dimensional proton MR spectroscopic imaging—clinicopathologic study. Radiology 1999;213:473–480 [DOI] [PubMed] [Google Scholar]
- 34.Wefer AE, Hricak H, Vigneron DB, et al. Sextant localization of prostate cancer: comparison of sextant biopsy, magnetic resonance imaging and magnetic resonance spectroscopic imaging with step section histology. J Urol 2000;164:400–404 [PubMed] [Google Scholar]
- 35.Yu KK, Scheidler J, Hricak H, et al. Prostate cancer: prediction of extracapsular extension with endorectal MR imaging and three-dimensional proton MR spectroscopic imaging. Radiology 1999;213:481–488 [DOI] [PubMed] [Google Scholar]
- 36.Bloch BN, Furman-Haran E, Helbich TH, et al. Prostate cancer: accurate determination of extracapsular extension with high-spatial-resolution dynamic contrast-enhanced and T2-weighted MR imaging—initial results. Radiology 2007;245:176–185 [DOI] [PubMed] [Google Scholar]
- 37.Fütterer JJ, Heijmink SW, Scheenen TW, et al. Prostate cancer localization with dynamic contrast-enhanced MR imaging and proton MR spectroscopic imaging. Radiology 2006;241:449–458 [DOI] [PubMed] [Google Scholar]
- 38.Kurhanewicz J, Vigneron D, Carroll P, Coakley F. Multiparametric magnetic resonance imaging in prostate cancer: present and future. Curr Opin Urol 2008;18:71–77 [DOI] [PMC free article] [PubMed] [Google Scholar]
- 39.Mazaheri Y, Shukla-Dave A, Hricak H, et al. Prostate cancer: identification with combined diffusion-weighted MR imaging and 3D 1H MR spectroscopic imaging—correlation with pathologic findings. Radiology 2008;246:480–488 [DOI] [PubMed] [Google Scholar]
- 40.Akin O, Sala E, Moskowitz CS, et al. Transition zone prostate cancers: features, detection, localization, and staging at endorectal MR imaging. Radiology 2006;239:784–792 [DOI] [PubMed] [Google Scholar]


