

Abstract
Given curiosity’s fundamental role in motivation, learning, and well-being, we sought to refine the measurement of trait curiosity with an improved version of the Curiosity and Exploration Inventory (CEI; Kashdan, Rose, & Fincham, 2004). A preliminary pool of 36 items was administered to 311 undergraduate students, who also completed measures of emotion, emotion regulation, personality, and well-being. Factor analyses indicated a two factor model—motivation to seek out knowledge and new experiences (Stretching; 5 items) and a willingness to embrace the novel, uncertain, and unpredictable nature of everyday life (Embracing; 5 items). In two additional samples (ns = 150 and 119), we cross-validated this factor structure and provided initial evidence for construct validity. This includes positive correlations with personal growth, openness to experience, autonomy, purpose in life, self-acceptance, psychological flexibility, positive affect, and positive social relations, among others. Applying item response theory (IRT) to these samples (n = 578), we showed that the items have good discrimination and a desirable breadth of difficulty. The item information functions and test information function were centered near zero, indicating that the scale assesses the mid-range of the latent curiosity trait most reliably. The findings thus far provide good evidence for the psychometric properties of the 10-item CEI-II.
Keywords: Curiosity, Positive Affect, Motivation, Flow, Well-Being
Curiosity is a powerful facet of human motivation (Berlyne, 1960, 1971; Izard, 1977) and one of the fundamental strengths and personality traits studied by psychologists (Peterson & Seligman, 2004; Reiss, 2000). Out of 24 fundamental strengths studied by psychologists, curiosity was the most commonly endorsed by 12,439 adults in the United States and 445 adults in Switzerland (Peterson, Ruch, Beermann, Park, & Seligman, 2007). Sylvan Tomkins (1962), a seminal researcher of positive emotions, believed curiosity had benefits of profound evolutionary significance: “The importance of curiosity to thought and memory are so extensive that the absence…would jeopardize intellectual development no less than the destruction of brain tissue…there is no human competence which can be achieved in the absence of a sustaining interest” (p. 347).
Despite being interesting to researchers since psychology became a discipline (Dewey, 1913; James, 1890), the study of curiosity has been plagued by inconsistent terminology, operational definitions, and measurement strategies. For instance, intrinsic motivation is often defined in ways that are identical to curiosity: “Perhaps no single phenomenon reflects the positive potential of human nature as much as intrinsic motivation, the inherent tendency to seek out novelty and challenges, to extend and exercise one’s capacities, to explore, and to learn” (Ryan & Deci, 2000, p. 70)
In a similar vein, the concept of flow, being fully immersed in an activity that is challenging, enjoyable, and requires the full deployment of one’s skills (Csiksentmihayli, 1990), has been described as an extreme variant of curiosity (Fredrickson, 1998). Other terms that are used interchangeably with curiosity include interest, novelty-seeking, and openness to experience, among others. Unfortunately, few scientists have connected these often isolated bodies of research. More precise definitions and terms can aid this endeavor.
As noted above, curiosity bears a resemblance to several other psychological constructs, all of which are concerned with the way people regulate and direct their attention in the presence of novel or valued environmental stimuli. Although these terms have been used somewhat interchangeably, this unfortunate tendency has obscured the fact that the essential qualities of curiosity connote a high degree of receptivity and willingness to engage with novel stimuli. Curiosity has overlapping attributes with intrinsic motivation, flow, and other variables, but the unique characteristics that have emerged across research projects inform the definition we propose. These include being interested in new things and possessing an open and receptive attitude toward whatever is the target of attention (Bishop et al., 2004). When people feel curious, they devote more attention to an activity, process information more deeply, remember information better, and are more likely to persist on tasks until goals are met (Silvia, 2006). The immediate function of curiosity is to learn, explore, and immerse oneself in the activity that initially stimulated the deployment of attentional resources (Loewenstein, 1994).
Implicit in this understanding of curiosity is that people must feel they have the ability to effectively cope with or make sense of the novelty, ambiguity and uncertainty being confronted during explorations (Berg & Sternberg, 1985; Silvia, 2008; Spielberger & Starr, 1994). This confidence might vary from situation to situation, but across situations, it seems likely to be expressed as the willingness to embrace the novel, uncertain, and unpredictable nature of everyday life. Part of this is about embracing, instead of fearing and avoiding, uncertainty. Across the lifespan, curiosity serves a broader function of building knowledge, skills, relationships, and expertise (Izard, 1977). After all, a person spending time with novel stimuli is exposed to some degree of information and experience that was not previously available. Thus, another feature of curiosity is the willingness, and perhaps desire, to continually accumulate new abilities and experiences. Curiosity captures people’s propensity to stretch their capabilities. We propose that curiosity be defined as recognizing, embracing, and seeking out knowledge and new experiences.
Research on the benefits of curiosity is only beginning to accumulate. Among other adaptive outcomes, curiosity is suspected to play a role in the development of intelligence, wisdom, happiness, meaning in life, distress tolerance, and satisfying and engaging social relationships (for reviews, see Kashdan, 2009; Renninger, Hidi, & Krapp, 1992; Silvia, 2006). Curiosity may also be relevant to the development of psychopathology because an intolerance of uncertainty has been demonstrated to be an important risk factor for anxiety disorders (Dugas, Freeston, & Ladouceur, 1997).
Measuring Trait Curiosity
Studying trait-like curiosity requires trustworthy tools for measuring curiosity, but the history of curiosity assessment is checkered at best (Boyle, 1983; Litman & Silvia, 2006; Silvia, 2006, chap. 4). Broadly speaking, measures of trait curiosity use either general self-report statements (e.g., “I am curious about things”; Naylor, 1981) or lists of specific activities (e.g., “Finding out how a carburetor on a car works”; Pearson, 1970; “Walking into an old deserted house at midnight”; Ainley, 1987, 1998). Activity-based scales are likely confounded by high item-specific error. For example, items about wanting to touch new kinds of fabric or to watch films about otters carry a lot of curiosity-irrelevant baggage. Moreover, it seems difficult to representatively sample activities from the universe of possible activities that people could do.
One recently developed scale to measure curiosity is the 7-item, two-dimensional Curiosity and Exploration Inventory (CEI; Kashdan, Rose, & Fincham, 2004). The first subscale, exploration (4 items), reflects an orientation toward seeking novel and challenging objects, events, and ideas with the aim of integrating these experiences and information. As such, exploration serves as a prerequisite to personal growth. The second subscale, absorption (3 items), reflects the ability to self-regulate attention to allow for immersion in these novel and challenging activities. With the aim of creating a general use scale that could be modified as needed for particular domains of interest, specific activities and topics were not given undue weight over others. Previous studies indicated that the CEI was relatively unaffected by the social desirability issues that arise whenever a positive quality is being measured (Kashdan et al., 2004). Evidence for construct validity has been shown in daily diary (e.g., Kashdan & Steger, 2007), laboratory (e.g., Silvia, 2005, 2008), and cross-sectional studies (e.g., Gallagher & Lopez, 2007) in various populations.
Despite these advances, a few limitations warranted refinements in this measurement strategy. The absorption scale usually underperformed. Its internal consistency was weak, and its correlations with other variables were generally lower than the exploration subscale’s correlations (Gallagher & Lopez, 2007; Kashdan et al., 2004). One reason for the absorption scale’s weakness was one reverse-scored item that contained a periphrastic negative (“I am not the kind of person who probes deeply into new situations or things”). Books on English usage advise against periphrastic negatives because many readers fail to process the not in such phrases (e.g., Garner, 2000). Missing the negative could explain the poor performance of this item and the short absorption subscale. Other work shows that removing reverse-scored items often improves the psychometric properties of scales. This is because reverse-scored items often fail to measure the construct of interest, loading onto a distinct factor from directly worded items (e.g., Rodebaugh, Woods, & Heimberg, 2007; Williams, Ford, & Nguyen, 2002). Essentially, our attempt to reduce social desirability effects by including a reverse-scored item ended up introducing other unintended problems. Another reason for the scale’s weak score validity is the challenge of writing items to capture the unselfconscious state of flow-like absorption (Csiksentmihalyi, 1990).
Given the increasing popularity of the CEI, it seemed worthwhile to revise the scale. In an attempt to create a brief, psychometrically sound measure of curiosity, the authors failed to capture the breadth of the construct. The existing literature on curiosity is replete with various multi-dimensional models of curiosity that required consideration. Several early theorists (Berlyne, 1960; Day, 1971) draw a distinction between the interlocking components of specific and diversive curiosity. Specific curiosity refers to an open and receptive attitude and willingness to explore events that are ambiguous, strange, unusual, or uncertain. As a behaviorist, Berlyne wrote of the importance of these “collative qualities” of a stimulus to induce curiosity. With the advancement of cognitive science, it is now understood that subjective appraisals of novelty and complexity are more important than “objective” stimulus features (Silvia, 2006). Often, specific curiosity and motivated actions originate with a mixture of pleasant and unpleasant feelings (Berlyne, 1967; Leherissey, 1971). This is not surprising because novel and uncertain events often elicit a conflict between the desire to escape anxiety and the desire to act on curious feelings (Spielberger & Starr, 1994). Highly curious people are theorized to more readily tolerate anxiety and continue in the direction of desired explorations. Diversive curiosity refers to a more general desire to seek out new experiences and information, with exploration leading to some degree of insight of the previously unknown. Diversive curiosity originates when someone feels a readiness to grow and expand as opposed to remaining in familiar, certain territory. Although he relied on the term intrinsic motivation instead of curiosity, a similar model was proposed by Deci (1975), who suggested that one facet refers to seeking new stimulation (mirroring diversive curiosity) and the other involves confronting challenges and working with ambiguity and uncertainty (mirroring specific curiosity).
Other divisions of curiosity focus on the sources that arouse interest and motivate exploratory behavior. For instance, distinctions have been made between epistemic curiosity (desire for intellectual information or facts), perceptual curiosity (desire to acquire experiences through the senses), and variants of sensation seeking (preference for thrilling, adventurous, and dangerous experiences where great risks are willing to be incurred for the sake of varied experiences) (Berlyne, 1954; Zuckerman, 1994). Several instruments were created to measure these facets of curiosity (e.g., Ainley, 1986; Collins, Litman, & Spielberger, 2004; Litman & Spielberger, 2003). However, we believe that attempting to understand and measure the nature of curiosity is a different aim than focusing on the variety of curiosity inducers spanning objects, people, memories, fantasy, and ideas.
In the original CEI, the authors captured the specific curiosity and exploration dimension, as well as the centrality of being able to self-regulate attention to find new experiences and sustain engagement. The self-regulation of attention has been advocated as a necessary antecedent to actively acting on curious feelings (Bishop et al., 2004). However, the authors of the CEI failed to address individual differences in the willingness to manage (even embrace) the tension that often arises when confronting novelty and uncertainty. We wanted to capture this facet of curiosity that is central to several theoretical models but often ignored in measurement attempts (Berlyne, 1960; Beswick, 1971; Day, 1971; Deci, 1975). Whether a person is intrigued by new information or sensations (Fredrickson, 1998; Izard, 1977) or aiming to resolve a perceived gap in knowledge (Beswick, 1971; Loewenstein, 1994), most theorists agree that being curious entails reacting to events with open, non-defensive attitudes. This includes tolerance for ambiguity, distress, and uncertainty, and viewing difficulties as challenges more often than threats.
The Present Research
The major goal of the present research was to improve the initial version of the CEI to create a brief, reliable, valid measure of curiosity that expands the breadth of the construct. One central facet that is widely discussed in theoretical models of curiosity, and addressed in prior instruments, is exploration or stretching. This might be defined as actively seeking opportunities for new information and experiences (e.g., Ainley, 1987; Berlyne, 1960; Pearson, 1970). A second central facet of curiosity is the willingness to embrace the novel, uncertain, and unpredictable nature of everyday life (Berg & Sternberg, 1985; Beswick, 1971; Day, 1971; Silvia, 2008). Although tolerance of uncertainty has been considered in conceptual models of curiosity, this element has been consistently ignored in prior measurement attempts. Efforts were made to represent these two fundamental facets of curiosity in the new measure.
To meet our aims, we conducted factor analyses with multiple samples. To address convergent and discriminant validity, we examined relations with other measures of affective styles, emotion regulation, and personality. Measures of well-being were included to extend recent research showing that curiosity contributes to greater emotional, psychological, and social well-being. Finally, we conducted item response theory analysis (IRT) to move beyond classic test theory to better understand the quality of the items and information provided by our curiosity scale. In particular, for a socially desirable construct, it can be useful to understand whether our attempt to measure curiosity captures the full continuum of scorers or is circumscribed to extremely high and low scorers.
Study 1
Participants
To establish the initial validity of the CEI-II, we used a sample of 311 undergraduates (247 female) from a large, public, Mid-Atlantic university. The majority of the sample identified themselves as “Caucasian” (56.2%), while the rest were “Asian” (16.4%), “African American” (9.2%), “Hispanic” (7.9%), and “other” (10.3%). Participants were at least 18 years old with a mean age of 22.02 (SD = 5.23).
Item Generation
A preliminary pool of 36 items was generated by the first two authors. This pool of items contained revised versions of many of the items of the original CEI (Kashdan et al., 2004) and was generated based on the a priori hypothesis that there may be three facets of curiosity: exploring or stretching, absorption, and embracing uncertainty. At least ten potential items were constructed to measure each of the three hypothesized factors, and the order of these items was randomized.
One problem of the CEI was that absorption items loaded together into a separate factor but served minimal utility on their own; in fact, they appeared to suppress the validity of the total score. Thus, our decision to remove absorption from the final CEI-II item pool was an iterative process. First, we determined whether an absorption factor would be found in factor analyses. Second, we evaluated the validity of these items. In each of the studies in this paper, we found support for an absorption factor characterized by the ability to self-regulate attention toward activities and be immersed and engaged. However, these items failed to show correlations greater than |.13| with 26 out of 30 outcome variables. The removal of these items improved the reliability and validity of the CEI-II total score. We believe that absorption is difficult to measure with a global self-report instrument that does not take context into consideration. Moreover, tendencies to be absorbed are implicit in the stretching and embracing facets of curiosity. For these reasons, our final item pool excluded absorption items. We believe this is one of many advancements of the CEI-II over the original CEI. The absorption items and data are available upon request.
Measures
Acceptance and Action Questionnaire-II (AAQ-II; Bond et al., submitted)
The AAQ-II is a 10-item measure assessing individual differences in the ability to flexibly respond to emotions as the situation demands without needless defense and avoidance. This scale has adequate psychometric properties (α = .89; for data on original scale, see Hayes et al., 2004).
Emotion Regulation Questionnaire (ERQ; Gross & John, 2003)
This scale consists of 4 items assessing the reliance on suppressing emotions (α = .85) and 6 items assessing cognitive reappraisal as regulatory strategies (α = .71). The scale shows good psychometric properties (Gross & John, 2003).
Berkeley Expressivity Questionnaire (BEQ; Gross & John, 1995)
We used the 16-item Berkeley Expressivity Questionnaire to assess tendencies to express negative emotions (α = .67) and positive emotions (α = .70), respectively, and impulsive tendencies to express emotions as they first appear (α = .74). The measure shows adequate psychometric properties (Gross & John, 1997).
Difficulties in Emotion Regulation Scale (DERS: Gratz & Roemer, 2004)
This contains 36 items to assess six self-regulatory problems: unwillingness to accept emotions that arise (accept; α = .87), difficulties engaging in goal-directed behavior (goals; α = .89), impulse control problems when upset (impulse; α = .88), inadequate attention to emotions (aware; α = .78), limited access to effective emotion regulation strategies (strategies; α = .88), and difficulty identifying and communicating feelings (clarity; α = .79). The scale shows adequate reliability and validity (Gratz & Roemer, 2004; Gratz, Rosenthal, Tull, Lejuez, & Gunderson, 2006).
Results
Factor Analysis
We began by conducting an exploratory factor analysis (EFA). This analysis was conducted in SPSS using maximum-likelihood estimation with promax rotation. The oblique rotation method was chosen because we hypothesized that the factors would be correlated facets of the higher-order latent construct of curiosity. The results of the scree plot indicated the presence of two factors (eigenvalues of 3.99 and 1.40) that were clearly interpretable as the stretching and embracing facets of curiosity. Based on this initial EFA, we selected the best 10 of the original 36 items. These 10 items were selected by identifying the five best items for both factors based on high loadings on the designated factors and low cross-loadings on the other factor. This revised, 10-item version of the Curiosity and Exploration Inventory (CEI-II) can be found in Appendix A. After finding preliminary support for this 2-factor, 10-item CEI-II, we conducted a series of analyses to explore the psychometrics and construct validity of the revised measure.
Psychometrics
Means, standard deviations, alpha reliability coefficients, and correlations between the CEI-II and other constructs are reported in Table 1. The CEI-II has acceptable internal reliability. As might be expected, one of the strongest positive relations with the CEI-II was psychological flexibility (r = .29). This makes sense as flexibility is defined as the ability to be aware in the present moment and fully in contact with thoughts and feelings without needless defense, and, depending upon what the situation affords, persisting or changing behavior in the pursuit of valued aims (Hayes, Luoma, Bond, Masuda, & Lillis, 2006). Being curious is considered one of the ingredients for living flexibly and discovering interests and values that aid in decision-making and resource allocation (Bishop et al., 2004). In the same vein, curiosity has expected positive relations with effective reappraisal skills (or regulating emotions by viewing events from different perspectives) (r = .35), the willingness to openly express positive emotions (r = .22), and the ability to persist at goal-directed behavior (r = −.23) and access multiple routes to goals (r = −.25) even when distressed. Together, these findings converge to illustrate the awareness, openness, flexibility, and distress tolerance of people scoring higher on the CEI-II.
Table 1.
Means, Standard Deviations, and Correlations for the CEI-II in Study 1
| CEI-II-Total | CEI-II-Stretching | CEI-II-Embracing | |
|---|---|---|---|
| Mean (SD) | 32.94 (6.65) | 17.51 (3.69) | 15.43 (4.01) |
| α | .83 | .79 | .76 |
| AAQ-II | |||
| Flexibility | .29** | .26** | .19* |
| ERQ | |||
| Suppression | −.06 | −.09 | .02 |
| Reappraisal | .35** | .31** | .28** |
| BEQ | |||
| Negative Expressivity | −.10 | −.06 | −.12* |
| Positive Expressivity | .22** | .24** | .13* |
| Impulse Strength | −.08 | −.06 | −.05 |
| DERS | |||
| Total | −.21** | −.22** | −.10 |
| Clarity | −.10 | −.15 | .02 |
| Aware | −.20** | −.22** | −.09 |
| Impulse | −.15* | −.14* | −.08 |
| Accept | .08 | −.07 | −.03 |
| Goals | −.23** | −.23** | −.13* |
| Strategies | −.25** | −.23** | −.16* |
= p < .05;
= p < .001.
Notes. AAQ-II: Acceptance and Action Questionnaire; ERQ: Emotion Regulation Questionnaire; BEQ: Berkeley Expressivity Questionnaire; DERS: Difficulties in Emotion Regulation Scale.
Study 2
Participants
To provide further evidence of the validity of the CEI-II, we evaluated confirmatory factor analysis (CFA) models in a second sample of undergraduates from a large Midwestern University. This sample consisted of 150 undergraduates (99 females) with an average age of 19.53 (SD = 2.73) who participated in exchange for psychology course credit. The majority of the sample identified themselves as “Caucasian” (80.7%), while the rest were “Asian” (10%), “African American” (1.3%), “Hispanic” (2.7%), and “other” (5.3%). These participants completed the 10 item CEI-II as a part of a larger battery of questionnaires.
Measures
Emotional and psychological well-being
The trait version of the Positive and Negative Affect Schedule (PANAS; Watson, Clark, & Tellegen, 1988) was used to assess general positive affect (10 items) and negative affect (10 items). Life satisfaction was assessed using the 4-item Subjective Happiness Scale (SHS; Lyubomirsky & Lepper, 1999). In this sample, alphas ranged from .87 to .92. A 42-item version of Ryff’s Psychological Well-Being Scale (1989) assessed six additional elements of well-being: autonomy, environmental mastery, personal growth, positive relations with others, purpose in life and self-acceptance. Each factor was assessed with seven items (α’s from .73 to .86).
Social well-being
Using scales developed by Keyes (1998), we measured five elements of social well-being: social integration, social acceptance, social contribution, social actualization, and social coherence. Each scale contains six or seven items (α’s from .70 to .86).
Emotional distress
The 21-item version of the Depression, Anxiety, and Stress Scales (DASS; Lovibund & Lovibund, 1995) was used as a global measure of psychological distress. The DASS contains three seven item scales with the intent of providing “pure” measures of anxiety, depression, and general distress (α’s from .81 to .87).
Results
Factor Analysis
We used CFA to validate the two-factor latent structure of curiosity identified in Study 1. CFA models were analyzed using LISREL 8.8 and maximum-likelihood estimation. The covariance matrix was used for all models, and constructs were identified by fixing the variances to 1. Models were evaluated for goodness of fit using several common fit indices: the root mean square error of approximation (RMSEA; Steiger & Lind, 1980), the standardized root mean residual (SRMR; Jöreskog & Sörbom, 1996), the non-normed fit index (NNFI; Bentler & Bonett, 1980), and the comparative fit index (CFI; Bentler, 1990). Current guidelines regarding model fit indices (Brown, 2006; Hu & Bentler, 1999; Kline, 2005) suggest that CFA/NNFI values >= .95, and RMSEA/SRMR values <= .08 indicate good model fit. However, each of these fit indices suffers from different biases and it is therefore important to collectively evaluate the results of the various fit indices. We began by examining the support for the two-factor latent structure identified in the first sample using the final 10-item scale. This model demonstrated good fit (X2 (34, n=150) = 64.62, p <.01; NNFI = .96; CFI = .97; RMSEA = .08; SRMR=.06) according to each of the fit indices. The standardized results of this model can be seen in Figure 1. These results provide further evidence of the validity of the revised, 10-item Curiosity and Exploration Inventory.
Figure 1.
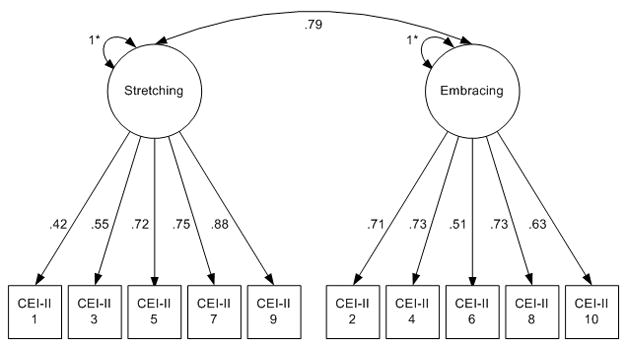
Completely standardized solution of the two factor model of curiosity in the second student sample. Model fit: X2 (34, n=150) = 64.62, p <.01; NNFI = .96; CFI = .97; RMSEA = .08; SRMR=.06.
Psychometrics
Means, standard deviations, alpha reliability coefficients, and correlations between the CEI-II and other constructs are reported in Table 2. The CEI-II has acceptable internal reliability (α=.86). The strongest correlation was with the Personal Growth subscale (r = .49), which has the greatest content overlap with the notion of curiosity motivating people to explore, discover, and expand their knowledge and experiences (Izard, 1977). Consistent with prior work, people scoring higher on the CEI-II report greater meaning and purpose in life (r = .38) (Kashdan & Steger, 2007), positive affect and general happiness (rs = .28 and .32) (Gallagher & Lopez, 2007; Kashdan et al., 2004), a satisfied need to belong (as operationalized by positive relations with others and social actualization; rs = .33 and .23) and a sense of social value as a member of society (i.e., social contribution; r = .34) (e.g., Kashdan & Silvia, 2009; McCrae, 1996). Also, small inverse relations exist between curiosity and emotional disturbances such as depressive symptoms (r = −.26) and anxiety (r = −.17). These small relations are not surprising as an open and receptive attitude to novelty and uncertainty implies a certain comfort level with a rich emotional life, including sadness and tension (this distress tolerance emerged in the pattern of correlations in Study 1)..
Table 2.
Means, Standard Deviations, and Pearson Correlations for the CEI-II in Study 2
| CEI-II-Total | CEI-II-Stretching | CEI-II-Embracing | |
|---|---|---|---|
| Mean (SD) | 33.22 (6.78) | 17.98 (3.63) | 15.24 (3.97) |
| α | .86 | .80 | .79 |
| Positive Affect | .28** | .38** | .20* |
| Negative Affect | −.05 | −.10 | −.04 |
| General Happiness | .32** | .35** | .34** |
| Psychological Well-Being Scale | |||
| Autonomy | .35** | .40** | .23** |
| Environmental Mastery | .15 | .27** | .01 |
| Personal Growth | .49** | .54** | .34** |
| Positive Relations | .33** | .37** | .22** |
| Purpose in Life | .38** | .45** | .24** |
| Self Acceptance | .39** | .47** | .24** |
| Social Well-Being | |||
| Social Acceptance | .07 | .06 | .07 |
| Social Actualization | .23* | .24** | .18* |
| Social Coherence | .10 | .19* | .00 |
| Social Contribution | .34** | .42** | .20* |
| Social Integration | .23* | .30** | .11 |
| Depression, Anxiety, and Stress Scales | |||
| General Distress | −.06 | −.08 | −.02 |
| Anxiety | −.17* | −.18* | −.12 |
| Depression | −.26** | −.32** | −.16 |
Notes.
= p < .05;
= p < .001.
Study 3
Participants
To further examine the factor structure and validity of the CEI-II, we studied a third sample of undergraduates from a Mid-Atlantic University. This sample consisted of 119 undergraduates (95 females) with an average age of 19.81 (SD = 3.25) who participated in exchange for psychology course credit. The majority of the sample identified themselves as “Caucasian” (61%), while the rest were “Asian” (17.8%), “African American” (11%), “Hispanic” (4.2%), and “other” (5.9%). Participants completed the 10 item CEI-II as a part of a larger battery of questionnaires.
Measures
Mindfulness
The 15-item Mindful Attention Awareness Scale (MAAS; Brown & Ryan, 2003) assessed trait mindfulness. In particular, the items capture awareness in the present moment—the ability to observe and attend to thoughts, feelings, and sensations as they fluctuate over time (α = .87). Lower scores reflect greater mindfulness.
Big Five personality traits
The 60-item NEO-PI (Costa & McCrae, 1992) assessed trait openness to experience (α = .70), conscientiousness (α = .86), extraversion (α = .79), agreeableness (α = .75), and neuroticism (α = .63).
Political views
Using a 4-item face-valid measure, we assessed the degree to which people adopted conservative political views. On a scale from 1 = very liberal to 7 = very conservative, people rated their views on foreign policy, economic, and social issues. They also rated themselves on a continuum from extremely liberal to extremely conservative. We used an aggregate of these items (α = .86).
Results
Factor Analysis
We began by examining the support for the two-factor latent structure identified in the first two samples. This model demonstrated good fit according to most of the fit indices (X2 (34, n=117) = 60.48, p <.01; CFI = .95; RMSEA = .08; SRMR=.06), but only marginal fit according to one fit index (NNFI=.93)., The completely standardized results of this model can be seen in Figure 2. These results provide further evidence for our framework.
Figure 2.
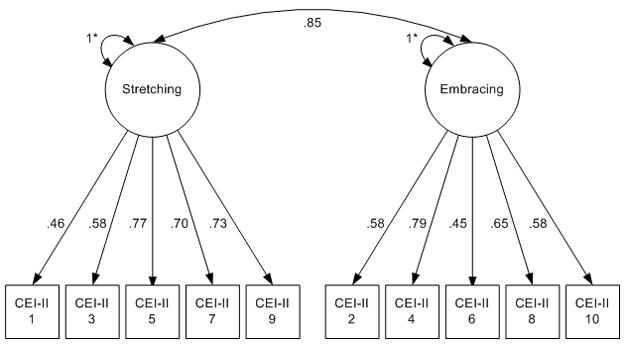
Completely standardized solution of the two factor model of curiosity in the third student sample. Model fit: X2 (34, n=117) = 60.48, p <.01; NNFI = .93; CFI = .95; RMSEA = .08; SRMR=.06.
Psychometrics
Means, standard deviations, alpha reliability coefficients, and correlations between the CEI-II and other constructs are reported in Table 3. Once again, results indicated that the CEI-II has acceptable internal reliability (α=.85). As might be expected due to their conceptual overlap, the strongest correlation with the CEI-II was openness to experience (r = .51). In the Big Five theoretical framework, curiosity is considered a lower-order, central facet of openness to experience (John & Srivastava, 1999). Also, curiosity had a large positive correlation with extraversion (r =.42), often considered to be a reflection of positive affectivity and reward sensitivity (as opposed to sociability; Lucas, Diener, Grob, Suh, & Shao, 2000; Watson & Clark,1997). This fits with research defining curiosity as a discrete positive affect (Fredrickson, 1998; Izard, 1977). As another demonstration of links with psychological flexibility, curiosity was associated with more liberal political values (r = −.26). Finally, of the three studies, the strongest correlate of the embracing subscale of the CEI-II was mindful awareness (r = −.22). This is not surprising as the item content of the embracing subscale reflect an open and receptive attitude when confronted with uncertain, unfamiliar, ambiguous, or novel stimuli. Regardless of ongoing unpleasant feelings, people scoring high in embracing should be more aware in the present moment and effective at managing their behavior. The link with mindfulness provides validity for this dimension of curiosity.
Table 3.
Means, Standard Deviations, and Pearson Correlations for the CEI-II in Study 3
| CEI-II-Total | CEI-II-Stretching | CEI-II-Embracing | |
|---|---|---|---|
| Mean (SD) | 32.90 (7.48) | 17.08 (3.88) | 15.82 (4.37) |
| α | .85 | .78 | .75 |
| Big Five | |||
| Openness to Experience | .51** | .50** | .43** |
| Conscientiousness | .20* | .31* | .07 |
| Extraversion | .42** | .29* | .46** |
| Agreeableness | −.04 | .03 | −.09 |
| Neuroticism | −.27* | −.30* | −.20* |
| Mindfulness | −.14 | −.02 | −.22* |
| Conservative political views | −.26* | −.28* | −.19* |
= p < .05;
= p < .001.
Notes. Lower scores reflect greater mindfulness.
Study 4: An Item Response Theory Analysis
The CEI-II deserves close psychometric scrutiny, given the limitations of the first scale and the goal to create a brief instrument. In this study, we appraised the scale’s psychometric features using IRT. Among its other advantages, IRT makes realistic assumptions about measurement error. Classical test theory (CTT) assumes that measurement error is constant across levels of the personality trait—all levels are supposedly measured equally well, so all participants are presumably measured with the same amount of error. Few researchers would actually agree that this is true in practice. Most researchers, for example, would suspect that extreme scores on personality scales contain more measurement error than less extreme scores.
IRT, in contrast, assumes that some levels of the trait are measured with less error than other levels. More importantly, IRT allows researchers to estimate which trait regions are measured more effectively, thereby illuminating the scale’s psychometric behavior. For example, some scales ought to have the most reliable scores—the most test information, in IRT—at the high end of the trait. Criterion-referenced scales, for example, ought to have the most information at the cut-off point because researchers using the scale primarily want to discriminate between people above or below the cut-off. For norm-referenced scales measuring factors of normal personality, such as the CEI-II, researchers would want the scale to measure the trait’s middle most reliably, given that the full range of scores is of interest to individual-differences researchers.
In CTT, samples and items are confounded. Estimates of people’s trait levels depend on features of the items, and estimates of the items’ features depend on features of the sample. IRT, in contrast, estimates people’s trait levels independently of the items and the items’ properties independently of the sample. For this reason, the trait scores generated by IRT are presumed to be robust—theoretically, they ought to be independent of the items used to assess the trait. Likewise, the item parameters provided by an IRT analysis ought to be independent of the specific people who responded to the items. As a result, IRT can allay common concerns over a sample’s representativeness.
IRT is valuable to personality assessment in general, and it offers unique insight into the CEI-II. For one, IRT can provide information about which range of the trait is assessed most accurately. Information about a scale’s information maximum (i.e., the trait level with the lowest measurement error) is useful to researchers who plan to use the scale. Furthermore, the scale’s IRT parameters—item discrimination and item difficulty—should be robust across samples, so they are informative for researchers interested in using the scale with diverse samples.
Method
Participants
Given the large sample-size requirements of IRT methods, we combined the samples reported in Studies 1, 2, and 3 to form a sample of 578 people (76% female). There was very little missing data: the covariance coverage (proportion of complete cases per matrix cell) ranged from 99.5% to 100%.
Statistical Model and IRT Estimates
The data were analyzed using a two-parameter logistic (2PL) graded-response model (Samejima, 1997), which is a polytomous generalization of a common 2PL model for binary data (Embretson & Reise, 2000; Ostini & Nering, 2006). The models were estimated with full-information maximum-likelihood with robust standard errors. All analyses were conducted using Mplus 5.2.
For our IRT analysis, we were interested in three estimates. First, IRT provides estimates of each item’s discrimination (the a-parameter), which reflects how quickly the probability of endorsing an item changes as a function of changes in the underlying latent trait. The strength of an item’s discrimination value is conceptually akin to the strength of an item’s factor loading in a confirmatory factor analysis (CFA): highly-discriminating items more strongly reflect the latent trait. (A two-parameter IRT model is in fact a kind of CFA model; Brown, 2006; Skrondal & Rabe-Hesketh, 2004.)
Second, IRT provides estimates of each item’s difficulty (the b-parameter). In IRT, an item’s difficulty is expressed in relation to the underlying trait. If only people high in the trait endorse an item, then the item is difficult; if people low in the trait endorse the item, then the item is easy. In personality assessment, easy items tend to get high scores from nearly everyone. The Rosenberg Self-Esteem Scale, for example, is an “easy scale” because most people have very high scores (Gray-Little, Williams, & Hancock, 1997). In traditional norm-referenced testing, researchers desire a scale’s items to be moderately difficult (i.e., means around the midpoint) because, all else equal, the scale’s internal consistency will be higher. There’s no necessary reason, however, for each item to be similarly difficult. In fact, researchers who wish to provide information about a broad range of a trait ought to include items that vary in difficulty.
Finally, IRT provides estimates of the scale’s total information function, which depicts the amount of information the scale provides across levels of the latent trait. Classical test methods have no analog to IRT’s test information and standard error functions because they presume that all trait levels are measured equally well.
Results
To simplify the analyses and presentation, we estimated an IRT model for the total scale score (i.e., overall curiosity) rather than separate models for the subscales. These findings thus describe the properties of the global curiosity variable that subsumes the two highly-correlated facets. According to a categorical factor analysis (i.e., one that treats the items as ordinal, polytomous variables and uses polychoric correlations) of the 10 items, the data satisfy the IRT assumptions regarding local independence and construct dimensionality.
Table 4 lists the CEI-II’s items and the percentage of the sample that gave a particular response to each item. There were no empty cells—all of the options were selected at least once—but some items received few 1s. The modal response was a 3 or 4.
Table 4.
Descriptive Statistics, Percent Responses by Scale Value, and IRT Discrimination Values (a) and Difficulty Thresholds (b)
| CEI-II Items | M | % 1 | % 2 | % 3 | % 4 | % 5 | a | b1 | b2 | b3 | b4 |
|---|---|---|---|---|---|---|---|---|---|---|---|
| 1. I actively seek as much information as I can in new | 3.69 | 1.9 | 8.8 | 27.3 | 42.4 | 19.6 | .57 | −4.23 | −2.36 | −.55 | 1.65 |
| 2. I am the type of person who really enjoys the uncertainty of | 3.15 | 9.2 | 19.1 | 30.5 | 30.2 | 11.1 | .60 | −2.47 | −1.07 | .35 | 2.27 |
| 3. I am at my best when doing something that is complex or | 3.51 | 4.7 | 9.9 | 32.6 | 35.6 | 17.2 | .71 | −2.84 | −1.72 | −.13 | 1.55 |
| 4. Everywhere I go, I am out looking for new things or | 3.31 | 6.2 | 15.3 | 33.8 | 30.5 | 14.2 | 1.02 | −2.09 | −1.08 | .14 | 1.45 |
| 5. I view challenging situations as an opportunity to grow and | 3.59 | 2.8 | 11.6 | 28.5 | 37.2 | 19.9 | 1.08 | −2.56 | −1.35 | −.23 | 1.08 |
| 6. I like to do things that are a little frightening. | 2.87 | 15.6 | 24.4 | 27.6 | 22.5 | 9.9 | .57 | −1.93 | −.52 | .79 | 2.50 |
| 7. I am always looking for experiences that challenge how I | 3.36 | 3.5 | 17 | 35.1 | 28.7 | 15.7 | 1.06 | −2.44 | −1.09 | .16 | 1.34 |
| 8. I prefer jobs that are excitingly unpredictable. | 3.03 | 10.1 | 22.4 | 32.8 | 24.4 | 10.4 | .69 | −2.16 | −.78 | .59 | 2.16 |
| 9. I frequently seek out opportunities to challenge myself and | 3.16 | 5.2 | 21.3 | 37.3 | 24.4 | 11.8 | .97 | −2.28 | −.88 | .44 | 1.67 |
| 10. I am the kind of person who embraces unfamiliar people, | 3.32 | 6.6 | 16.3 | 31.7 | 28.9 | 16.5 | .89 | −2.16 | −1.06 | .11 | 1.39 |
Note. The percentages represent the percent of the sample that selected a given response option. Items 1, 3, 5, 7, and 9 are the Stretching facet; items 2, 4, 6, 8, and 10 are the Embracing facet.
Discrimination Values
Table 4 reports the items’ discrimination values (a values). In IRT, these values can range from 0 to around 3. They represent how quickly an item’s scores change as a function of changes in the latent trait. Like factor loadings in a CFA, they capture how closely an item represents the latent trait being measured.
On the whole, the discrimination values are good, although some are higher than others. Based on Baker’s (1985) guidelines, 5 items have moderate discrimination (1, 2, 3, 6, and 8), 2 items have high discrimination (9 and 10), and 3 items have very high discrimination (4, 5, and 7). For self-report measures of individual differences, it is not necessarily desirable to have only items with very high discrimination. Such items provide a great deal of information for only a narrow range of the trait.
To get a sense of what the discrimination values mean, we can view the category response curves (CRC), which display how the score probabilities vary as a function of the latent curiosity trait. For the sake of illustration, Figure 3 presents the CRCs for items 5 and 6, which differ in their discrimination values. The CRCs depict the probability that someone will respond to the item with a 1, 2, 3, 4, or 5. The probability level is along the Y-axis; the level of trait curiosity, expressed as a standard normal distribution (M = 0, SD = 1), is along the X-axis.
Figure 3.

Category response curves for Items 5 and 6.
The CRCs depict the predictions that the IRT model makes about how people who vary in curiosity ought to respond. For Item 6, for example, someone with a trait level of −2 (2 SD below the mean) is most likely to respond with a 1, someone with a trait level of 0 is most likely to respond with a 3, and someone with a trait level of 2 is most likely to respond with a 4.
The different discrimination values are evident in the peaks and overlaps of the probability curves. For Item 5, which has a higher discrimination value, the response probabilities have higher peaks and have relatively less overlap. Each scale value (1 through 5) has a region where its absolute probability is at least 50%, indicating that there are trait levels where that response is more probable than the other 4 options combined. For Item 6, in contrast, the response probabilities are flatter and overlap more significantly. For the middle three options (2, 3, and 4), the response curves are never higher than .50. Hence, Item 6 doesn’t discriminate between people as well. Stated differently, Item 6 does not rank-order people as well or predict their responses as precisely as Item 5 does.
Difficulty Thresholds
Table 4 reports the items’ difficulty thresholds. Each item has 5 possible responses, so there are 4 response thresholds, depicted as b1, b2, b3, and b4. In IRT, these thresholds represent the trait levels at which someone has a 50% chance of scoring at or above a scale response.
These thresholds give a good deal of information about each item. For example, we will use the thresholds for Item 5. The value for b1, the threshold between a response of 1 and a response of 2, is −2.56. This means that someone with a trait score of −2.56, a pretty low level, has at least a 50% chance of responding to the item with a 2, 3, 4, or 5. Stated conversely, a response of 1 is the most likely response for people with a curiosity level less than −2.56. The value for b2, the threshold between the scores of 2 and 3, is −1.35, so people with a curiosity score of −1.35 have at least a 50% chance of responding with a 3, 4, or 5. On the whole, these thresholds reveal that Item 5 is somewhat easy. The last threshold, b4, is 1.08, which is only around 1 SD above the mean. This means that everyone with a curiosity level greater than 1.08 has at least a 50% chance of responding with a 5, the highest possible scale score.
The difficulty thresholds are related to the frequency with which people chose different response options. Item 6, for example, has a high b4 threshold, and relatively few people responded with a 5 to the item. Conversely, Item 1 has a low b1 threshold, and relatively few people responded with a 1 to the item.
For a self-report scale that measures individual differences, it is desirable for the items to offer information about a broad range of the trait. For this reason, some items should be “easier” and others should be “harder.” An example of a relatively easy item is Item 1: its lowest threshold is quite low, and only 1.9% of the sample responded with a 1 to it. Only people who are very low in curiosity will respond with low scores to this item. A relatively harder item is Item 6: its highest threshold is 2.5, so only people who are very high in curiosity will respond with a 5. Nevertheless, there is not much between-item variation in the difficulty ranges. Each item covers a good range of the trait, but the items as a group tend to be centered at the trait’s midpoint.
Item Information and Test Information
Information functions depict the range of the trait that an item or scale measures most reliably. For polytomous IRT models, an item’s information function nicely captures the item’s difficulty and discrimination: difficulty levels affect the function’s position on the X-axis, and discrimination levels affect the function’s kurtosis (or peakedness). The information functions thus visually summarize the a and b values in Table 4.
Figure 4 depicts the item information functions for all 10 of the CEI-II items. It’s clear from these functions that all 10 items capture a similar range of the trait. All 10 curves peak roughly at zero, the trait’s midpoint, consistent with the items’ similar difficulty levels. Some curves are more leptokurtic than others, consistent with their higher discrimination values, but the differences between items are not great. In short, each of the 10 items provides maximal information at around the same trait level.
Figure 4.
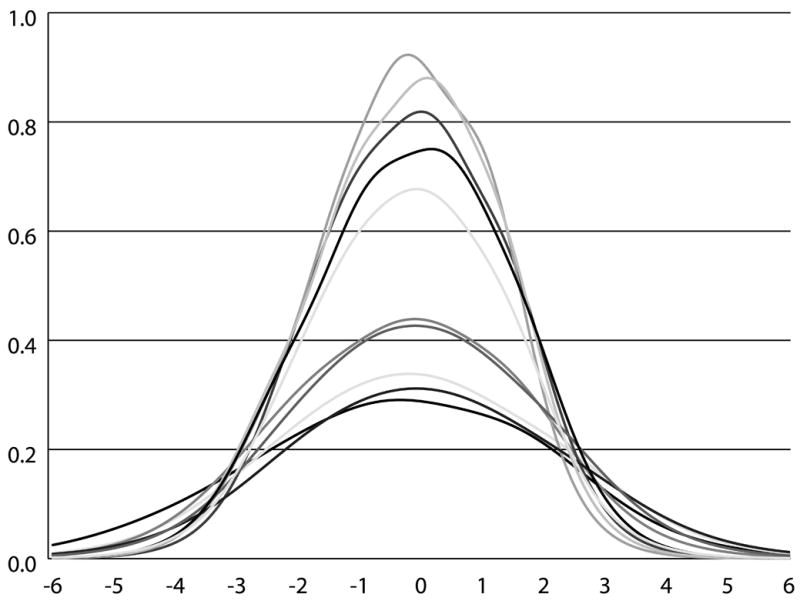
Item information functions for the 10 CEI-II items.
Figure 5 displays the test information function for the CEI-II. This curve depicts the region of the trait for which the scale as a whole provides the most information. Stated differently, the trait regions with the most information are the trait levels measured with the least error. For the CEI-II, the information function is centered almost exactly at 0, the midpoint of the latent curiosity trait. As a result, the CEI-II is capturing the “fat middle” of curiosity the best, not the trait’s low end or the high end. In terms of measurement error, the CEI-II measures people very high and very low in curiosity with the most error and people with intermediate scores with the least error. For a scale measuring normal individual differences, this is an ideal information function: the CEI-II provides information about a broad range of the trait, with maximal precision in the middle ranges.
Figure 5.
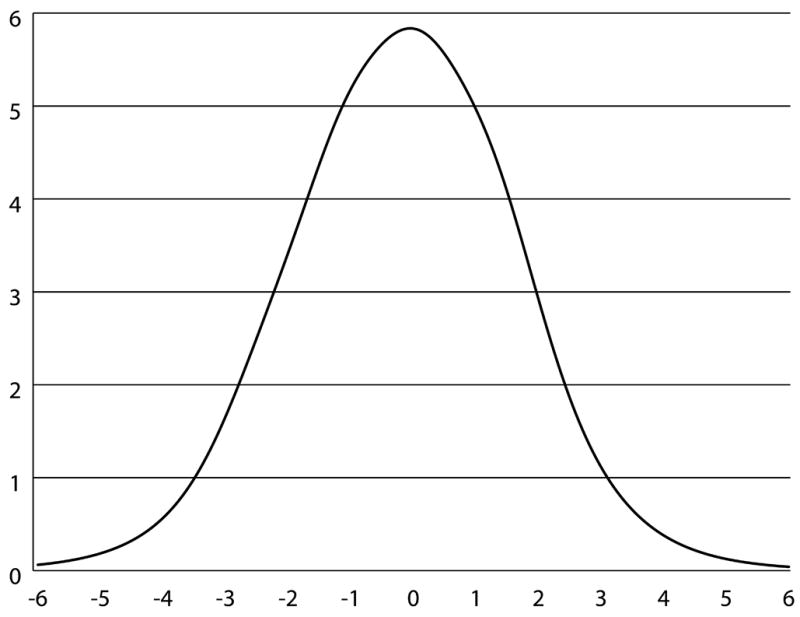
Test information function for the CEI-II.
General Discussion
The assessment of curiosity has flourished in the past few years. Many new scales have been published, but few have been subjected to close psychometric scrutiny. The present research centered on the development of a brief, reliable, and valid measure of curiosity, improving upon an earlier version of the CEI. The data offers early evidence for the scale’s latent structure and evidence for convergent and discriminant validity. This includes empirical support for two dimensions of curiosity: being motivated to seek knowledge and new experiences (Stretching; 5 items) and a general willingness to embrace the novel, uncertain, and unpredictable nature of everyday life (Embracing; 5 items). This factor structure was remarkably similar in independent samples. The 10-item CEI-II showed the expected correlations with relevant measures of psychological flexibility, affect, emotion regulation, and psychological and social well-being. Due to the large correlations among the subscales, there is also benefit in using the aggregate, total score in future investigations.
These two dimensions, stretching and embracing, converge with the interlocking elements of curiosity discussed by various theorists (e.g., Berlyne, 1960; Beswick, 1971; Day, 1971; Deci, 1975; Spielberger & Starr, 1994). Although these theorists discuss the importance of being able to manage the anxiety provoking nature of being confronted with novel, complex, or uncertain situations, most measures neglect the embracing dimension of curiosity. Without an ability to handle appraised novelty-complexity, curiosity and exploration is squelched with avoidance often serving as the replacement (Kashdan, 2007; Silvia, 2006).
Building on prior research with the original CEI and other measures, in three studies, we found an expected pattern of correlations with other constructs. The strongest correlations with curiosity included openness to experience and personal growth. Being curious is part of a sequence where these feelings motivate exploratory behavior that inherently leads to discovery and growth (no matter how slight) (Izard, 1977; Panksepp, 1998). Other positive correlations suggest that high scorers on the CEI-II are psychologically flexible, possess awareness and clarity of their emotions, report frequent positive emotions and general happiness, show a willingness to express positive feelings openly, and are able to persist or modify pathways to important goals even when confronted with distressing thoughts and feelings. Also, although curiosity is rarely considered in the social world, recent work suggests that being curious is integral to creating and maintaining satisfying conversations and intimate relationships (e.g., Burpee & Langer, 2005; Gable, Reis, Impett, & Asher, 2004; Kashdan & Roberts, 2004). The present series of studies provided further support for the social benefits of being a curious person as we found positive associations with satisfying the need to belong, possessing positive relations with other people, and feeling valued as a person embedded in larger society. Besides the social benefits linked to curiosity, other psychological needs for autonomy and self-acceptance (Deci & Ryan, 2000; Ryff, 1989) were more likely to be satisfied for highly curious people.
Nearly all of these positive correlates were more strongly linked to the stretching dimension of curiosity as opposed to the embracing dimension. The outcomes with the strongest unique relations to embracing were mindful awareness and extraversion. It is intuitive that people embracing uncertainty should show greater self-awareness and a willingness to be open to and receptive of both internal and external stimuli across the full range of positive and negative valence (Bishop et al., 2004; Brown & Ryan, 2003). Similarly, it was not surprising that this orientation to novelty and uncertainty would be strongly linked to openness to experience, personal growth, and general happiness. At first glance, the strong relation between embracing and extraversion might be surprising. However, the central feature of extraversion does not appear to be sociability, rather it appears to be the ability to extract pleasure and meaning from life events (e.g., Lucas et al., 2000; Lucas, Le, & Dyrenforth, 2008) and experience positive emotions despite encountering daily hassles and stressors in an uncertain world (Watson & Clark, 1997). With this formulation of extraversion, links to the ability to embrace the tension of novelty and uncertainty become more understandable.
Beyond classical test methods, we applied more advanced techniques to appraise and describe the CEI-II’s psychometric properties. The use of CFA procedures to evaluate the latent structure of curiosity across multiple samples provides evidence for the proposed 2-factor theory of curiosity. Although there was one instance of a fit index indicating only marginal fit, the results of the CFA models were almost uniformly supportive of the proposed 2-factor model. These results suggest that the CEI-II is a valid assessment for researchers interested in exploring the effects of curiosity within a latent variable modeling framework. Due to the strong correlation between the stretching and embracing facets of curiosity, we advise researchers to consider using parceling techniques (Little, Cunningham, Shahar, & Widaman, 2002) to create aggregated indicators of curiosity that contain items from both the stretching and embracing subscales. Parcels typically demonstrate superior psychometric properties (e.g. higher reliability, reduced chance of distributional violations) than individual items and might therefore provide a more reliable method of identifying the latent construct of curiosity.
The IRT analyses also yielded several findings that should encourage use of the scale. First, the item discriminations were good, although some items were clearly more discriminating than others. Discrimination values in this range are typical for self-report measures of attitudes and personality used in basic research. Second, the difficulty thresholds and information functions revealed that the CEI-II measures the midpoint of the trait most effectively.
These analyses offer some guidance for different uses of the scale. For one, the scale seems well-suited to basic studies of individual differences. The scale captures the “fat middle” of trait curiosity the best, so the scale will be effective for studies of normal between-person variation in curiosity. One consequence of the CEI-II’s test information function is that researchers are probably better off measuring the full range of curiosity instead of selecting people with high and low scores. Extreme-groups designs are common in personality and social psychology, in part because of the belief that they enhance statistical power. But one drawback, among others (Preacher, Rucker, MacCallum, & Nicewander, 2005), is that measurement error is often higher at a trait’s extremes, so any gain in power must be weighed against a loss of measurement precision. For the CEI-II, it is clear that the extreme values are measured less accurately. As a result, researchers who select people with high and low CEI-II scores are selecting the participants who were measured the least reliably. The scale is thus better suited to studies of the construct’s full range.1
There are several limitations in this series of studies that require mention. The reliance on cross-sectional assessment strategies and college student samples raise questions about the generalizability of findings. We are hopeful because the initial CEI continues to exhibit acceptable psychometric properties in adolescent (e.g., Kashdan & Yuen, 2007) and community samples (e.g., Almeida, Kashdan, Coelho, Albino-Teixeira, & Soares-da-Silva, 2008; Harvey, Novicevic, & Breland, 2009) from various countries outside the United States. The most serious caveat is that these studies lacked outcome variables to fully evaluate whether people scoring higher on the CEI-II are in fact more curious, exploratory, and better able to cope with the anxiety of novel, complex, and uncertain situations. In addition, most of the findings were circumscribed to the validity of the stretching dimension of the CEI-II with less information on the validity of the embracing dimension. Although there is preliminary evidence for the validity of the embracing subscale, there is reason to be tentative about these findings. Of the correlations tested, only two outcome variables (mindful awareness and extraversion) were more strongly related to embracing compared with stretching. This pattern of correlations might be capitalizing on chance. After all, other constructs related to extraversion in our studies such as positive affect showed stronger relations with the stretching subscale. Based on the presented data, it remains to be seen how much the embracing items add to our operationalization of curiosity. However, we can discuss unpublished data that addresses both of these concerns: an appropriate criterion measure to evaluate the CEI-II and the particular utility of the embracing items.
In an experimental study, we tested whether being curious, and in particular embracing uncertainty, would lead to non-defensive, exploratory reactions when confronted with information that can threaten a person’s cultural worldview (Kashdan, Afram, & Brown, 2009). Using a terror management theory paradigm where people are reminded of their own mortality (methodology from Study 2 of Goldenberg et al., 2001), participants were then asked to read and evaluate the writer of one of two essays. In the personal threat condition, participants read an essay that described humans as slightly more intelligent than other animals but otherwise no different from animals in any meaningful way (humans as animal). In the control condition, participants read an essay that described humans as having characteristics such as the capacity for language and morality that made them highly unique from other animals (humans as unique). We hypothesized that curious people would be open to the “personally threatening” information, responding in an open and receptive manner. As expected, people scoring higher on the embracing subscale of the CEI-II showed more positive ratings of the essay writer, regardless of being reminded of their mortality or the type of essay being read; a similar but smaller main effect was found for the CEI-II total score. Interestingly, we also found evidence of construct specificity from mindful awareness as measured by the MAAS (Brown & Ryan, 2003) with a Curiosity x Mindful Awareness interaction on likability of essay writer.
Essentially, if you are mindfully aware but not curious, you show a strong negative reaction to the threatening essay that humans are just another animal. Mindful awareness without curiosity was shown to be relatively inert and impotent without an open and curious attitude as they are paying attention in the present moment. This fits with theory suggesting that the ability to self-regulate attention and a curious orientation toward what is being attended are interlocking components that together comprise mindfulness (e.g., Bishop et al., 2004). This is the first study to test the synergistic relation between these ingredients of mindfulness. These data provide a useful criterion to show that the CEI-II taps curiosity and provide additional justification for the validity and clinical utility of the embracing subscale. The results are preliminary but we hope that other research teams beyond our own continue to explore this important strength of character and discrete positive emotional-motivational system (Fredrickson, 1998; Izard, 1977; Kashdan, 2009; Panksepp, 1998).
Given that the CEI-II was designed to measure individual differences in broad dimensions of curiosity, an important direction of future research will be modifying and adapting the items to fit particular domains of interest. This includes curiosity in school, work, relationships, or any other activity or context. Further study of trait curiosity is needed in experimental situations where novelty, uncertainty, and challenges are manipulated. Longitudinal studies examining the effects of curiosity could provide valuable information regarding the stability of curiosity across time as well as the mechanisms by which curiosity promotes positive psychological functioning. Also, studies are needed in naturalistic environments, via experience and behavior sampling approaches, to better understand the implications of higher trait curiosity on being a productive, healthy, functional member of society. Prior work suggests that curiosity offers benefits that are equal to or greater than other widely touted psychological strengths (e.g., Peterson et al., 2007) and elements of well-being (e.g., Kashdan & Yuen, 2007). Upon redressing problems associated with the original CEI, we hope that researchers focus more on this neglected, poorly understood, fundamental aspect of human behavior.
Acknowledgments
This research was supported by National Institute of Mental Health grant MH-73937 to Todd B. Kashdan.
Appendix A The Curiosity and Exploration Inventory-II
I actively seek as much information as I can in new situations.
I am the type of person who really enjoys the uncertainty of everyday life.
I am at my best when doing something that is complex or challenging.
Everywhere I go, I am out looking for new things or experiences.
I view challenging situations as an opportunity to grow and learn.
I like to do things that are a little frightening.
I am always looking for experiences that challenge how I think about myself and the world.
I prefer jobs that are excitingly unpredictable.
I frequently seek out opportunities to challenge myself and grow as a person.
I am the kind of person who embraces unfamiliar people, events, and places.
Footnotes
While our IRT analyses focus on the measurement of curiosity with the CEI-II, the general points should apply to other states and traits that are obviously socially desirable. This is particularly relevant to the current explosion of self-report measures of well-being (e.g., happiness, meaning in life), character strengths (e.g., gratitude, emotional intelligence), and self-regulatory processes (e.g., savoring, mindfulness).
Publisher's Disclaimer: This is a PDF file of an unedited manuscript that has been accepted for publication. As a service to our customers we are providing this early version of the manuscript. The manuscript will undergo copyediting, typesetting, and review of the resulting proof before it is published in its final citable form. Please note that during the production process errors may be discovered which could affect the content, and all legal disclaimers that apply to the journal pertain.
Contributor Information
Todd B. Kashdan, George Mason University
Matthew W. Gallagher, University of Kansas
Paul J. Silvia, University of North Carolina at Greensboro
Beate P. Winterstein, University of North Carolina at Greensboro
William E. Breen, George Mason University
Daniel Terhar, George Mason University.
Michael F. Steger, Colorado State University
References
- Ainley MD. Explorations in curiosity: Breadth and depth of interest curiosity styles. University of Melbourne; Australia: 1986. Unpublished doctoral dissertation. [Google Scholar]
- Ainley MD. The factor structure of curiosity measures: Breadth and depth of interest curiosity styles. Australian Journal of Psychology. 1987;39:53–59. [Google Scholar]
- Ainley MD. Interest in learning and the disposition of curiosity in secondary students: Investigating process and content. In: Hoffman L, Krapp A, Renninger KA, Baumert J, editors. Interest and learning. Kiel, Germany: IPN; 1998. pp. 257–266. [Google Scholar]
- Almeida L, Kashdan TB, Coelho R, Albino-Teixeira A, Soares-da-Silva P. Healthy subjects volunteering for phase I studies: Influence of curiosity, exploratory tendencies and perceived self-efficacy. International Journal of Clinical Pharmacology and Therapeutics. 2008;46:109–118. doi: 10.5414/cpp46109. [DOI] [PubMed] [Google Scholar]
- Baker FB. The basics of item response theory. Portsmouth, NH: Heineman; 1985. [Google Scholar]
- Bentler PM. Comparative fit indices in structural equation models. Psychological Bulletin. 1990;28:97–104. doi: 10.1037/0033-2909.107.2.238. [DOI] [PubMed] [Google Scholar]
- Bentler PM, Bonett DG. Significance tests and goodness of fit in the analysis of covariance structures. Psychological Bulletin. 1980;88:588–606. [Google Scholar]
- Berg CA, Sternberg RJ. Response to novelty: continuity versus discontinuity in the developmental course of intelligence. Advances in Child Development. 1985;19:1–47. doi: 10.1016/s0065-2407(08)60387-0. [DOI] [PubMed] [Google Scholar]
- Berlyne DE. Conflict, arousal, and curiosity. New York: McGraw-Hill; 1960. [Google Scholar]
- Berlyne DE. Arousal and reinforcement. In: Levine D, editor. Nebraska symposium on motivation. Vol. 15. Lincoln: University of Nebraska Press; 1967. pp. 1–110. [Google Scholar]
- Berlyne DE. Aesthetics and psychobiology. New York: Appleton-Century-Crofts; 1971. [Google Scholar]
- Beswick DG. Cognitive process theory of individual differences in curiosity. In: Day HI, Berlyne DE, Hunt DE, editors. Intrinsic motivation: A new direction in education. New York: Holt, Rinehart, & Winston; 1971. pp. 156–170. [Google Scholar]
- Bishop SR, Lau M, Shapiro S, Anderson N, Carlson L, Segal ZV, Abbey S, Speca M, Velting D, Devins G. Mindfulness: A proposed operational definition. Clinical Psychology: Science and Practice. 2004;11:230–241. [Google Scholar]
- Bond FW, Hayes SC, Baer RA, Carpenter KM, Orcutt HK, Waltz T, Zettle RD. Preliminary psychometric properties of the Acceptance and Action Questionnaire –II: A revised measure of psychological flexibility and acceptance. doi: 10.1016/j.beth.2011.03.007. submitted. [DOI] [PubMed] [Google Scholar]
- Boyle GJ. Critical review of state–trait curiosity test development. Motivation and Emotion. 1983;7:377–397. [Google Scholar]
- Brown KW, Ryan RM. The benefits of being present: Mindfulness and its role in psychological well-being. Journal of Personality and Social Psychology. 2003;84:822–848. doi: 10.1037/0022-3514.84.4.822. [DOI] [PubMed] [Google Scholar]
- Brown TD. Confirmatory factor analysis for applied research. New York: Guilford; 2006. [Google Scholar]
- Burpee LC, Langer EJ. Mindfulness and marital satisfaction. Journal of Adult Development. 2005;12:43–51. [Google Scholar]
- Collins RP, Litman JA, Spielberger CD. The measurement of perceptual curiosity. Personality and Individual Differences. 2004;36:1127–1141. [Google Scholar]
- Costa PT, Jr, McCrae RR. Revised NEO Personality Inventory (NEO-PI-R) professional manual. Odessa, FL: Psychological Assessment Resources; 1992. [Google Scholar]
- Csikszentmihalyi M. Flow: The psychology of optimal experience. New York: HarperCollins; 1990. [Google Scholar]
- Day HI. The measurement of specific curiosity. In: Day HI, Berlyne DE, Hunt DE, editors. Intrinsic motivation: A new direction in education. New York: Holt, Rinehart, & Winston. y; 1971. [Google Scholar]
- Deci E. Intrinsic motivation. New York: Plenum; 1975. [Google Scholar]
- Deci EL, Ryan RM. The “What” and “Why” of goal pursuits: Human needs and the self-determination of behavior. Psychological Inquiry. 2000;11:227–268. [Google Scholar]
- Dewey J. Interest and effort in education. Boston: Riverside; 1913. [Google Scholar]
- Dugas MJ, Freeston MH, Ladouceur R. Intolerance of uncertainty and problem orientation in worry. Cognitive Therapy and Research. 1997;21:593–606. [Google Scholar]
- Embretson SE, Reise SP. Item response theory for psychologists. Mahwah, NJ: Erlbaum; 2000. [Google Scholar]
- Fredrickson BL. What good are positive emotions? Review of General Psychology. 1998;2:300–319. doi: 10.1037/1089-2680.2.3.300. [DOI] [PMC free article] [PubMed] [Google Scholar]
- Gable SL, Reis HT, Impett E, Asher ER. What do you do when things go right? The intrapersonal and interpersonal benefits of sharing positive events. Journal of Personality and Social Psychology. 2004;87:228–245. doi: 10.1037/0022-3514.87.2.228. [DOI] [PubMed] [Google Scholar]
- Gallagher MW, Lopez SJ. Curiosity and well-being. Journal of Positive Psychology. 2007;2:236–248. [Google Scholar]
- Garner BA. The Oxford dictionary of American usage and style. New York: Oxford University Press; 2000. [Google Scholar]
- Goldenberg JL, Pyszczynski T, Greenberg J, Solomon S, Kluck B, Cornwell R. I am NOT an animal: Mortality salience, disgust, and the denial of human creatureliness. Journal of Experimental Psychology: General. 2001;130:427–435. doi: 10.1037//0096-3445.130.3.427. [DOI] [PubMed] [Google Scholar]
- Gratz KL, Roemer L. Multidimensional assessment of emotion regulation and dysregulation: Development, factor structure, and initial validation of the difficulties in emotion regulation scale. Journal of Psychopathology and Behavioral Assessment. 2004;26:41–54. [Google Scholar]
- Gratz KL, Rosenthal MZ, Tull MT, Lejuez CW, Gunderson JG. An experimental investigation of emotion dysregulation in borderline personality disorder. Journal of Abnormal Psychology. 2006;115:850–855. doi: 10.1037/0021-843X.115.4.850. [DOI] [PubMed] [Google Scholar]
- Gray-Little B, Williams VSL, Hancock TD. An item response theory analysis of the Rosenberg Self-Esteem Scale. Personality and Social Psychology Bulletin. 1997;23:443–451. [Google Scholar]
- Gross JJ, John OP. Facets of emotional expressivity: Three self-report factors and their correlates. Personality and Individual Differences. 1995;19:558–568. [Google Scholar]
- Gross JJ, John OP. Revealing feelings: Facets of emotional expressivity in self-reports, peer ratings, and behavior. Journal of Personality and Social Psychology. 1997;72:435–448. doi: 10.1037//0022-3514.72.2.435. [DOI] [PubMed] [Google Scholar]
- Gross JJ, John OP. Individual differences in two emotion regulation processes: Implications for affect, relationships, and well-being. Journal of Personality and Social Psychology. 2003;85:348–362. doi: 10.1037/0022-3514.85.2.348. [DOI] [PubMed] [Google Scholar]
- Harvey M, Novicevic M, Breland JW. Global dual-career exploration and the role of hope and curiosity during the process. Journal of Managerial Psychology. 2009;24:178–197. [Google Scholar]
- Hayes SC, Luoma J, Bond F, Masuda A, Lillis J. Acceptance and Commitment Therapy: Model, processes, and outcomes. Behaviour Research and Therapy. 2006;44:1–25. doi: 10.1016/j.brat.2005.06.006. [DOI] [PubMed] [Google Scholar]
- Hayes SC, Strosahl KD, Wilson KG, Bissett RT, Pistorello J, Toarmino D, Polusny MA, DykstraTABatten SV, Bergan J, Stewart SH, Zvolensky MJ, Eifert GH, Bond FW, Forsyth JP, Karekla M, McCurry SM. Measuring experiential avoidance: A preliminary test of a working model. The Psychological Record. 2004;54:553–578. [Google Scholar]
- Hu L, Bentler PM. Cutoff criteria for fit indexes in covariance structure analysis: Conventional criteria versus new alternatives. Structural Equation Modeling. 1999;6:1 –55. [Google Scholar]
- Izard CE. Human emotions. New York: Plenum; 1977. [Google Scholar]
- James W. Principles of psychology. New York: Holt; 1890. [Google Scholar]
- John OP, Srivastava S. The Big Five trait taxonomy: History, measurement, and theoretical perspectives. In: Pervin LA, John OP, editors. Handbook of personality: Theory and research. 2. New York: Guilford; 1999. pp. 102–138. [Google Scholar]
- Jöreskog KG, Sörbom D. LISREL 8: User’s reference guide. Chicago: Scientific Software International; 1996. [Google Scholar]
- Kashdan TB. Curiosity. In: Peterson C, Seligman MEP, editors. Character strengths and virtues: A handbook and classification. Washington, DC: American Psychological Association; 2004. pp. 125–141. [Google Scholar]
- Kashdan TB. Social anxiety spectrum and diminished positive experiences: Theoretical synthesis and meta-analysis. Clinical Psychology Review. 2007;27:348–365. doi: 10.1016/j.cpr.2006.12.003. [DOI] [PubMed] [Google Scholar]
- Kashdan TB. Curious? Discover the missing ingredient to a fulfilling life. New York, NY: William Morrow; 2009. [Google Scholar]
- Kashdan TB, Afram A, Brown KW. Without curiosity, mindful awareness often leads to defensive reactions to threatened worldviews: A quasi-experimental test of the two-component model of mindfulness. 2009 Manuscript in preparation. [Google Scholar]
- Kashdan TB, Roberts JE. Trait and state curiosity in the genesis of intimacy: Differentiation from related constructs. Journal of Social and Clinical Psychology. 2004;23:792–816. [Google Scholar]
- Kashdan TB, Rose P, Fincham FD. Curiosity and exploration: Facilitating positive subjective experiences and personal growth opportunities. Journal of Personality Assessment. 2004;82:291–305. doi: 10.1207/s15327752jpa8203_05. [DOI] [PubMed] [Google Scholar]
- Kashdan TB, Silvia PJ. Curiosity and interest: The benefits of thriving on novelty and challenge. In: Snyder CR, Lopez SJ, editors. Handbook of positive psychology. 2. New York: Oxford University Press; 2009. pp. 367–374. [Google Scholar]
- Kashdan TB, Steger MF. Curiosity and pathways to well-being and meaning in life: Traits, states, and everyday behaviors. Motivation and Emotion. 2007;31:159–173. [Google Scholar]
- Kashdan TB, Yuen M. Whether highly curious students thrive academically depends on perceptions about the school learning environment: A study of Hong Kong adolescents. Motivation and Emotion. 2007;31:260–270. [Google Scholar]
- Keyes CLM. Social well-being. Social Psychology Quarterly. 1998;61:121–140. [Google Scholar]
- Kline RB. Principles and practice of structural equation modeling. 2. New York: Guilford Press; 2004. [Google Scholar]
- Leherissey BL. The effects of stimulating state epistemic curiosity on state anxiety and performance in a complex computer-assisted learning task. Florida State University; 1971. Unpublished doctoral dissertation. [Google Scholar]
- Litman JA, Collins RP, Spielberger CD. The measurement of sensory curiosity. Personality and Individual Differences. 2005;39:1123–1133. [Google Scholar]
- Litman JA, Silvia PJ. The latent structure of trait curiosity: Evidence for interest and deprivation curiosity dimensions. Journal of Personality Assessment. 2006;86:318–328. doi: 10.1207/s15327752jpa8603_07. [DOI] [PubMed] [Google Scholar]
- Litman JA, Spielberger CD. Measuring epistemic curiosity and its diversive and specific components. Journal of Personality Assessment. 2003;80:75–86. doi: 10.1207/S15327752JPA8001_16. [DOI] [PubMed] [Google Scholar]
- Little TD, Cunningham WA, Shahar G, Widaman KF. To parcel or not to parcel: Exploring the question, weighing the merits. Structural Equation Modeling. 2002;9:151–173. [Google Scholar]
- Loewenstein G. The psychology of curiosity: A review and reinterpretation. Psychological Bulletin, 116. 1994;1:75–98. [Google Scholar]
- Lovibond SH, Lovibond PF. Manual for the Depression Anxiety Stress Scales. 2. Sydney: Psychology Foundation; 1995. [Google Scholar]
- Lucas RE, Diener E, Grob A, Suh EM, Shao L. Cross-cultural evidence for the fundamental features of extraversion. Journal of Personality and Social Psychology. 2000;79:452–468. doi: 10.1037//0022-3514.79.3.452. [DOI] [PubMed] [Google Scholar]
- Lucas RE, Le K, Dyrenforth PE. Explaining the extraversion/positive affect relation: Sociability cannot account for extraverts’ greater happiness. Journal of Personality. 2008;76:385–414. doi: 10.1111/j.1467-6494.2008.00490.x. [DOI] [PubMed] [Google Scholar]
- Lyubomirsky S, Lepper H. A measure of subjective happiness: Preliminary reliability and construct validation. Social Indicators Research. 1999;46:137–155. [Google Scholar]
- McCrae RR. Social consequences of experiential openness. Psychological Bulletin. 1996;120:323– 337. doi: 10.1037/0033-2909.120.3.323. [DOI] [PubMed] [Google Scholar]
- Morizot J, Ainsworth AT, Reise SP. Toward modern psychometrics: Application of item response theory models in personality research. In: Robins RW, Fraley RC, Krueger RF, editors. Handbook of research methods in personality psychology. New York: Guilford; 2007. pp. 407–423. [Google Scholar]
- Naylor FD. A state–trait curiosity inventory. Australian Psychologist. 1981;16:172–183. [Google Scholar]
- Ostini R, Nering ML. Polytomous item response theory models. Newbury Park, CA: Sage; 2006. (Sage University Paper Series on Quantitative Applications in the Social Sciences, series no. 07–144) [Google Scholar]
- Panksepp J. Seeking systems and anticipatory states of the nervous system. In: Panksepp J, editor. Affective neuroscience: The foundations of human and animal emotions. New York: Oxford University Press; 1998. pp. 144–163. [Google Scholar]
- Pearson PH. Relationships between global and specific measures of novelty seeking. Journal of Consulting and Clinical Psychology. 1970;34:199–204. [Google Scholar]
- Peterson C, Seligman MEP. Character strengths and virtues: A handbook and classification. Washington, DC: American Psychological Association; 2004. pp. 125–141. [Google Scholar]
- Peterson C, Ruch W, Beermann U, Park N, Seligman MEP. Strengths of character, orientations to happiness, and life satisfaction. Journal of Positive Psychology. 2007;2:149–156. [Google Scholar]
- Preacher KJ, Rucker DD, MacCallum RC, Nicewander WA. Use of the extreme groups approach: A critical reexamination and new recommendations. Psychological Methods. 2005;10:178–192. doi: 10.1037/1082-989X.10.2.178. [DOI] [PubMed] [Google Scholar]
- Reiss S. Who am I? The 16 basic desires that motivate our actions and define our personalities. New York: Tarcher/Putnum; 2000. [Google Scholar]
- Renninger KA, Hidi S, Krapp A. The role of interest in learning and development. Hillsdale, NJ: Erlbaum; 1992. [Google Scholar]
- Rodebaugh TL, Woods CM, Heimberg RG. The reverse of social anxiety is not always the opposite: The reverse-scored items of the Social Interaction Anxiety Scale do not belong. Behavior Therapy. 2007;38:192–206. doi: 10.1016/j.beth.2006.08.001. [DOI] [PubMed] [Google Scholar]
- Ryan RM, Deci EL. Self-determination theory and the facilitation of intrinsic motivation, social development, and well-being. American Psychologist. 2000;55:68–79. doi: 10.1037//0003-066x.55.1.68. [DOI] [PubMed] [Google Scholar]
- Ryff CD. Happiness is everything, or is it? Explorations on the meaning of psychological well- being. Journal of Personality and Social Psychology. 1989;57:1069–1081. [Google Scholar]
- Samejima F. Graded response model. In: van der Linden WJ, Hambleton RK, editors. Handbook of modern item response theory. New York: Springer; 1997. pp. 85–100. [Google Scholar]
- Silvia PJ. What is interesting? Exploring the appraisal structure of interest. Emotion. 2005;5:89–102. doi: 10.1037/1528-3542.5.1.89. [DOI] [PubMed] [Google Scholar]
- Silvia PJ. Exploring the psychology of interest. New York: Oxford University Press; 2006. [Google Scholar]
- Silvia PJ. Appraisal components and emotion traits: Examining the appraisal basis of trait curiosity. Cognition and Emotion. 2008;22:94–113. [Google Scholar]
- Skrondal A, Rabe-Hesketh S. Generalized latent variable modeling: Multilevel, longitudinal, and structural equation models. Boca Raton, FL: Chapman & Hall/CRC; 2004. [Google Scholar]
- Steiger JH, Lind J. Statistically based tests of the number of common factors. Paper presented at the annual meeting of the Psychometric Society; Iowa City, IA. 1980. May, [Google Scholar]
- Tomkins SS. The positive affects. Vol. 1. New York: Springer; 1962. Affect, imagery, consciousness. [Google Scholar]
- Watson D, Clark LA. Extraversion and its positive emotional core. In: Hogan R, Johnson J, Briggs S, editors. Handbook of personality psychology. San Diego, CA: Academic Press; 1997. pp. 767–793. [Google Scholar]
- Watson D, Clark LA, Tellegen A. Development and validation of brief measures of positive and negative affect: The PANAS scales. Journal of Personality and Social Psychology. 1988;54:1063–1070. doi: 10.1037//0022-3514.54.6.1063. [DOI] [PubMed] [Google Scholar]
- Williams L, Ford L, Nguyen N. Basic and advanced measurement models for confirmatory factor analysis. In: Rogelberg S, editor. Handbook of research methods in industrial and organizational psychology. Oxford, United Kingdom: Blackwell Publishers; 2002. pp. 366–389. [Google Scholar]
- Zuckerman M. Behavioral expressions and biosocial bases of sensation seeking. New York: Cambridge University Press; 1994. [Google Scholar]