

Abstract
Objective
To assess, among overweight non-Hispanic black adolescents the relationship of changes in plasma retinol binding protein 4 (RBP4) over three years to changes in insulin resistance (IR) and four associated cardiometabolic risks.
Design
Nested, retrospective study of 51 overweight, post-pubertal non-Hispanic black participants in the Princeton School District Study. Participants were in the top (worsening IR) or bottom (improved IR) quartile for 3-year change in IR. RBP4 was measured by quantitative western blot using frozen plasma. Regression analyses adjusted for age, gender, adiposity (baseline and change). Three measures of adiposity were assessed (waist circumference, BMI, weight) in separate regression models.
Results
RBP4 increased in one-third (N=17). In logistic regression analyses, increased RBP4 was associated with significantly higher odds of worsening as opposed to improved IR independent of age, gender, or adiposity. Odds ratios were 5.6 (weight, p=0.024), 6.0 (BMI, p=0.025) and 7.4 (waist circumference, p=0.015). Initial RBP4 (β=0.81,p=0.005) and Δ RBP4 (β=0.56, p=0.046) also predicted Δ triglycerides, but not Δ HDL-cholesterol, LDL-cholesterol or fibrinogen.
Conclusion
This retrospective cohort study provides evidence that RBP4 may be a mechanism through which obesity influences insulin resistance and hypertriglyceridemia in overweight post-pubertal black youth and suggests utility of RBP4 as a biomarker of risk.
Keywords: retinoids, insulin resistance, triglycerides, adolescents, obesity
Introduction
Obesity, a major public health problem today, is associated with insulin resistance at all stages of life. Both obesity and insulin resistance are important risk factors for serious morbidity such as Type 2 diabetes, cardiovascular disease, and death (1). To date, the physiologic mechanisms that link obesity, insulin resistance, and adverse outcomes remain unknown.
Retinol binding protein 4 (RBP4) was recently identified as a potential mediator of obesity-induced insulin resistance and metabolic risk. This protein was first described and characterized by Goodman and colleagues almost 40 years ago for its role in transporting retinol from storage sites in the liver to extrahepatic tissues(2, 3). Subsequently, RBP4 was found to also be secreted by adipocytes (4) and to be upregulated in adipose tissue and serum of insulin resistant humans (5). The elevated RBP4 levels have been found in adipose tissue but not in liver and elevated RBP4 levels in adipose tissue but not in liver have been reduced by improvements in metabolic status (5, 6). These findings suggest that adipocyte-secreted RBP4 may play an important role in systemic insulin action and metabolic homeostasis in insulin resistant states. Mouse studies are also consistent with the possibility that RBP4 could play a role in obesity-induced insulin resistance, as chronic elevation of RBP4 in mice increases hepatic glucose production, down-regulates insulin signaling in muscle and causes systemic insulin resistance(6). Furthermore, lowering elevated serum RBP4 levels in obese mice using a synthetic retinoid improves insulin sensitivity and normalizes glucose tolerance(6).
In the past few years, the literature on RBP4's relationship to insulin resistance and metabolic risk in humans has grown (7-12). Genetic studies in several populations suggest a causative role for RBP4 in insulin resistance and type 2 diabetes (13, 14). Although many studies support a role for RBP4 in obesity-induced insulin resistance and associated disease, some do not and important gaps in the field remain. Most human studies were performed in adult populations of Asian or Caucasian subjects. Few have assessed RBP4 in childhood or adolescence (8, 9, 12). None have studied non-Hispanic blacks, a high risk population.(15) In addition, RBP4 studies to date have been cross sectional or have involved short term interventions in clinic-based populations, making it difficult to draw conclusions regarding the long-term relationship between adiposity and RBP4.
To address these gaps in the literature, we used frozen plasma samples and data from the Princeton School District Study (2001-2004) to explore the longitudinal relationship of RBP4 to insulin resistance and metabolic risks in overweight non-Hispanic black adolescents(16). We focused on non-Hispanic blacks for three reasons: 1) data on the RBP4 insulin resistance relationship in this racial/ethnic group is lacking, 2) blacks are acknowledged to be at increased risk for obesity and its sequelae; and 3) racial and ethnic variance in the relative contributions of insulin sensitivity and pancreatic beta cell dysfunction in the development of type 2 diabetes may potentially confound the RBP4-IR relationship, making it difficult to study the RBP4-insulin resistance relationship in racially heterogeneous groups.. We hypothesized that increased plasma RBP4 over the three years of follow-up would be associated with worsening as opposed to improved insulin resistance over three years. Secondarily, we hypothesized that initial RBP4 and change in RBP4 levels would be associated with the magnitude of 3-year change of four other metabolic risk factors. These risk factors included traditional cardiovascular risks (triglycerides, HDL-cholesterol, and LDL-cholesterol), and a non-traditional cardiovascular risk factor (fibrinogen) associated with risk for atherosclerotic heart disease in young people (17).
Methods
Princeton School District Study
This study uses data that were previously collected from participants in the Princeton School District (PSD) Study during the 2001-2002 and 2004-2005 schools years. PSD Study participants were included in this study if the met the following inclusion criteria: 1) non-Hispanic black race/ethnicity 2) overweight (BMI-for-age>85%), 3) post-pubertal prior to enrollment in the PSD study, 4) seen at baseline (2001) and at a three year follow up visit with phlebotomy at each visit, 5) availability of a frozen plasma sample for RBP4 measurement, and 6) 3-year change in, insulin resistance in the top or bottom quartile for postpubertal black youth in the PSD Study. The latter inclusion criterion was used to allow us to compare those with worsening insulin resistance (top quartile of change) to those with improved insulin resistance (bottom quartile of change), and, therefore, facilitate testing of our primary hypothesis in this fixed sample. Fifty-one youth (39 females, 12 males; mean age at baseline = 15.4 yrs, SD1.5 yrs, range 12.9 - 18.2 years) met the inclusion criteria. Twenty-five had worsening insulin resistance and 26 improved insulin resistance.
Description of PSD Study Procedures and Measures
This study uses PSD Study data that were collected at baseline (2001) and at three years of follow up data (2004). Participants in the PSD Study provided written assent and a parent gave informed consent prior to entry into the study. Study visits occurred in the morning after a minimum 10 hour overnight fast which was verified. Height, weight, waist circumference, and a venipuncture were performed by trained study personnel as previously described(16, 18, 19). Body mass index (BMI, kg/m2) was calculated from measured height and weight(16). BMI z scores and percentiles were derived based on age and gender from the CDC 2000 growth chart standards. BMI-for-age percentiles were used to determine weight status by classifying participants as normal weight (BMI-for-age <85%) or overweight (BM-for-age I>=85%). Cardiometabolic risk factors assessed in the PSD Study included insulin, glucose, high density lipoprotein cholesterol (HDL-C), low density lipoprotein cholesterol (LDL), triglycerides, and fibrinogen, as previously described in detail.(20) Fasting insulin and glucose were used to calculate the homeostasis model of insulin resistance, (HOMA-IR) (21). HOMA-IR is a surrogate measure of insulin resistance which is frequently used in epidemiological studies. The measure is derived using the following formula: glucose(mMol) x insulin(mIU)] / 22.5].(21) Although euglycemic clamps are the gold standard for measurement of insulin resistance, it was not feasible to do clamps in the PSD Study, which was a large school-based epidemiologic study. The validity of surrogate markers of IR, including HOMA-IR, for use in such studies of children and youth is supported by a number of studies. (22-24)
RBP4 Measurement
Plasma stored at -70 degrees Celsius from the baseline and 3-year follow up visit was used to assay RBP4 for this study. Plasma RBP4 concentrations were calculated using a quantitative western blotting protocol as previously described.(25) This assay allows sample concentrations to be calculated against pre-prepared RBP4 standards of 15, 30, 60, and 120 μg/mL run on the same gel as the experimental samples. In this study, baseline and follow up assays were run in adjacent lanes within the same gel. Intra and inter-assay coefficient of variations were 9.1% and 17.2%, respectfully.
Statistical Analyses
All analyses were performed with SPSS for Windows.(26)
Primary Hypothesis testing
To test our primary hypothesis, contingency table analyses were performed between increased RBP4 and placement in the worsening versus improved insulin resistance groups. Next, we used logistic regression to assess if the relationships between increase in RBP4 and worsening insulin resistance remained robust after adjusting for baseline age, gender, and adiposity. We tested baseline levels and change over three years for three separate measures of adiposity—waist circumference, body mass index (BMI) and weight. These measures of adiposity were highly correlated (r=0.85 for weight and BMI to r=0.95 for waist circumference and BMI), and so could not be assessed together in a single model. Therefore each measure of adiposity modeled independently and the results of the three models are reported. We also assessed if an interaction between increase in RBP4 and gender existed. This gender interaction was not found.
Secondary Hypothesis testing
Multiple linear regression analyses were performed to determine the relationships between RBP4 and the magnitude of change in the four other metabolic risks adjusting for gender, age, and adiposity.
Post hoc Analyses
We preformed post hoc regression analyses among the pooled sample of 51 youth to further explore the association of RBP4 to change in insulin resistance using waist circumference as the measure of adiposity. These analyses assessed if the level of RBP4 (both initial level and 3-year change) predicted the amount of 3-year change in HOMA-IR. We found a significant interaction between initial RBP4 and change in RBP4 in these analyses. Inclusion of this interaction term increased multicolinearity to unacceptable levels, so variables were centered by subtracting the mean from each subject's individual value. This mathematical transformation alleviates structural multicollinearity by decreasing the correlation between variables. Although log transformation of initial RBP4 improved normality, results with untransformed initial RBP4 were similar. We, therefore, report the untransformed models because this allowed us to keep the units of the initial and change variables identical and because results with untransformed variables are easier to interpret.
Results
Table 1 shows the baseline characteristics of these 51 youth and changes over the three years. Two thirds (N=34) were obese at baseline and of these, 88% remained obese. Insulin resistance was high at baseline; 68.6% (N=35) had initial HOMA-IR above 4.39, the level which represented 2 standard deviations above the mean for normal-weight adolescents with normal fasting glucose in NHANES 1999-2002 (27).
Table 1.
Baseline characteristics of the study sample
| Total (N=51) |
Improved Insulin Resistance (N=26) |
Worsening Insulin Resistance (N=25) |
P value* |
|||||||
|---|---|---|---|---|---|---|---|---|---|---|
| N |
% |
N |
% |
N |
% |
|||||
| Female |
39 |
76.5 |
20 |
76.9 |
19 |
76.0 |
0.78 |
|||
| Obese |
37 |
66.7 |
18 |
69.2 |
16 |
64.0 |
0.69 |
|||
| Mean | SD | Median | Mean | SD | Median | Mean | SD | Median | ||
| Baseline Level | ||||||||||
| Waist circumference (cm) | 93.7 | 12.9 | 91.1 | 95.0 | 10.6 | 94.6 | 92.3 | 15.0 | 87.9 | 0.27 |
| BMI | 31.4 | 5.0 | 30.5 | 31.9 | 4.7 | 31.0 | 31.0 | 5.4 | 29.5 | 0.36 |
| Weight (kg) | 85.7 | 17.7 | 84.5 | 87.8 | 12.3 | 86.5 | 83.6 | 22.0 | 78.3 | 0.13 |
| Triglyceride (mg/dl) | 71.2 | 24.5 | 67.0 | 75.0 | 28.6 | 66.5 | 67.3 | 19.3 | 69.0 | 0.46 |
| HDL (mg/dl) | 43.6 | 9.9 | 42.0 | 43.7 | 9.5 | 42.5 | 43.6 | 10.4 | 40.0 | 0.73 |
| LDL (mg/dl) | 97.2 | 27.5 | 96.0 | 98.2 | 28.4 | 96.50 | 96.1 | 27.1 | 92.0 | 0.62 |
| Fibrinogen (mg/dl) | 422.3 | 100.8 | 413.5 | 422.4 | 103.0 | 409.8 | 422.2 | 100.6 | 413.5 | 0.98 |
| RBP4 (mcg/dl) | 51.5 | 19.2 | 47.0 | 50.2 | 16.9 | 44.9 | 52.8 | 21.6 | 52.9 | 0.82 |
| 3-year Change | ||||||||||
| Waist circumference (cm) | 6.6 | 7.6 | 7.0 | 4.3 | 8.3 | 6.6 | 8.9 | 6.2 | 9.4 | 0.08 |
| BMI | 2.1 | 3.1 | 2.3 | 1.2 | 3.2 | 2.1 | 3.0 | 2.7 | 3.7 | 0.048 |
| Weight (kg) | 6.7 | 8.8 | 7.6 | 4.3 | 9.0 | 6.5 | 9.2 | 8.2 | 10.0 | 0.11 |
| Triglyceride (mg/dl) | 2.8 | 30.9 | 3.0 | -6.5 | 32.2 | -7.0 | 12.4 | 26.9 | 9.0 | 0.023 |
| HDL (mg/dl) | 4.7 | 7.8 | 4.8 | 5.4 | 7.8 | 5.0 | 3.9 | 8.0 | 3.8 | 0.48 |
| LDL (mg/dl) | -7.7 | 15.7 | -5.0 | -7.8 | 11.2 | -6.5 | -7.5 | 19.6 | -4.0 | 0.70 |
| Fibrinogen (mg/dl) | 23.9 | 82.8 | 36.9 | 16.7 | 72.8 | 30.0 | 31.4 | 93.1 | 36.9 | 0.74 |
| RBP4 (mcg/dl) | -7.0 | 19.5 | -4.0 | -10.0 | 15.4 | -6.5 | -3.8 | 22.8 | -0.1 | 0.09 |
P value from Mann-Whitney U test for differences between improved and worsening insulin resistance groups.
Table 1 also provides descriptive information for the improved and worsening insulin resistance groups. As noted above, these groups were defined a priori as the top and bottom quartile of three year change in HOMA-IR for postpubertal non-Hispanic black participants the PSD Study. Three-year change in HOMA-IR for those with worsening insulin resistance ranged from +0.38 to +37.7 while three year change in HOMA-IR for those with improved insulin resistance ranged from -23.8 to -2.55. There were no gender differences of difference in the prevalence of obesity between the improved IR and worsening IR groups, nor were there differences between these groups in baseline RBP4, BMI, BMI z score, waist circumference, HDL-C, triglycerides, LDL-C, glucose or fibrinogen. However, initial HOMA-IR was higher in the improved insulin resistance group (Median = 8.0 improved IR vs 4.1 worsening IR, p<0.001). The greatest improvement in insulin resistance (-23.8 units) was seen in a 14.7 year old obese girl (initial BMI=33.1) with normal glucose levels throughout the study who had the highest initial HOMA-IR and who lost 14.4 kg over the three years. Although her weight loss lowered her BMI from the 98% to the 90% and her insulin resistance improved, her HOMA-IR remained high at 8.1.
Primary Hypothesis Testing: Relationship of Change in RBP4 to Change in Insulin Resistance
Although, on average, RBP4 levels decreased over the three years, RBP4 levels did increase in one-third of the subjects (N=17). Those in the worsening insulin resistance group were 2.4 times more likely to have RBP4 increase over the three years than those in the improved insulin resistance group. RBP4 increased in 48% of the worsening insulin resistant group compared to 19.6% in the improved insulin resistance group (p=0.029, online Figure). The association of increase in RBP4 to worsening insulin resistance was confirmed in the logistic regression analyses which adjusted for gender, baseline age, initial adiposity, and change in adiposity (Table 2). For those in whom RBP4 increased over the three years, adjusted odds of worsening as opposed to improved insulin resistance was 5.6 (p=0.025) for the model using weight as the adiposity measure, 6.0 (p=0.024) for the BMI model, and 7.4 for the waist circumference model (p=0.015). Increased adiposity was also associated with worsening insulin resistance in all three models.
Table 2.
Logistic Regression Analyses: Increases in RBP4 Predict Progressive Insulin Resistance Independent of Adiposity
| Waist Circumference Model |
BMI Model |
Weight Model |
||||||||||
|---|---|---|---|---|---|---|---|---|---|---|---|---|
| Odds Ratio |
95% Confidence Interval |
P Value |
Odds Ratio |
95% Confidence Interval |
P Value |
Odds Ratio |
95% Confidence Interval |
P Value |
||||
| Lower | Upper | Lower | Upper | Lower | Upper | |||||||
| Baseline age | 0.75 | .47 | 1.2 | 0.21 | 0.90 | .57 | 1.4 | 0.66 | .97 | .62 | 1.5 | 0.91 |
| Female | 0.75 | .17 | 3.3 | 0.70 | 1.5 | .32 | 6.7 | 0.62 | 1.0 | .20 | 5.2 | 0.98 |
| Baseline adiposity | 0.94 | 0.88 | 1.0 | 0.053 | 0.88 | .76 | 1.0 | 0.096 | .96 | .92 | 1.0 | 0.095 |
| Change in adiposity | 1.2 | 1.00 | 1.3 | 0.013 | 1.4 | 1.0 | 1.8 | 0.025 | 1.1 | 1.0 | 1.2 | 0.031 |
| Increase in RBP4 | 7.4 | 1.5 | 37.0 | 0.015 | 6.0 | 1.2 | 28.5 | 0.025 | 5.6 | 1.2 | 25.0 | 0.024 |
Secondary Hypotheses Testing
Descriptive information of the changes over three years in the four metabolic risks is also found in Table 1. Multivariable regression analyses (Table 3) revealed that both higher initial RBP4 and rising RBP4 predicted 3-year change in triglycerides but not in change in HDL, LDL, or fibrinogen.
Table 3.
Regression analyses: RBP4's role in changes in metabolic risks over three years
| 3 year change in metabolic risk |
||||||||
|---|---|---|---|---|---|---|---|---|
| Triglycerides | HDL | LDL | Fibrinogen | |||||
| All models adjust for gender, baseline age, initial adiposity and change in adiposity over the three years. | ||||||||
| Waist Circumference Models | ||||||||
| B | SE | B | SE | B | SE | B | SE | |
| Initial RBP4 | .81** | .27 | .03 | .06 | .14 | .16 | .50 | .71 |
|
RBP4 |
.56* |
.27 |
.08 |
.06 |
.10 |
.16 |
.59 |
.70 |
| Model adj R2 | .278 | .288 | -.10 | .230 | ||||
| F statistic/sig F |
2.82 |
.02 |
4.38 |
3.49 |
.27 |
.95 |
3.49 |
.007 |
| BMI Models | ||||||||
| Initial RBP4 | .79** | .26 | .05 | .06 | .14 | .16 | .32 | .65 |
|
RBP4 |
.57* |
.26 |
.09 |
.06 |
.11 |
.06 |
.60 |
.66 |
| Model adj R2 | .219 | .275 | -.009 | .305 | ||||
| F statistic/sig F |
3.34 |
.008 |
4.15 |
.002 |
.27 |
.95 |
4.66 |
.001 |
| Weight Models | ||||||||
| Initial RBP4 | .79* | .27 | .06 | .06 | .14 | .16 | .15 | .72 |
|
RBP4 |
.54+ |
.27 |
.08 |
.06 |
.17 |
.16 |
.44 |
.72 |
| Model adj R2 | .283 | .253 | -.098 | .279 | ||||
| F statistic/sig F | 2.89 | .018 | 3.82 | .004 | .26 | .95 | 2.84 | .020 |
0.01<p<0.05
0.001<p≤0.01
p≤0.001 +p=0.051. Δ=3-year change. B = parameter estimate. SE=standard error.
Post hoc analyses
Although bivariate analyses (Table 1) had not demonstrated a relationship between magnitude of change in RBP4 and worsening insulin resistance, in post-hoc multivariable regression analyses, both greater initial RBP4 (β=0.20, p=0.02) and rising RBP4 (β=.43, p<.001) predicted level of HOMA-IR change independent of gender, age, and adiposity. This finding suggests that changes in adiposity, which were not adjusted for in bivariate analyses, may have masked the direct association of changes in RBP4 to changes in HOM-IR. In addition, our analyses revealed an interaction between initial RBP4 and 3-year change (β=-0.009, p=0.002) which suggested that the effect of change in RBP4 on HOMA-IR lessened with higher initial RBP4. Figure 1 presents this interaction graphically. As shown in Panel A, change in RBP4 does not correlate with change in HOMA-IR if the influence of initial RBP4 is not taken into account (r=0.008, p=0.96). However, as shown in Panel B, once the influence of initial RBP4 is taken into account by stratification into initial RBP4 tertiles, a significant correlation is seen for those whose initial RBP4 concentration was in the lower two tertiles (r=0.43, p=0.01). For those whose initial RBP4 was in the top tertile, no association was found between change in RBP4 and change in HOMA-IR (p=.24). This interaction suggests a ceiling effect above which change in RBP4, whether an increase or decrease, does not influence change in HOMA-IR in black adolescents.
Figure 1.
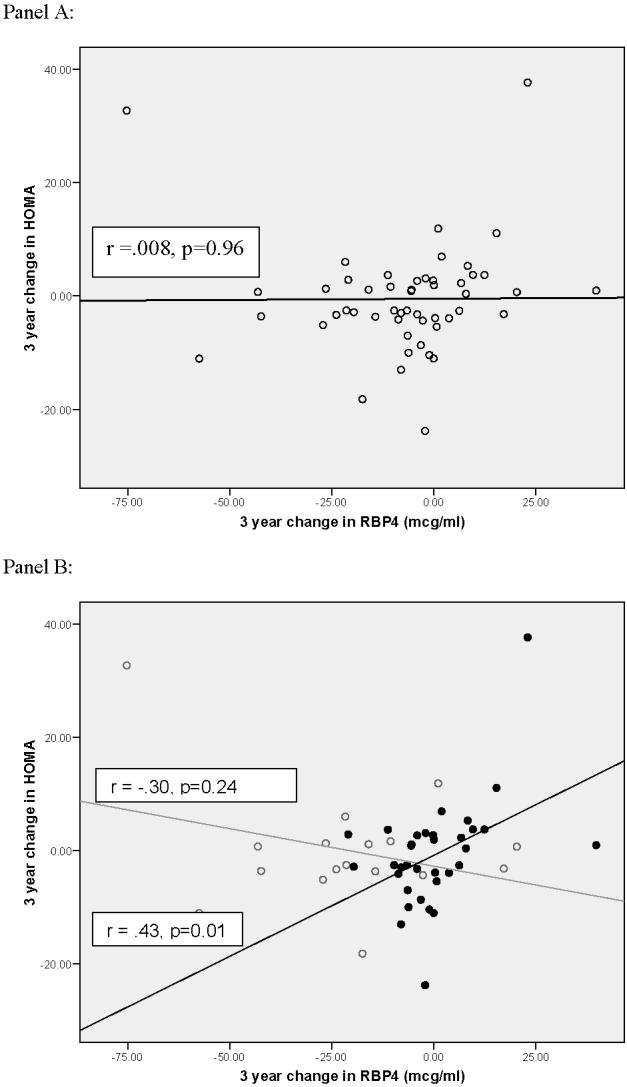
Influence of change in RBP4 on change in HOMA-IR is dependent on initial RBP4 level in overweight black youth. Panel A=Relationship of change in RBP4 to change in HOMA-IR without adjusting for the influence of initial RBP4 level. Panel B= Relationship of change in RBP4 to change in HOMA-IR adjusting for the influence of initial RBP4 concentration by stratification into initial RBP4 tertiles. Grey line, open circle= High baseline RBP4 (top tertile initial RBP4 concentration). Black line, closed circle = Lower initial RBP4 (bottom two tertiles of initial RBP4 concentration
Discussion
Obesity is an important health problem worldwide and the costs of obesity-related illnesses are a growing concern for the health care system and the United States economy. However, despite the well established relationship between obesity and disease throughout life, the mechanisms underlying the links between obesity and prominent illnesses such as Type 2 diabetes and cardiovascular disease remain elusive. This study provides evidence that RBP4 may be one such mechanism. Using a nested retrospective cohort design, we demonstrate that increase in RBP4 is associated with worsening insulin resistance over three years in overweight non-Hispanic postpubertal black youth and that the effect of change in RBP4 on insulin resistance may be dependent on the initial RBP4 level. We also show that both initial RBP4 concentration and change in RBP4 predict change in triglycerides, a prominent metabolic risk factor and feature of insulin resistance among youth. Triglycerides are more closely associated with insulin resistance than the other biomarkers assessed herein, particularly among overweight individuals with high central adiposity (hypertriglyceridemic waist phenotype). Among diabetic children and youth, triglycerides were more closely associated with insulin sensitivity than either HDL-cholesterol or LDL cholesterol (28) This may explain why our study did not demonstrate a relationship between RBP4 and changes in LDL-C, HDL-C and fibrinogen, which are other indices of vascular risk.
These findings are consistent with the theory that RBP4 may play an etiologic role in the relationship of adiposity to insulin resistance and associated metabolic risk in overweight youth. They have two implications for clinical care of adolescents and young adults. First, they suggest that measurement of RBP4 may aid in distinguishing overweight youth at risk for worsening of insulin resistance and metabolic dysregulation from those who are more likely to remain metabolically normal independent of changes in adiposity. Because RBP4 can be measured in a non-fasted state and is not subject to rapid changes in concentration in response to mild infection or inflammation, it may prove to be a useful biomarker among adolescents. Previous work among middle age and older Chinese adults suggests some utility for this protein as a biomarker in adults(13) However, additional studies are needed, especially among other racial/ethnic groups and over longer follow-up periods into adulthood, in order to determine the utility of RBP4 in predicting metabolic risk, impaired glucose tolerance and type 2 diabetes in young people. Second, the findings suggest that baseline RBP4 values may be an important covariate which could influence efficacy of therapeutic interventions aimed at reducing insulin resistance and its associated diseases in postpubertal, overweight black youth. For example, future studies should explore the efficacy of lifestyle interventions and the effect of such interventions on RBP4. Indeed, one such trial demonstrated efficacy of regular physical activity combined with dietary modifications in lowering RBP4 and increasing insulin sensitivity among shite children (8). This may be relevant to human trials of pharmacotherapeutic agents, such as fenretinide, a synthetic retinoid, which have been proposed to test the effectiveness of lowering RBP4 to prevent Type 2 diabetes(6) so that such trials, if mounted, could be properly targeted and evaluated.
Since 2005, the literature on RBP4's role in metabolic risk has grown. In some studies, RBP4 levels have been shown to correlate strongly with the quantity of visceral adiposity,(5, 29) to be elevated in obese as compared to lean individuals,(7-9, 12) and to be higher in individuals with impaired glucose tolerance/type 2 diabetes and dyslipidemia and cardiovascular risk factor clustering(11). Short term intervention trials have shown that decreased RBP4 is associated with improved indices of insulin resistance, improved lipid profiles, and reduced indices of subclinical inflammation in several different groups (30). However, not all studies have confirmed these associations (31-33). Some of the discrepancies across studies, most of which were conducted in adult populations, may reflect heterogeneity in the performance of different assays for measuring RBP4 in insulin resistant subjects(25) and potential racial/ethnic differences in the relationship between RBP4 and insulin resistance. With regard to adolescents, our study is consistent with Balagopal et al's finding that RBP4 levels correlate with insulin resistance in Caucasian overweight youth(8), as well as and findings by Lee et al, (9) which suggest an association between RBP4, insulin resistance, and triglycerides levels in Asian youth.
This study has several limitations. First, there were more females than males in the cohort, which limited our power to show gender differences. Such differences have been shown in some but not all RBP4 studies. Second, to date, there is no universally accepted method for measuring RBP4. As noted above, differences in measurement methodology may account for some of the discrepancies in findings across studies. We used Western blot methodology, which has been suggested to be a “gold standard” for measuring elevated RBP4 levels in insulin resistant subjects(25). The intergel coefficient of variation was larger than in previous studies, which may have decreased our ability to show an effect of baseline RBP4 on the vascular risks. However, the change in RBP4 over 3 years, our primary interest in this longitudinal study, was not affected by intergel variation because the two samples for each participant were run side by side on the same gel. Assays are currently under development which could improve the feasibility of using RBP4 as a biomarker and may aid in measurement standardization.
In conclusion, this retrospective study of overweight postpubertal black youth demonstrated that increase in RBP4 over three years was associated with increased odds of worsening as opposed to improved insulin resistance. Further, we demonstrated relationships between both initial plasma RBP4 level and 3-year change in RBP4 with changes in plasma triglycerides but not HDL-cholesterol, LDL-cholesterol, or fibrinogen concentrations. The relationships between RBP4 and HOMA-IR and triglycerides were independent of changes in adiposity. The RBP4 interaction we demonstrated in post-hoc analyses suggests a ceiling effect for RBP4's influence on HOMA-IR among overweight postpubertal black youth which may have clinical implications and requires further research in ethnically diverse populations and in different age groups. Further research is also required to determine if RBP4 will be a useful biomarker of risk in this age group.
Supplementary Material
Acknowledgements
The authors thank Mark S. Gilthorpe, PhD, for statistical advice.
Funding Support: Supported by NIH grants HD41527, DK59183, DK43051, DK69624 and M01RR 08084.
Abbreviations
- RBP4
retinol binding protein 4
- Δ
change in
- HDL
high density lipoprotein
- LDL
low density lipoprotein
- IR
insulin resistance
- BMI
body mass index
- HOMAIR
homeostasis model of insulin resistance
Footnotes
Disclosures: BBK is the recipient of a research grant from Takeda Pharmaceutical Company, consultant to Wyeth and Boehringer Ingelheim and on the speakers bureau for Merck. SRD is a consultant to Abbott and Schering-Plough. BBK and TEG are inventors on patent applications related to RBP4.
References
- 1.DeFronzo RA, Ferrannini E. Insulin resistance. A multifaceted syndrome responsible for NIDDM, obesity, hypertension, dyslipidemia, and atherosclerotic cardiovascular disease. Diabetes Care. 1991;14:173–94. doi: 10.2337/diacare.14.3.173. [DOI] [PubMed] [Google Scholar]
- 2.Kanai M, Raz A, Goodman DS. Retinol-binding protein: the transport protein for vitamin A in human plasma. J Clin Invest. 1968;47:2025–44. doi: 10.1172/JCI105889. [DOI] [PMC free article] [PubMed] [Google Scholar]
- 3.Goodman DS. Plasma retinol-binding protein. Ann N Y Acad Sci. 1980;348:378–90. doi: 10.1111/j.1749-6632.1980.tb21314.x. [DOI] [PubMed] [Google Scholar]
- 4.Tsutsumi C, Okuno M, Tannous L, Piantedosi R, Allan M, Goodman DS, et al. Retinoids and retinoid-binding protein expression in rat adipocytes. J Biol Chem. 1992;267:1805–10. [PubMed] [Google Scholar]
- 5.Kloting N, Graham TE, Berndt J, Kralisch S, Kovacs P, Wason CJ, et al. Serum retinol-binding protein is more highly expressed in visceral than in subcutaneous adipose tissue and is a marker of intra-abdominal fat mass. Cell Metab. 2007;6:79–87. doi: 10.1016/j.cmet.2007.06.002. [DOI] [PubMed] [Google Scholar]
- 6.Yang Q, Graham TE, Mody N, Preitner F, Peroni OD, Zabolotny JM, et al. Serum retinol binding protein 4 contributes to insulin resistance in obesity and type 2 diabetes. Nature. 2005;436:356–62. doi: 10.1038/nature03711. [DOI] [PubMed] [Google Scholar]
- 7.Graham TE, Yang Q, Bluher M, Hammarstedt A, Ciaraldi TP, Henry RR, et al. Retinol-binding protein 4 and insulin resistance in lean, obese, and diabetic subjects. N Engl J Med. 2006;354:2552–63. doi: 10.1056/NEJMoa054862. [DOI] [PubMed] [Google Scholar]
- 8.Balagopal P, Graham TE, Kahn BB, Altomare A, Funanage V, George D. Reduction of elevated serum retinol binding protein in obese children by lifestyle intervention: association with subclinical inflammation. J Clin Endocrinol Metab. 2007;92:1971–4. doi: 10.1210/jc.2006-2712. [DOI] [PubMed] [Google Scholar]
- 9.Lee DC, Lee JW, Im JA. Association of serum retinol binding protein 4 and insulin resistance in apparently healthy adolescents. Metabolism. 2007;56:327–31. doi: 10.1016/j.metabol.2006.10.011. [DOI] [PubMed] [Google Scholar]
- 10.Takebayashi K, Suetsugu M, Wakabayashi S, Aso Y, Inukai T. Retinol binding protein-4 levels and clinical features of type 2 diabetes patients. J Clin Endocrinol Metab. 2007;92:2712–9. doi: 10.1210/jc.2006-1249. [DOI] [PubMed] [Google Scholar]
- 11.Qi Q, Yu Z, Ye X, Zhao F, Huang P, Hu FB, et al. Elevated Retinol-Binding Protein 4 Levels are Associated with Metabolic Syndrome in Chinese People. J Clin Endocrinol Metab. 2007;92:4827–34. doi: 10.1210/jc.2007-1219. [DOI] [PubMed] [Google Scholar]
- 12.Aeberli I, Biebinger R, Lehmann R, l'Allemand D, Spinas GA, Zimmermann MB. Serum retinol-binding protein 4 concentration and its ratio to serum retinol are associated with obesity and metabolic syndrome components in children. J Clin Endocrinol Metab. 2007;92:4359–65. doi: 10.1210/jc.2007-0468. [DOI] [PubMed] [Google Scholar]
- 13.Craig RL, Chu WS, Elbein SC. Retinol binding protein 4 as a candidate gene for type 2 diabetes and prediabetic intermediate traits. Mol Genet Metab. 2007;90(3):338–44. doi: 10.1016/j.ymgme.2006.11.003. [DOI] [PMC free article] [PubMed] [Google Scholar]
- 14.Kovacs P, Geyer M, Berndt J, Kloting N, Graham TE, Bottcher Y, et al. Effects of Genetic Variation in the Human Retinol Binding Protein-4 Gene (RBP4) on Insulin Resistance and Fat Depot Specific mRNA Expression. Diabetes. 2007;65:3095–3100. doi: 10.2337/db06-1647. [DOI] [PubMed] [Google Scholar]
- 15.The Writing Group for the Search for Diabetes in Youth Study Writing Group Incidence of Diabetes in Youth in the United States. JAMA: The Journal of the American Medical Association. 2007;297:2716–24. doi: 10.1001/jama.297.24.2716. [DOI] [PubMed] [Google Scholar]
- 16.Goodman E, Daniels SR, Dolan LM. Socioeconomic disparities in insulin resistance: results from the Princeton School District Study. Psychosom Med. 2007;69:61–7. doi: 10.1097/01.psy.0000249732.96753.8f. [DOI] [PubMed] [Google Scholar]
- 17.Folsom AR, Qamhieh HT, Flack JM, Hilner JE, Liu K, Howard BV, et al. Plasma fibrinogen: levels and correlates in young adults. The Coronary Artery Risk Development in Young Adults (CARDIA) Study. American Journal of Epidemiology. 1993;138:1023–36. doi: 10.1093/oxfordjournals.aje.a116821. [DOI] [PubMed] [Google Scholar]
- 18.Goodman E, Adler NE, Daniels SR, Morrison JA, Slap GB, Dolan LM. Impact of Objective and Subjective Social Status on Obesity in a Biracial Cohort of Adolescents. Obes Res. 2003;11:1018–26. doi: 10.1038/oby.2003.140. [DOI] [PubMed] [Google Scholar]
- 19.Goodman E, McEwen BS, Huang B, Dolan LM, Adler NE. Social inequalities in biomarkers of cardiovascular risk in adolescence. Psychosom Med. 2005;67:9–15. doi: 10.1097/01.psy.0000149254.36133.1a. [DOI] [PubMed] [Google Scholar]
- 20.Goodman E, Daniels SR, Morrison JA, Huang B, Dolan LM. Contrasting prevalence of and demographic disparities in the World Health Organization and National Cholesterol Education Program Adult Treatment Panel III definitions of metabolic syndrome among adolescents. J Pediatr. 2004;145:445–51. doi: 10.1016/j.jpeds.2004.04.059. [DOI] [PubMed] [Google Scholar]
- 21.Matthews DR, Hosker JP, Rudenski AS, Naylor BA, Treacher DF, Turner RC. Homeostasis model assessment: insulin resistance and beta-cell function from fasting plasma glucose and insulin concentrations in man. Diabetologia. 1985;28:412–9. doi: 10.1007/BF00280883. [DOI] [PubMed] [Google Scholar]
- 22.Gungor N, Saad R, Janosky J, Arslanian S. Validation of surrogate estimates of insulin sensitivity and insulin secretion in children and adolescents. J Pediatr. 2004;144:47–55. doi: 10.1016/j.jpeds.2003.09.045. [DOI] [PubMed] [Google Scholar]
- 23.Keskin M, Kurtoglu S, Kendirci M, Atabek ME, Yazici C. Homeostasis model assessment is more reliable than the fasting glucose/insulin ratio and quantitative insulin sensitivity check index for assessing insulin resistance among obese children and adolescents. Pediatrics. 2005;115:e500–3. doi: 10.1542/peds.2004-1921. [DOI] [PubMed] [Google Scholar]
- 24.Uwaifo GI, Fallon EM, Chin J, Elberg J, Parikh SJ, Yanovski JA. Indices of insulin action, disposal, and secretion derived from fasting samples and clamps in normal glucose-tolerant black and white children. Diabetes Care. 2002;25:2081–7. doi: 10.2337/diacare.25.11.2081. [DOI] [PubMed] [Google Scholar]
- 25.Graham TE, Wason CJ, Bluher M, Kahn BB. Shortcomings in methodology complicate measurements of serum retinol binding protein (RBP4) in insulin-resistant human subjects. Diabetologia. 2007;50:814–23. doi: 10.1007/s00125-006-0557-0. [DOI] [PubMed] [Google Scholar]
- 26.SPSS . SPSS Base 10.0 User's Guide. SPSS, Inc; Chicago: 1999. [Google Scholar]
- 27.Lee JM, Okumura MJ, Davis MM, Herman WH, Gurney JG. Prevalence and determinants of insulin resistance among U.S. adolescents: a population-based study. Diabetes Care. 2006;29:2427–32. doi: 10.2337/dc06-0709. [DOI] [PubMed] [Google Scholar]
- 28.Szadkowska A, Pietrzak I, Mianowska B, Bodalska-Lipiska J, Keenan HA, Toporowska-Kowalska E, Mynarski W, Bodalski J. Insulin sensitivity in Type 1 diabetic children and adolescents. Diabetic Medicine. 2008;25:282–288. doi: 10.1111/j.1464-5491.2007.02357.x. [DOI] [PubMed] [Google Scholar]
- 29.Jia W, Wu H, Bao Y, Wang C, Lu J, Zhu J, et al. Association of serum retinol-binding protein 4 and visceral adiposity in Chinese subjects with and without type 2 diabetes. J Clin Endocrinol Metab. 2007;92:3224–9. doi: 10.1210/jc.2007-0209. [DOI] [PubMed] [Google Scholar]
- 30.Haider DG, Schindler K, Prager G, Bohdjalian A, Luger A, Wolzt M, et al. Serum retinol-binding protein 4 is reduced after weight loss in morbidly obese subjects. J Clin Endocrinol Metab. 2007;92:1168–71. doi: 10.1210/jc.2006-1839. [DOI] [PubMed] [Google Scholar]
- 31.Yao-Borengasser A, Varma V, Bodles AM, Rasouli N, Phanavanh B, Lee MJ, et al. Retinol binding protein 4 expression in humans: relationship to insulin resistance, inflammation, and response to pioglitazone. J Clin Endocrinol Metab. 2007;92:2590–7. doi: 10.1210/jc.2006-0816. [DOI] [PMC free article] [PubMed] [Google Scholar]
- 32.Takashima N, Tomoike H, Iwai N. Retinol-binding protein 4 and insulin resistance. N Engl J Med. 2006;355(13):1392. doi: 10.1056/NEJMc061863. [DOI] [PubMed] [Google Scholar]
- 33.Erikstrup C, Mortensen OH, Pedersen BK. Retinol-binding protein 4 and insulin resistance. N Engl J Med. 2006;355:1393–4. [PubMed] [Google Scholar]
Associated Data
This section collects any data citations, data availability statements, or supplementary materials included in this article.