

Abstract
Effector (Teff) and regulatory (Treg) T cells produce cytokines that balance immunity and immunopathology at sites of infection. It is not known how this balance is achieved. Here, we show that Treg and Teff cells specific for the same foreign peptide:major histocompatibility complex II (pMHCII) ligand accumulated preferentially in a subcutaneous site injected with the relevant antigen plus an adjuvant. Some of the Treg cells in this site were producing IL-10 twelve days after injection while a similar fraction of the Teff cells were producing IFN-γ. Acute ablation of Treg cells increased the fraction of IFN-γ-producing Teff cells, indicating that Teff function was limited by the Treg cells. Production of cytokines by both populations was driven by pMHCII presentation by local CD11bhigh dermal dendritic cells. Therefore, balanced production of microbicidal and suppressive cytokines in inflamed skin is achieved by simultaneous dendritic cell antigen presentation to Teff and Treg cells.
Cell-mediated immunity is required for the effective elimination of viruses, intracellular bacteria, parasites, and tumors. This response is initiated in secondary lymphoid tissue where naive CD4+ T cells are stimulated by foreign peptide:major histocompatibility complex II (pMHCII) ligands on dendritic antigen-presenting cells (APC) to proliferate and differentiate into effector cells (Teff cells). Teff cells express new homing receptors, which facilitate their migration into the non-lymphoid tissue containing the antigen (Campbell and Butcher, 2002; Masopust et al., 2001; Mora et al., 2003; Reinhardt et al., 2001). Once in this location, Teff cells produce lymphokines such as IFN-γ or IL-4 that activate other local immune cells to control or eliminate the foreign material (Dalton et al., 1993; Gordon, 2003).
The stimulus for cytokine production by Teff cells in non-lymphoid tissues is not known. Teff cells may continue to produce lymphokines in non-lymphoid tissues in a TCR-independent fashion as a consequence of earlier stimulation in the secondary lymphoid organs. Alternatively, cytokines present in inflamed non-lymphoid tissues may be sufficient to induce Teff production of lymphokines. Indeed, it has been shown in vitro that IL-12 and IL-18 are capable of sustaining or inducing IFN-γ production independent of TCR stimulation (Yang et al., 1999; Yoshimoto et al., 1998).
Alternatively, lymphokine production by Teff cells in the non-lymphoid tissue may require antigen presentation in that location. Dendritic cells (DC) present antigens from certain parasites and viruses to Teff cells in skin (Lemos et al., 2004; Wakim et al., 2008). Thus, DC may be responsible not only for antigen presentation to naïve T cells in secondary lymphoid organs but also Teff cells in the non-lymphoid tissue. However, many DC leave inflamed non-lymphoid tissue and migrate to the draining lymph node, suggesting that inflamed tissues may be depleted of DC. Thus, it is possible that macrophages and granulocytes, which can express MHCII and enter sites of inflammation may be involved in antigen presentation in these locations (Bryant and Ploegh, 2004; Shi, 2004; Vincent-Schneider et al., 2001).
Regulatory T cells (Treg), defined by expression of the forkhead box P3 (Foxp3) transcription factor (Fontenot et al., 2005; Hori et al., 2003), also accumulate in inflamed tissues containing foreign antigen (Suffia et al., 2006). During Leishmania infection, Treg cells balance the potentially tissue-damaging effects of microbicidal lymphokines produced by Teff cells, in this case contributing to the persistence of the pathogen and concomitant immunity (Belkaid, 2007; Belkaid et al., 2002). Treg cells produce IL-10 in non-lymphoid tissues, which is important for their suppressive function based on findings that mice containing IL-10-deficient Treg cells develop autoimmunity (Annacker et al., 2003; Asseman et al., 1999; Rubtsov et al., 2008).
The origin and specificity of the Treg cells that accumulate in inflamed nonlymphiod tissues is unclear. So-called naturally-occurring Treg cells have been shown to arise in the thymus (Tang and Bluestone, 2008), perhaps as a consequence of self pMHCII-specificity. Alternatively, Treg cells can differentiate from foreign pMHCII-specific conventional naive precursors in response to persistent antigen exposure (Knoechel et al., 2005; Kretschmer et al., 2005; Sun et al., 2007; Thorstenson and Khoruts, 2001). Thus, it is possible that the Treg cells that accumulate in non-lymphoid sites of infection are induced Treg cells specific for microbial pMHCII complexes or naturally-occurring Treg cells specific for self pMHCII complexes. In either case, it is not clear which type of APC presents the relevant complexes to Treg cells in non-lymphoid tissues or even if such presentation is a requirement for Treg cell function. In addition, it is not clear that the constant presence of Treg cells is required in antigen-containing tissues to dampen inflammatory cytokine production by antigen-specific Teff cells.
Here, we addressed these issues using a model in which antigen-specific CD4+ T cells and the relevant pMHCII complex could be tracked under conditions of antigen persistence and inflammation. We report that Teff cells and induced Treg cells with the identical foreign pMHCII specificity accumulated preferentially in an inflamed subcutaneous site containing the relevant antigen. The Teff and Treg cells in this site produced IFN-γ and IL-10, respectively, at a time when neither was producing lymphokines in the draining lymph nodes. Both populations ceased lymphokine production in injection sites rapidly after blockade of the relevant pMHCII ligand or ablation of DCs. Phenotypic and pMHCII detection analyses revealed that dermal DCs were responsible for antigen presentation at the injection site. Acute ablation of the Treg population resulted in increased production of IFN-γ by the Teff cells. Thus, Teff and Treg cells derived from the same naïve precursor pool accumulated and produced cytokines in an inflamed non-lymphoid site containing antigen in response continuous local antigen presentation by dermal DCs. Focus on the same APCs may allow Treg cells to efficiently dampen cytokine production by Teff cells in non-lymphoid tissues.
RESULTS
Subcutaneous injection of incomplete Freund's adjuvant (IFA) was chosen to produce a long-term local site of inflammation to mimic a chronic infection. Mice were injected in one ear with a foreign antigen in IFA and with IFA alone or an unrelated antigen in IFA in the other ear. This strategy allowed for the visualization of Teff and Treg cells at an inflamed site containing the antigen of interest and an inflamed control site lacking the antigen on the same mouse. In this way, comparisons about the state of each cell type in the presence or absence of antigen could be ascertained under conditions of similar inflammation.
CD4+ T cell effector function requires the presence of antigen in non-lymphoid tissue
An adoptive transfer system was used to define the role of local antigen presentation on CD4+ T cell effector function in non-lymphoid tissue. The TEa TCR transgenic mouse specific for the Eα52-68 peptide (pEα) derived from the MHCII I-Edα chain (Grubin et al., 1997) was used as a source of T cells. A recombinant protein containing pEα fused to DsRED (EαRFP) was used as the antigen (Itano et al., 2003). The major advantage of this approach was that pEα:I-Ab complexes could be detected and blocked using the pEα:I-Ab-specific Y-Ae monoclonal antibody (Murphy et al., 1992; Rudensky et al., 1991) and antigen uptake could be visualized based on the inherent red fluorescence of RFP.
Initial experiments involved assessment of the kinetics of total CD4+ T cell accumulation at the antigen injection site. One million CFSE-labeled CD90.1+ RAG-deficient TEa T cells were injected into CD90.2+ C57BL/6 (B6) mice, which were then injected intradermally in one ear with EαRFP in IFA and in the other ear with OVA in IFA. TEa CD4+ T cells were present in an undivided state in the lymph nodes of mice before antigen injection (Figure S1A and B, left panels) and were completely absent in the ear tissue (data not shown). Twelve days after antigen injection, the TEa cells in the lymph nodes draining the EαRFP/IFA-injected ear increased in number and displayed a heterogeneous pattern of cell division (Figure S1A and B, middle panels). TEa cells also appeared in the EαRFP/IFA injection site at this time and showed evidence of at least 6 cell divisions (Figure S1A and B, right panels), confirming earlier work that the most divided T cells migrate to sites of antigen deposition (Reinhardt et al., 2003; Roman et al., 2002). TEa T cells entered both ears at nearly the same rate for the first 6 days but then continued to increase in the EαRFP/IFA injection site to a peak on day 12 while leveling off at a 4-fold lower level in the OVA/IFA injection site (Figure 1A). The TEa cells at both sites then decreased steadily after day 12, eventually falling to very low levels by day 25. TEa cells in the EαRFP/IFA injection site had elevated amounts of the activation markers CD69 and CD25 throughout the time course compared to the TEa cells in the OVA/IFA-injected ear (Figure 1B).
Figure 1. Antigen-specific CD4+ T cell accumulation and activation at sites of antigen injection.

B6 recipients of TEa T cells were injected with EαRFP/IFA in one ear and OVA/IFA in the other. (A) Mean number ± SD (n=2/timepoint) of TEa T cells in the EαRFP/IFA (closed squares) or OVA/IFA injection (open squares) sites over time. (B) Mean percentage ± SD (n=2/timepoint) of CD69+ (left graph) or CD25+ (right graph) TEa T cells in the indicated injection sites from mice in (A). (C) Intracellular IFN-γ in TEa cells in the indicated sites 12 days following antigen injection. (D) Percentages (n=2-6 pooled from 3 experiments) of IFN-γ+ TEa cells obtained from the gates shown in (C) in the EαRFP/IFA (filled squares) or OVA/IFA (open squares) injection sites 6 or 12 days post injection. (E) Intracellular IFN-γ in TEa cells in the cervical lymph node 6 (left panel) or 12 (right panel) days following antigen injection. (F) Percentages of IFN-γ+ TEa cells obtained from the gates shown in (C) or (E) in the EαRFP/IFA injection sites or draining cervical lymph nodes 3, 6 or 12 days post injection. Statistical differences shown are for ears versus all lymph nodes. (G) Intracellular IFN-γ in TEa cells in initial OVA/IFA injection sites 3 hours following challenge in those sites with PBS (left panel) or 40 μg of pEα (right panel). Data in (G) are representative of results obtained in 3 independent experiments. IFN-γ+ gates were determined by staining comparable samples with an isotype control antibody, as was the case for intracellular cytokine staining experiments shown in other figures. *, P≤0.05; **, P≤0.01; ***, P≤0.001.
Lymphokine production was used to assess the effector function of CD4+ T cells that accumulated in the subcutaneous sites. Importantly, lymphokine production was measured directly ex vivo by intracellular staining in the presence of brefeldin A to prevent cytokine release (Khoruts et al., 1998). This direct approach eliminated the concern that in vitro or in vivo restimulation with antigen might not accurately reflect the ongoing in vivo situation. Twelve days after EαRFP/IFA injection, a fraction of the TEa cells in the injection site were making IFN-γ and/or TNF-α, but very few were making IL-5 or IL-17 (Figure S1C). Subsequent analyses of Teff function were focused on IFN-γ. The 10-15% of TEa cells that produced IFN-γ in EαRFP/IFA injection sites on days 6 and 12 was significantly higher than the 2% of TEa cells that produced IFN-γ in OVA/IFA injection sites on these same mice at these times (Figure 1C and D). Very few cells in the lymph nodes draining either the EαRFP or OVA injecton sites were making IFN-γ at 3, 6, or 12 days (Figure 1E and F), suggesting that the IFN-γ-producing TEa T cells at the EαRFP injection sites were not producing this lymphokine before they reached the injection site. As shown in Figure 1G, TEa T cells in the OVA/IFA-injected ear produced IFN-γ 3 hours after injection of pEα into that site. Thus, the TEa T cells that entered the OVA/IFA-injected ear were capable of IFN-γ production if the appropriate antigen was introduced into the tissue. These results reveal that IFN-γ production at the site of antigen deposition in the non-lymphoid tissue occurs only when antigen-specific CD4+ T cells detect the relevant pMHCII ligand.
Foxp3+ TEa cells produce IL-10 at the antigen injection site
TEa Treg cells also accumulated at the sites of EαRFP/IFA injection. The first hint of this fact came from the observation that the IFN-γ producing TEa T cells in the EαRFP-containing ears did not coincide with those expressing CD25 (Figure 2A). Considering that Treg cells often express high levels of CD25 (Sakaguchi et al., 1995), we stained TEa cells in the ear for the Treg cell-specific transcription factor Foxp3 (Fontenot et al., 2005; Hori et al., 2003). Foxp3 was not detected in RAG-deficient TEa T cells prior to transfer as reported previously for other TCR transgenic lines (Sun et al., 2007) (Figure S2A). Similarly, less than 10 Foxp3+ TEa cells were detected in the lymph nodes of recipient mice after adoptive transfer but before EαRFP injection (Figure S2B). However, a large population of Foxp3+ TEa T cells was present in lymph nodes draining the EαRFP injection site by day 12 (Figure S2B). A time course experiment revealed that while the number of Foxp3− TEa cells peaked at day 6 after EαRFP /IFA injection, Foxp3+ TEa cells were still increasing on day 12 to account for approximately 20% of the total TEa population in the lymph node (Figure S2B). The percentage of Foxp3+ TEa T cells in the EαRFP-containing ear at this time was even greater than that observed in the lymph nodes (Figure 2B). These results demonstrate that Treg cells were induced from Foxp3− naïve TEa precursors in the lymph nodes late in the primary response. In addition, TEa Treg cells accumulated preferentially at the EαRFP injection site in the same manner as Teff cells with the same specificity (Figure S2C).
Figure 2. Antigen-specific Treg cells produce IL-10 in antigen injection sites.

(A) Representative (6 independent experiments) intracellular IFN-γ versus CD25 staining in TEa cells in an EαRFP/IFA injection site from a B6 recipient of TEa cells injected with EαRFP/IFA 12 days earlier. (B) Intracellular Foxp3 staining of TEa cells from draining lymph nodes (left panel) or antigen injection sites (right panel) 12 days after EαRFP/IFA injection. (C) Intracellular IL-10 in the Foxp3+ TEa population from the draining lymph node (left panel) or antigen injection site (right panel) 12 days following EαRFP/IFA injection. (D) Percentages of IL-10+, Foxp3+ TEa cells from antigen injection sites (closed squares) or draining lymph node (open squares) 12 days after injection of EαRFP/IFA (n=9 from 3 pooled experiments). (E) Intracellular IFN-γ (left panel) or IL-10 (right panel) versus Foxp3 in TEa cells from EαRFP/IFA injection sites 12 days after injection. Percent of total cells is shown in each quadrant. *, P=0.007
We next determined if the induced TEa Treg cells in the EαRFP injection sites were activated as evidenced by production of IL-10, an important suppressive cytokine (Belkaid, 2007; Tang and Bluestone, 2008). TEa T cells from ears and draining lymph nodes were stained for Foxp3, IL-10 and IFN-γ directly ex vivo. As before, the cells were not restimulated in vitro to determine the true in vivo state of cytokine production. About 15% of the Foxp3+ TEa T cells in EαRFP-containing ears were making IL-10 compared to only 5% of the Foxp3+ TEa cells in the lymph nodes (Figure 2C and D). The majority of IL-10-producing TEa cells in the injection site were Foxp3+ whereas the majority of IFN-γ-producing TEa cells were Foxp3− (Figure 2E)
Together, the results demonstrate that Foxp3+ cells capable of producing IL-10 in a non-lymphoid tissue containing the relevant antigen can be induced from a naïve population of T cells, and can co-exist in the same tissue with Teff cells of the same origin.
Non-lymphoid activation of endogenous antigen-specific CD4+ T cells
The preceding results depended on the adoptive transfer of large numbers of antigen-specific T cells from TCR transgenic mice. A limitation of this approach is that T cells may receive less intense antigenic stimulation when present in large numbers, perhaps because of intraclonal competition (Badovinac et al., 2007; Blair and Lefrancois, 2007; Foulds and Shen, 2006; Hataye et al., 2006; Marzo et al., 2005).
To validate the use of the adoptive transfer system in this model, we investigated the activation state of an endogenous antigen-specific CD4+ T cell population. B6 mice were injected intradermally in one ear with the immunogenic peptide 2W1S (Rees et al., 1999) emulsified in IFA or in the other ear with emulsified IFA alone. Negative control mice received IFA alone in both ears. Twelve days after injection, ears and draining lymph nodes were harvested and single cell suspensions were prepared from each tissue. 2W1S:I-Ab tetramers (Moon et al., 2007; Rees et al., 1999) were used to detect antigen-specific CD4+ T cells by flow cytometry. 2W1S:I-Ab-specific CD4+ T cells were not detected in the ears of mice injected with IFA alone (Figure 3A) as predicted by earlier work showing that naïve CD4+ T cells are not present in non-lymphoid tissue (Reinhardt et al., 2001). In contrast, 2W1S:I-Ab-specific CD4+ T cells were present in 2W1S-containing ears and were much more numerous in this site than in the IFA only-containing ear on the same mouse (Figure 3B). The fold-difference between the two ears was 7.5 ± 5 (mean ± standard deviation) in six experiments (data not shown).
Figure 3. Endogenous antigen-specific Teff and Treg CD4+ T cells are activated in antigen injection sites.

(A) 2W1S:I-Ab versus CD44 staining for CD4+ T cells in the injection sites of B6 mice injected in both ears with PBS/IFA 12 days earlier. (B) 2W1S:I-Ab versus CD44 staining for CD4+ T cells in the indicated injection sites of B6 mice injected 12 days earlier with PBS/IFA (left panel) in one ear and 2W1S/IFA (right panel) in the other. (C) CD25 versus CD69 expression or (D) intracellular IFN-γ production by TEa cells in the PBS/IFA (left panel) or 2W1S/IFA (right panel) injection sites of mice shown in (B). B-D are representative of 3 independent experiments. (E) IFN-γ or (F) IL-10 versus Foxp3 staining for 2W1S:I-Ab-specific CD4+ T cells in 2W1S/IFA injection sites 12 days after injection. The percentages of total cells are shown in each quadrant. Similar results were obtained in 2 independent experiments.
Several additional pieces of evidence indicated that the 2W1S:I-Ab-specific CD4+ T cells behaved like the TEa cells following antigen/IFA injection. A much larger fraction of the 2W1S:I-Ab-specific CD4+ T cells in 2W1S/IFA injection sites expressed CD69 and/or CD25 than the comparable cells in IFA-injected ears (Figure 3C). In addition, 10% of the 2W1S:I-Ab-specific CD4+ T cells in 2W1S-containing ears were producing IFN-γ, compared to less than 2% in IFA-injected ears (Figure 3D). Thus, like the TCR transgenic T cells, endogenous antigen-specific CD4+ T cells accumulated and showed signs of activation only in antigen-containing subcutaneous tissues. Similarly, using Foxp3-green fluorescent protein (GFP) reporter mice, we found that 2W1S:I-Ab-specific CD4+ T cells from antigen-containing ears consisted of at least two subsets: a Foxp3− population, more of which produced IFN-γ than IL-10, and a Foxp3+ population that produced IL-10 but not IFN-γ (Figure 3E and F). Additionally, like TEa T cells, 2W1S:I-Ab-specific CD4+ Treg cells arose later in the primary response than the Teff population (data not shown) (Korn et al., 2007). The similarity between the endogenous and TCR transgenic T cells validated the use of the adoptive transfer approach for subsequent study of Treg and Teff T cells in this model system.
Continous antigen presentation is required for both Teff and Treg CD4+ T cell cytokine production in the skin
The differences in T cell activation between sites containing antigen and those that did not raised the possibility that APC displaying antigen-derived pMHCII complexes were activating antigen-specific T cells in the former locations. We tested this possibility by assessing the capacity of the pEα:I-Ab-specific Y-Ae antibody to block the activation of TEa cells in EαRFP injection sites. B6 recipients of TEa cells were injected in both ears with EαRFP/IFA. At various times thereafter, Y-Ae or isotype control antibody was injected directly into the antigen-containing sites of separate groups of mice. IL-10 and IFN-γ production by TEa cells in the Foxp3+ and Foxp3− populations, respectively, were measured directly ex vivo 4 hours following antibody injection. This short time frame was chosen to minimize the potential contribution of TEa T cells migrating to the ear from draining lymph nodes and yet still allow for the suppression of cytokine production as has been described for CD8+ T cells in vitro (Slifka et al., 1999).
Remarkably, the percentage of both IL-10- and IFN-γ-producing Foxp3+ and Foxp3− TEa cells in EαRFP injection sites was significantly reduced 4 hours after Y-Ae administration (Figure 4A and B). The endogenous CD4+ T cell populations in the ear, which were presumably specific for other peptides derived from EαRFP were unaffected (Figure 4C and D), demonstrating the specificity of the Y-Ae blockade.
Figure 4. Cytokine production by antigen-specific Treg and Teff CD4+ T cells in antigen injection sites is dependent on pMHCII recognition.
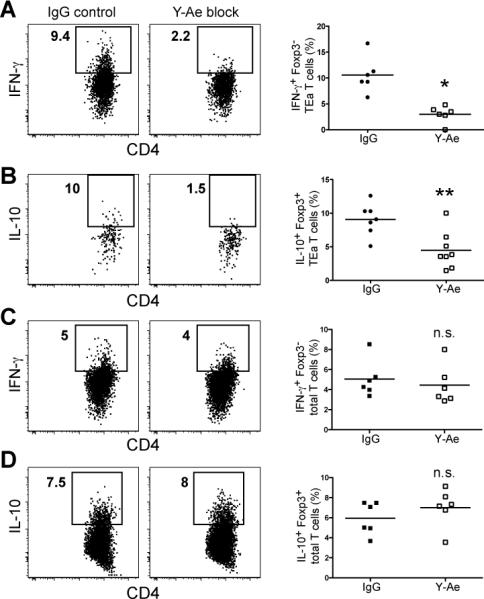
(A and C) IFN-γ or (B and D) IL-10 production by Foxp3− TEa (A) or endogenous Foxp3− CD4+ T cells (C) or Foxp3+ TEa (B) or endogenous Foxp3+ CD4+ T cells (D) 4 hours after injection of Y-Ae antibody or an isotype control antibody into day 12 EαRFP/IFA injection sites. Data in scatterplots correspond to 7-8 individual mice from 2 experiments. n.s.=not significant. *, P=0.0007; **, P=0.004
Although these results indicated that the cytokine-producing T cells were being stimulated by local pMHCII recognition, it was still possible that this stimulation occurred in the lymph nodes and was maintained by the T cells after migration into the ear tissue. This possibility was addressed by preventing T cell egress from lymph nodes with an S1P1 receptor agonist (Matloubian et al., 2004). Mice that received TEa cells were injected with EαGFP in the ears, then at the plateau of T cell infiltration into the ear 8 or 11 days days later, with an S1P1 receptor agonist or the relevant vehicle only. 24 hours later, the number of TEa cells in the blood of mice injected with S1P1 agonist was much lower than the number in vehicle-injected mice, indicating that lymph node egress was blocked (Figure S3A). However, IFN-γ production by TEa cells in the ear injection sites was identical in both groups at this time (Figure S3B), ruling out the possibility that these T cells were recent migrants from the lymph nodes. This finding together with the Y-Ae blocking results suggested that antigen-presentation in the antigen injection sites was driving the production of both suppressor and inflammatory cytokines by antigen-specific Teff and Treg cells in this location.
Dendritic cells present antigen in the skin
We next sought to identify the APC that were stimulating lymphokine production by Teff and Treg cells in the skin. Non-hematopoetic cells (CD45−), hematopoetic non-DC (CD45+ CD11c−), and DCs (CD45+ CD11c+) were FACS sorted from ears injected 12 days earlier with either EαRFP/IFA or OVA/IFA (Figure 5A). The sorted cells were cultured at a 1:1 ratio with naïve TEa transgenic T cells in the presence of IL-2. As shown in Figure 5B, the only cell type capable of stimulating the proliferation of TEa cells were DCs obtained from the EαRFP-injected ear. The other cell types did not induce proliferation even when the number of APC in each well was increased 4-fold (data not shown). Thus, the only cells capable of ex vivo antigen presentation from 12 day injection sites were DCs.
Figure 5. DCs are the only cells in antigen injection sites that present antigen and induce T cell lymphokine production.

(A) Representative CD11c versus CD45 staining for cells isolated from the ears of B6 mice injected 12 days earlier with either EαRFP/IFA or OVA/IFA. (B) CFSE dilution of naïve TEa T cells incubated with cells sorted based on the gates shown in (A). The sorted populations were from: OVA/IFA injection sites (B, top rows) or EαRFP injection sites (B, bottom rows). Gates indicate the percentage of TEa cells that proliferated during the culture. Data are representative of three individual experiments. (C) Representative GFP versus CD11c staining of anti-CD11c magnetic bead-enriched cells from antigen injection sites of CD11c-DTR mice 24 hours after PBS (left panels) or DT injection (right panels). Scatterplots on the right show the percentage of DCs in samples from individual mice. (D) Representative intracellular IFN-γ staining of Foxp3− or (E) IL-10 staining of Foxp3+ TEa T cells from CD11c-DTR recipients injected with EαRFP/IFA, then 11 days later with DT (right panels) or PBS (left panels) into the original injection sites. Intracellular staining was performed 24 hours after DT or PBS injection. Scatterplots (far right panels) show the percentage of cytokine-producing TEa T cells from individual mice. (n=7 from 2 pooled experiments). *, P<0.0001; **, P=0.0005; ***, P=0.02.
The sorting results were confirmed by acute depletion of DCs from injection sites. TEa T cells were transferred into CD11c-DTR transgenic mice (Jung et al., 2002), which express GFP and the diptheria toxin (DT) receptor (DTR) under the control of the CD11c promoter. Mice were then injected in both ears with EαRFP/IFA. Eleven days after injection, one group of mice was injected with DT to eliminate DCs. A separate PBS-injected group was used as a positive control for cytokine production. Twenty-four hours after DT injection, EαRFP/IFA-injected ears were harvested and single cell preparations were analyzed by flow cytometry. As expected, the percentage of CD11c+, GFP+ cells in the ear dropped by 70% (Figure 5C) in CD11c-DTR transgenic mice injected with DT. In addition, both IL-10 production in the Foxp3+ and IFN-γ production in the Foxp3− TEa populations at the injection site dropped significantly (p=0.02 and p=0.0005, respectively) in DC-ablated mice compared with the DC-sufficient controls (Figures 5D and E). The incomplete abrogation of cytokine production by TEa T cells was consistent with the partial depletion of DCs. Together these data provided evidence for a DC population at antigen/IFA injection sites that is essential for both the suppressor and effector functions of antigen-specific CD4+ T cells in this location.
Dermal dendritic cells present antigen in the skin
It was of interest to identify the type of CD11c+ DC that was responsible for antigen presentation in the intradermal injection sites. Our analyses focused on Langerin− dermal DCs, epidermal Langerhans cells, newly discovered dermal Langerin+ cells, and plasmacytoid DCs, which can all be found in inflamed skin (Bursch et al., 2007; Ginhoux et al., 2007; Kissenpfennig et al., 2005; Poulin et al., 2007; Valladeau and Saeland, 2005). As shown in Figure 6A, the number of CD11c+ cells in the injection sites increased dramatically between day 1 and day 12 when cytokine-producing Teff and Treg cells were present. CD11c+ cells were enriched from day 12 samples with anti-CD11c antibody plus magnetic beads to increase the number of DC in the analysis. Greater than 90% of the CD11c+ cells in the injection sites on day 12 expressed high levels of CD11b and low levels of the macrophage marker F4/80 (Figure 6B). Langerin-GFP reporter mice (Kissenpfennig et al., 2005) were used to assess the presence of epidermal Langerhans cells or dermal Langerin+ cells. Langerin+ cells were clearly identified in the CD11c+ population in the ear injection sites of these mice based on a comparison with cells from normal B6 mice (Figure 6C). However, the Langerin+ cells accounted for only 1-3% of the total CD11c+ cells in the ear injection sites and were distinguished from the large CD11bhigh population by lower expression of CD11b. The expression of F4/80 but not Langerin identified the abundant CD11bhigh population as dermal DCs (Bogunovic et al., 2006). The small Langerin+ population contained epidermal Langerhans cells and dermal Langerin+ cells. These two cell types could be distinguished because the epidermal Langerhans cells expressed more CD11b and Langerin than the dermal Langerin+ cells, and the dermal Langerin+ cells expressed CD103 (data not shown). Plasmacytoid DC, identified by expression of B220 based on a gate from the clearly resolved comparable population in lymph nodes, accounted for less than 1% of the CD11c+ population in the injection sites (Figure 6D). Finally, about the 5% of the cells in the CD11c+ population, did not express CD11b, B220, or Langerin. These cells may have been CD8+ effector T cells, which can express CD11c (Huleatt and Lefrancois, 1995). Together, these results showed that the vast majority of the CD11c+ cells in the ear injection sites were CD11bhigh dermal DCs along with trace populations of epidermal Langerhans cells, dermal Langerin+ cells, and plasmacytoid DCs.
Figure 6. Dendritic cells present antigen in injection sites throughout the primary immune response.

Single cell preparations from the ears of B6 mice injected with either EαRFP/IFA in both ears or OVA/IFA in both ears were enriched as indicated. The events in shown (A) and (B) represent viable cells, in (C-D, F-G) CD11c+ cells, and in (E) CD11c+, CD11bhigh cells. (A) CD11c staining versus forward light scatter of anti-MHCII magnetic bead-enriched cells from EαRFP/IFA injection sites of B6 mice 24 hours or 12 days after injection. Numbers indicate the percentage of cells in the CD11c+ gate. (B) CD11c versus CD11b staining (left panel) of anti-CD11c magnetic bead enriched cells from EαRFP/IFA injection sites of B6 mice 12 days after injection. F4/80 staining (right panel, thick line) is shown for the CD11c+, CD11bhigh cells from the left panel. The shaded histogram shows staining of the same population with an isotype control antibody. (C) CD11b staining versus Langerin expression in anti-CD11c magnetic bead enriched cells from EαRFP/IFA injection sites of control B6 mice (left panel) or Langerin-GFP transgenic mice (right panel) 12 days after injection. Dermal Langerin+ cells were identified in the left gate and epidermal Langerhans cells in the right gate in the panel from Langerin-GFP transgenic mice. Numbers indicate the percentage of cells in the indicated gates. (D) B220 versus CD11b staining for anti-CD11c magnetic bead enriched cells from lymph nodes (left panel) or EαRFP/IFA injection sites (right panel) of B6 mice 12 days after injection. Plasmacytoid DC were identified as B220+, CD11b− cells based on the gate from the lymph nodes (left panel). A population of B220−, CD11b− cells was also identified with this staining combination. (E) Y-Ae staining (left panel) and antigen uptake (right panel) in the CD11c+ CD11bhigh cells (dermal DCs) in (B) in Y-Ae magnetic bead-enriched populations from OVA/IFA (shaded) or EαRFP/IFA (thick line) injection sites of B6 mice 12 days after injection. (F) Y-Ae staining (left panel) and antigen uptake (right panel) in the Langerin+, CD11b− (dermal Langerin+ DCs) and (G) Langerin+, CD11b+ (epidermal Langerhans cells) in (C) in anti-CD11c magnetic bead-enriched populations from OVA/IFA (shaded) or EαRFP/IFA (thick line) injection sites of Langerin-eGFP mice 12 days after injection. (H) Y-Ae staining in the B220+, CD11b− (plasmacytoid DCs) and B220−, CD11b− cells in (D) in anti-CD11c magnetic bead-enriched populations from OVA/IFA (shaded) or EαRFP/IFA (thick line) injection sites of B6 mice 12 days after injection. Data are representative of two to five independent experiments.
The Y-Ae antibody was then used to detect pEα:I-Ab complex production by these DC subsets. As shown in Figure 6E, left panel, the level of pEα:I-Ab complexes on the abundant CD11bhigh dermal DC population in EαRFP/IFA injection sites on day 12 was 2.4 ± 0.35 (mean ± SD, n=4) times higher than that of the comparable population in OVA/IFA injection sites. pEα:I-Ab complexes were also detected on the rare epidermal Langerhans cells and dermal Langerin+ cells, but not the plasmacytoid DC or CD11b−, CD11c+ cells in EαRFP/IFA injection sites (Figure 6F and G, left panels). Notably, the CD11bhigh dermal DC population took up far more antigen in the site at day 12 compared to the Langerin+ dermal DC or the Langerhans cells (Figure 6E-G, right panels).
Although the CD11bhigh dermal DCs from the previous experiment were 100 times more prevalent than any other DC in the inflamed skin, it was still possible that the Langerin+ DCs were responsible for stimulation of the T cells. Langerin-DTR mice which express the DTR and GFP under control of the Langerin promoter (Kissenpfennig et al., 2005) were used to test this possibility. These mice received DT 11 days after injection of 2W1S in IFA. Ears were harvested on day 12 and Langerin+ DC ablation was confirmed by staining for CD11c and GFP (Figure S4A and B). Although nearly all of the Langerin+ DCs were ablated, IFN-γ in the 2W1S:I-Ab-specific, Foxp3− and IL-10 in the Foxp3+ CD4+ T cells was unaffected (Figure S4C and D). These results demonstrate that the Langerin+ DCs in the skin do not contribute appreciably to stimulating cytokine production by the antigen-specific T cells in the inflamed skin. This function was therefore likely to be carried out by CD11bhigh dermal DCs, which were the only other APC in this site that displayed detectable pMHCII complexes.
Treg cells actively suppress Teff IFN-γ production in the skin
The simultaneous activation of antigen-specific Teff and Treg cells by CD11bhigh dermal DCs in the antigen injection sites raised the possibility that the Treg cells were suppressing the activity of the Teff cells. This possibility was addressed by measuring the effect of acute depletion of the Treg cells on lymphokine production by the Teff cells. This was accomplished through the use of Foxp3-DTR mice, which express the DTR in Treg cells under the control of the Foxp3 promoter (Kim et al., 2007). Foxp3-DTR mice were injected with 2W1S peptide in IFA in both ears and 10 days later one group of mice was injected with DT while a control group was injected with PBS. 48 hours following DT injection, ears were harvested and IFN-γ was assessed directly ex vivo in the Foxp3− 2W1S:I-Ab-specific CD4+ T cells. As shown in Figure 7A, Treg cells were completely eliminated from the ear tissues of the DT-treated mice. Under these conditions, 35% of the Foxp3− 2W1S:I-Ab-specific CD4+ Teff cells produced IFN-γ compared to 15% of the cells in PBS-injected control mice (Figure 7B and C). This result demonstrated that Treg cells constantly limit the production of IFN-γ by Teff cells specific for the same pMHCII ligand in a subcutaneous site of antigen deposition.
Figure 7. Ablation of Treg cells increases IFN-γ production by antigen-specific Teff cells in antigen injection sites.

(A and B) Foxp3-DTR mice were injected in the ear with 2W1S/IFA, then 11 days later with PBS (left panels) or DT (right panels). (A) Representative Foxp3-GFP versus CD25 staining of total CD4+ T cells from 2W1S/IFA injection sites of Foxp3-DTR mice 24 hours after injection of PBS (left panels) or DT (right panels). (B) Representative intracellular IFN-γ staining of Foxp3−, 2W1S:I-Ab-specific CD4+ T cells in 2W1S/IFA injection sites 24 hours after injection of PBS (left panels) or DT (right panels). (C) Scatterplot shows the percentage of IFN-γ-producing Foxp3−, 2W1S:I-Ab-specific CD4+ T cells in 2W1S/IFA injection sites 24 hours after PBS (closed squares) or DT injection (open squares, from 3 pooled experiments). *, P=0.0002
DISCUSSION
Our results with monoclonal TEa cells demonstrate that the Teff and Treg cells that accumulate in a non-lymphoid tissue can be derived from the same Foxp3− naïve antigen-specific population. This finding adds to the growing body of evidence indicating that Teff and Treg cells are alternate progeny of naïve cells from the foreign antigen-specific repertoire (Knoechel et al., 2005; Kretschmer et al., 2005; Sun et al., 2007). Our studies rule out TCR affinity as the only determinant of Teff or Treg cell fate since monoclonal naïve TEa cells could adopt either fate. It is also possible that the polyclonal 2W1S:I-Ab-specific Treg cells were generated from Foxp3− naïve precursors because natural Treg cells are under-represented in the naïve 2W1S:I-Ab-specific population (Burchill et al., 2008).
Our results provide definitive evidence for the suggestion of Belkaid and coworkers (Suffia et al., 2006) that cytokine production by some of the Teff and Treg cells in non-lymphoid tissues is driven by local DC displaying pMHCII complexes derived from the foreign antigen. The alternative possibility that Teff or Treg cells began producing IFN-γ or IL-10 in the lymph nodes and then simply continued that production in a TCR-independent fashion after migrating to the injection site was ruled out based on several pieces of evidence. First, very few antigen-specific IFN-γ-producing cells were found in the draining lymph nodes at any time after injection of antigen. Second, a higher fraction of antigen-specific IFN-γ-producing cells was found in the injection site containing the relevant antigen than in a site on the same mouse containing an irrelevant antigen. This finding is difficult to reconcile with a TCR-independent process. Third, lymphokine production by Teff or Treg cells in the injection sites was not affected by blockade of T cell egress from the secondary lymphoid organs. Fourth, blockade of the relevant pMHCII ligand rapidly terminated lymphokine production proving that non-specific inflammatory signals such as cytokines, for example IL-12 and IL-18 (Yang et al., 1999; Yoshimoto et al., 1998), did not sustain lymphokine production in the absence of continued TCR stimulation.
CD11bhigh dermal DCs were likely the key APC in subcutaneous injection sites because they were the most numerous of the three DC subsets that produced pMHCII complexes from the injected antigen. The dominance of CD11bhigh dermal DCs over dermal langerin+ cells and epidermal Langerhans cells could not be explained by the production of more pMHCII complexes. Although CD11bhigh dermal DCs took up the most antigen, they actually produced fewer pMHCII complexes than the other two cell types. Thus, despite being relatively inefficient with respect to antigen processing, CD11bhigh dermal DCs became important APC because their high frequency at the injection site increased the likelihood of contacting a Teff or Treg cell.
The dramatic increase in the number of these cells at injection sites over time indicates a rapid recruitment from the blood, perhaps as monocytes (Geissmann et al., 2003; Ginhoux et al., 2006). DCs with a similar phenotype have been implicated in antigen presentation in other non-lymphoid tissues. For example, CD11b+ DCs in the lungs of mice that inhale the Leishmania LACK antigen, present LACK-derived pMHCII complexes as late as 8 weeks following antigen exposure (Julia et al., 2002). This ongoing presentation may maintain CD4+ T cell IFN-γ production in the airways, which is an important component of allergic asthma (Kumar et al., 2004).
The simultaneous presence of Teff and Treg cells activated by the same pMHCII ligand on DCs at the injection site may be a mechanism to balance the anti-microbicidal but potentially toxic effect of IFN-γ. While IFN-γ is required to eliminate certain pathogens (Dalton et al., 1993), it has also been implicated in the induction of several serious autoimmune disorders including diabetes (Wang et al., 1997) and systemic lupus erythematosus (Seery et al., 1997). Conversely, a lack of IL-10 in T cells can lead to amplified colitis, increased skin hypersensitivity, and lethality of mice infected with Toxoplasma gondii (Roers et al., 2004).
The reliance on DC antigen presentation suggests a mechanism whereby a balance between IL-10 and IFN-γ production may be struck. One possibility is that the counter-balancing effects of each population on the other are optimized by co-localization on the same DCs. In this way, the cytokines produced by one population would be focused in the area occupied by the other. Our finding that eliminating Treg cells tips the balance of cytokine production by pMHCII-specific T cells in favor of IFN-γ supports this possibility. It is feasible that the IL-10 produced by Treg cells limits IFN-γ production by Teff cells. This contention is supported by the findings that IL-10 production by Treg cells limits the delayed-type hypersensivity reaction (Rubtsov et al., 2008), which is mediated in part by IFN-γ (Timoshanko et al., 2002). This suppression could occur via an indirect effect on the DC. IL-10 can inhibit CD80, CD86, and MHCII expression by DC, thereby reducing the ability of these cells to stimulate T cells (Mahnke et al., 2007). It is reasonable to expect that the DCs most susceptible to this type of suppression would be those that actually present pMHCII to Treg cells and stimulate their IL-10 production. It is also possible that Treg cells act via an IL-10-independent mechansism, for example competition with Teff cells for pMHCII ligands on the same DC in the non-lymphoid tissues. This competition may create a state of mutual deterrence in which neither population can be stimulated too strongly. Along these lines, it is notable that in both the case of the transgenic TEa cells and the endogenous T cells, the number of Treg cells in the injection site was about the same as the number of Teff cells. Thus, it is possible that under conditions of chronic infection, neither cell type would be able to out-compete the other, in effect maintaining the cytokine balance in the tissue.
MATERIALS AND METHODS
Mice
6- to 8-week-old male B6 mice were purchased from the National Cancer Institute mouse repository (Frederick, MD). TEa TCR transgenic RAG1-deficient mice expressing the CD90.1 allele (Grubin et al., 1997) and CD11c-DTR mice (Jung et al., 2002) were bred on site. Foxp3-GFP mice (Fontenot et al., 2005) were a gift of S. Way at the University of Minnesota. Foxp3-DTR (Kim et al., 2007) mice were obtained from A. Rudensky at the University of Washington. Langerin-eGFP (Kissenpfennig et al., 2005) and heterozygous Langerin-DTR (used as described in (Bursch et al., 2007)) mice were a generous gift of K. Hogquist at the University of Minnesota. Mice were housed in a specific pathogen-free facility at the University of Minnesota, and experiments were conducted according to federal and institutional guidelines with the requisite approval of the University of Minnesota Institutional Animal Care and Use Committee.
Antigens and injections
The EαRFP was prepared as previously described (Itano et al., 2003). Both proteins were purified from bacterial lysates using a Nickel resin His-Bind column (Novagen) as previously described (Itano et al., 2003). Contaminating endotoxin was removed using TritonX-114 phase separation (Aida and Pabst, 1990). Whole chicken ovalbumin was purchased from Sigma-Aldrich. 2W1S peptide (AWGALANWAVDS) was purchased from Invitrogen. For blocking experiments, Y-Ae antibody produced from the Y-Ae hybridoma (a generous gift from A. Rudensky) (Murphy et al., 1992; Rudensky et al., 1991) was injected directly into the ears of immunized mice at a concentration of 20 μg per ear 4 hours before mice were sacrificed for analysis. 20 μg of mouse IgG2b isotype control antibody from clarified ascites (Sigma, St. Louis, MO) was injected into separate mice as a negative control. DT (Sigma, St. Louis, MO) was administered to mice by i.p. injection at 1 μg (for Langerin-DTR), or 4 ng/g body weight (for CD11c-DTR), or 50 μg/kg body weight (for Foxp3-DTR). S1P1 receptor agonist (Merck) was injected i.p. at 20 μg/mouse. DT and S1P1 agonist injections were administered 24 hours prior to tissue harvest (for Langerin-DTR and CD11c-DTR) or 24 and 48 hours (for Foxp3-DTR).
Adoptive transfer and antigen injection
Pooled spleen and lymph node cells from naive CD90.1+ TEa TCR transgenic RAG1-deficient donor mice were used for adoptive transfer. The cells were identified before transfer by flow cytometry after staining of a small sample with FITC-labeled anti-CD4 (eBioscience), PE-labeled anti-TCR Vα2, and PerCP-labeled anti-CD90.1 (BD Biosciences) antibodies. One million TEa cells were transferred i.v. into each normal CD90.2+ B6 recipient. Antigens were emulsified 1:1 in IFA. 25 μg of antigen in 10 μl of IFA emulsion was injected intradermally into the ear. A 1:1 PBS/IFA emulsion was used as a negative control.
Tissue harvest and cell preparation
Antigen-injected ears and draining cervical lymph nodes were removed and placed immediately into ice-cold collagenase buffer (RPMI1640, 2% FCS, 10mM HEPES). Ears were then pulled apart to expose the underlying dermis. The dermal layer was scraped out with a scalpel blade. All of the ear tissue was then finely minced. Lymph nodes were dissociated with forceps. Collagenase D (Roche Diagnostics, Penzberg, Germany) was added to each tissue at a final concentration of 300 Mandl U/ml. Lymph nodes were incubated at 37°C/5% CO2 for 40-60 minutes, mashed with the back of a 3 ml syringe, and passed through a 100 μm nylon screen (Sefar Filtration, Depew, NY). Ears were incubated for 30 minutes in 37°C/5% CO2 mashed with the back of a 3 ml syringe, incubated for an additional 20-30 minutes, then filtered as described above. The remaining tissue on the screen was re-mashed, rinsed with PBS (+ 5mM EDTA, 2% FCS), and filtered again. The resulting single cell suspensions were washed with PBS (+ 5mM EDTA, 2% FCS) and centrifuged. The supernatant was aspirated and the pellet was resuspended in culture supernatant containing 24G2 antibody (ATCC) plus 1% mouse serum (Sigma) and 1% rat serum (Sigma) to block Fc receptors (FcBlock). Samples were then stained for surface markers as described below. The identification of DCs in the CD11c-DTR DT ablated ears was performed following anti-CD11c magnetic bead enrichment (Miltenyi) according to the manufacturer's protocol. Cells were then stained with fluorochrome-labelled CD11c antibody. DCs were identified as CD11c+ GFP+ cells.
Detection of adoptively transferred TEa and endogenous 2W1S specific T cells
Single cell preparations from recipients of TEa cells were incubated briefly in FcBlock and then stained with PerCP-labeled anti-CD90.1, PE-Cy7-labeled anti-CD4, FITC-labeled anti-CD69, APC-labeled anti-CD25, and a non-T cell cocktail containing Pacific Blue-labeled anti-B220, anti-CD8, anti-F4/80, anti-CD11b and anti-CD11c antibodies. TEa T cells were identified as non-T cell cocktail−, CD4+ and CD90.1+ cells. In Fig. 2B and S2C, TEa cells were stained with biotin-labeled anti-CD90.1 antibody followed by streptavidin (SA) coupled to magnetic beads (Miltenyi, Auburn,CA) as described (Hataye et al., 2006). Cells were then passed over a magnetic column and the TEa-enriched bound fraction was stained for the markers mentioned earlier in this section of the methods to identify TEa cells. Endogenous antigen-specific T cells were identified using 2W1S:I-Ab/SA-PE or SA-APC tetramers (Moon et al., 2007; Rees et al., 1999). Single cell preparations from each tissue were incubated for 1 hour at room temperature with 5 (for the SA-PE tetramer) or 10 nM (for the SA-APC tetramer) tetramer in 1:1 FcBlock and sorter buffer (PBS +2% FCS +0.1% sodium azide). Cells were then washed in sorter buffer and stained with FITC-labeled anti-CD3, PerCP-Cy5.5-labeled anti-CD4, PE-Cy7-labeled anti-CD69, APC-labeled anti-CD25, Alexa Fluor 700-labeled anti-CD44, Pacific Orange-labeled anti-CD8, and a Pacific Blue-labeled non-T cell cocktail containing anti-F4/80, anti-B220, anti-CD11c, and anti-CD11b antibodies. 2W1S-specific T cells were identified as CD3+, non-T cell cocktail−, CD4+, CD8−, tetramer+, CD44+ events
Direct ex vivo IL-10 and IFN-γ staining
Single cell preparations from ears and draining lymph nodes were prepared as already described with the following exceptions. Ten μg/ml of brefeldin A was present throughout the collagenase digestion, to prevent cytokine exocytosis. Surface staining for TEa T cells was performed on ice with FITC-labeled anti-CD90.1, PE-Cy7-labeled anti-CD4, and a non-T cell cocktail containing Pacific Blue-labeled anti-B220, anti-CD8, anti-F4/80, anti-CD11b and anti-CD11c antibodies. Surface staining for endogenous antigen-specific T cells was performed with 2W1S:I-Ab/SA-APC tetramers as described earlier in the presence of brefeldin A. Cells were suspended in fixation buffer (BD Biosciences) for 20 minutes at 4°C. Intracellular cytokine and Foxp3 staining was carried out overnight in permeabilization buffer (BD Biosciences) with PE-, APC- or PE-Cy7-labeled anti-IFN-γ, APC- or PE-labeled anti-IL-10, and PerCP-Cy5.5-labeled anti-Foxp3 antibodies (all from eBioscience). Cytokine-positive cells were identifed based on an aliquot of cells from each sample stained with an appropriate isotype control antibody.
Detection of peptide:I-Ab complexes and characterization of antigen presenting cells
B6 mice were injected with 25 μg EαRFP/IFA in both ears. At 24 hours or 12 days after injection, ears and draining lymph nodes were harvested and single cell preparations were made as described above. A separate mouse was injected with 25 μg OVA/IFA in both ears to serve as a control for background staining at both time points. Cells from each tissue were enriched for Y-Ae+ cells using biotinylated Y-Ae antibody followed by SA-microbeads or anti-CD11c-microbeads or anti-MHCII-microbeads followed by LS columns (Miltenyi). The enriched cells were stained with biotinylated Y-Ae antibody (Murphy et al., 1992; Rudensky et al., 1991) followed by SA-APC (eBioscience) and various combinations of the following antibodies depending on the antigen injected: FITC-labeled anti-I-A/I-E, Alexa Fluor 750/APC labeled anti-F4/80, PerCP-Cy5.5-labeled anti-CD11c, Pacific Blue-labeled anti-CD11b, FITC labeled anti-B220. All staining was performed on ice. An LSR II (BD Biosciences) was used for all flow cytometry and analysis was performed with FlowJo software (Tree Star, Ashland, OR).
Sorting and in vitro restimulation of TEa T cells
Single cell suspensions from the ears or lymph nodes of mice injected with either 25 μg EαRFP/IFA or OVA/IFA were prepared as described above. Cells were stained with PE-labeled anti-CD45.2 (clone 104), FITC-labeled anti-CD3, and APC-labeled CD11c. Cells were sorted using a FACSAria flow cytometer (BD Biosciences). CD3− cells were then sorted into the three populations described in the text. Purified naïve TEa cells were labeled with 500 nM CFSE and then mixed 1:1 with the sorted populations in the presence of human rIL-2 (a generous gift of Matt Mescher) at 0.2 ng/ml. Cells were incubated at 37°C/5% CO2 for six days. The cells were then stained with Pacific Blue-labeled anti-Vα2, PerCP-labeled anti-CD4, and PE-Cy7-labeled anti-CD90.1 antibodies. CFSE dilution was measured on TEa T cells identified as Vα2+ CD4+ CD90.1+ cells
Statistics
In Fig. 1D, a two-way ANOVA and in Fig. 1F a one-way ANOVA was used. For both, a Bonferroni post test was used to determine significant differences between groups. For all other data, two-tailed, unpaired Student's t-test was used to assess differences between groups. Prism (Graphpad Software, La Jolla, CA) was used for graphs and statistical analysis. Differences were considered to be significant when the P-value was less than 0.05. Significant outliers were excluded using the Grubb's outlier test (Graphpad Software) in Fig. 5D.
Supplementary Material
Supplemental Figure 1. Identification and cytokine production of adoptively transferred T cells. (A) Representative CD4 versus CD90.1 staining to identify TEa T cells from lymph nodes of a transfer recipient that did not receive antigen (left panel), draining cervical lymph nodes (middle panel), or the EαRFP/IFA injection site (right panel) from transfer recipients injected with EαRFP/IFA 12 days earlier. (B) CFSE histograms for TEa cells shown in (A). Data in (A) and (B) are representative of three independent experiments. (C) Intracellular IFN-γ (top left panel), TNF-α (top right panel), IL-5 (lower left panel) and IL-17 (lower right panel) staining in TEa cells in an EαRFP/IFA injection site 12 days following antigen injection.
Supplemental Figure 2. Characterization of Foxp3+ TEa T cell accumulation. (A) Isotype control (left panel) or intracellular Foxp3+ (right panel) staining of CD4+ T cells from a TEa TCR transgenic RAG1-deficient mouse. (B) Mean number ± SD (n=2/timepoint) of Foxp3− (closed squares) or Foxp3+ (open squares) TEa T cells in the draining lymph nodes of mice injected with EαRFP/IFA. The number of Foxp3− TEa cells was calculated by subtracting the number of Foxp3+ TEa cells from the total number of TEa cells. (C) Number of Foxp3+ TEa cells in the indicated injection site from individual TEa recipient mice (from 2 experiments) 12 days after injection of EαRFP/IFA in one ear and OVA/IFA in the other. *, P=0.04
Supplemental Figure 3. IFN-γ production by TEa T cells in inflamed skin is not dependent on trafficking from the lymph node. B6 recipients of TEa T cells were injected with EαRFP/IFA in both ears and either 8 or 11 days later injected i.p. with an S1P1 receptor agonist to block TEa lymph node egress. Ears and blood were harvested 24 hours after agonist injection. (A) Scattterplot depicts TEa T cells as a percentage of total blood cells in vehicle (closed squares) or agonist (open squares) injected mice. (B) Intracellular IFN-γ in TEa cells in the injection site 9 or 12 days following antigen injection and 24 hours after vehicle (closed squares) or agonist (open squares) injection. n.s.=not significant. *, P=0.04
Supplemental Figure 4. Ablation of Langerin+ cells does not affect IFN-γ production by TEa T cells in inflamed skin. (A) Langerin-DTR mice were injected in the ear with 2W1S/IFA, then 11 days later with PBS (left panel) or DT (right panel). Representative CD11c versus Langerin-GFP plots are shown for CD11c+ cells from each group. (B) Scatterplot represents the percentage of Langerin+ cells within the CD11c+ population from injection sites of Langerin-DTR mice (identified as in (A)) injected with PBS (closed squares) and DT (open squares). Intracellular (C) IFN-γ and (D) IL-10 in Foxp3− or Foxp+ 2W1S:I-Ab-specific CD4+ T cells (identified as in Fig. 3E and F), respectively, in 2W1S/IFA injection sites 12 days following antigen injection and 24 hours after vehicle (closed squares) or DT (open squares) injection. n.s.=not significant. *, P=0.05
Acknowledgements
The authors would like to thank Dr. Marion Pepper for helpful advice; Dr. Dan Kaplan for critical reading of the manuscript; and Jennifer Walter, Matt Priess, and Jennifer Liboon for technical help. Paul Champoux and the CFI core flow cytometry facility assisted with sorting and flow cytometry experiments. This work was supported by grants from the NIH to MKJ, JJM, and JBM (F32-AI068326) and a CRI fellowship to DMC.
Footnotes
Publisher's Disclaimer: This is a PDF file of an unedited manuscript that has been accepted for publication. As a service to our customers we are providing this early version of the manuscript. The manuscript will undergo copyediting, typesetting, and review of the resulting proof before it is published in its final citable form. Please note that during the production process errors may be discovered which could affect the content, and all legal disclaimers that apply to the journal pertain.
REFERENCES
- Aida Y, Pabst MJ. Removal of endotoxin from protein solutions by phase separation using Triton X-114. J Immunol Methods. 1990;132:191–195. doi: 10.1016/0022-1759(90)90029-u. [DOI] [PubMed] [Google Scholar]
- Annacker O, Asseman C, Read S, Powrie F. Interleukin-10 in the regulation of T cell-induced colitis. Journal of autoimmunity. 2003;20:277–279. doi: 10.1016/s0896-8411(03)00045-3. [DOI] [PubMed] [Google Scholar]
- Asseman C, Mauze S, Leach MW, Coffman RL, Powrie F. An essential role for interleukin 10 in the function of regulatory T cells that inhibit intestinal inflammation. J Exp Med. 1999;190:995–1004. doi: 10.1084/jem.190.7.995. [DOI] [PMC free article] [PubMed] [Google Scholar]
- Badovinac VP, Haring JS, Harty JT. Initial T cell receptor transgenic cell precursor frequency dictates critical aspects of the CD8(+) T cell response to infection. Immunity. 2007;26:827–841. doi: 10.1016/j.immuni.2007.04.013. [DOI] [PMC free article] [PubMed] [Google Scholar]
- Belkaid Y. Regulatory T cells and infection: a dangerous necessity. Nature reviews. 2007;7:875–888. doi: 10.1038/nri2189. [DOI] [PubMed] [Google Scholar]
- Belkaid Y, Piccirillo CA, Mendez S, Shevach EM, Sacks DL. CD4+CD25+ regulatory T cells control Leishmania major persistence and immunity. Nature. 2002;420:502–507. doi: 10.1038/nature01152. [DOI] [PubMed] [Google Scholar]
- Blair DA, Lefrancois L. Increased competition for antigen during priming negatively impacts the generation of memory CD4 T cells. Proceedings of the National Academy of Sciences of the United States of America. 2007;104:15045–15050. doi: 10.1073/pnas.0703767104. [DOI] [PMC free article] [PubMed] [Google Scholar]
- Bogunovic M, Ginhoux F, Wagers A, Loubeau M, Isola LM, Lubrano L, Najfeld V, Phelps RG, Grosskreutz C, Scigliano E, et al. Identification of a radio-resistant and cycling dermal dendritic cell population in mice and men. J Exp Med. 2006;203:2627–2638. doi: 10.1084/jem.20060667. [DOI] [PMC free article] [PubMed] [Google Scholar]
- Bryant P, Ploegh H. Class II MHC peptide loading by the professionals. Current opinion in immunology. 2004;16:96–102. doi: 10.1016/j.coi.2003.11.011. [DOI] [PubMed] [Google Scholar]
- Burchill MA, Yang J, Vang KB, Moon JJ, Chu HH, Lio CW, Vegoe AL, Hsieh CS, Jenkins MK, Farrar MA. Linked T cell receptor and cytokine signaling govern the development of the regulatory T cell repertoire. Immunity. 2008;28:112–121. doi: 10.1016/j.immuni.2007.11.022. [DOI] [PMC free article] [PubMed] [Google Scholar]
- Bursch LS, Wang L, Igyarto B, Kissenpfennig A, Malissen B, Kaplan DH, Hogquist KA. Identification of a novel population of Langerin+ dendritic cells. J Exp Med. 2007;204:3147–3156. doi: 10.1084/jem.20071966. [DOI] [PMC free article] [PubMed] [Google Scholar]
- Campbell DJ, Butcher EC. Rapid acquisition of tissue-specific homing phenotypes by CD4(+) T cells activated in cutaneous or mucosal lymphoid tissues. J Exp Med. 2002;195:135–141. doi: 10.1084/jem.20011502. [DOI] [PMC free article] [PubMed] [Google Scholar]
- Dalton DK, Pitts-Meek S, Keshav S, Figari IS, Bradley A, Stewart TA. Multiple defects of immune cell function in mice with disrupted interferon-gamma genes. Science (New York, N.Y. 1993;259:1739–1742. doi: 10.1126/science.8456300. [DOI] [PubMed] [Google Scholar]
- Fontenot JD, Rasmussen JP, Williams LM, Dooley JL, Farr AG, Rudensky AY. Regulatory T cell lineage specification by the forkhead transcription factor foxp3. Immunity. 2005;22:329–341. doi: 10.1016/j.immuni.2005.01.016. [DOI] [PubMed] [Google Scholar]
- Foulds KE, Shen H. Clonal competition inhibits the proliferation and differentiation of adoptively transferred TCR transgenic CD4 T cells in response to infection. J Immunol. 2006;176:3037–3043. doi: 10.4049/jimmunol.176.5.3037. [DOI] [PubMed] [Google Scholar]
- Geissmann F, Jung S, Littman DR. Blood monocytes consist of two principal subsets with distinct migratory properties. Immunity. 2003;19:71–82. doi: 10.1016/s1074-7613(03)00174-2. [DOI] [PubMed] [Google Scholar]
- Ginhoux F, Collin MP, Bogunovic M, Abel M, Leboeuf M, Helft J, Ochando J, Kissenpfennig A, Malissen B, Grisotto M, et al. Blood-derived dermal langerin+ dendritic cells survey the skin in the steady state. J Exp Med. 2007;204:3133–3146. doi: 10.1084/jem.20071733. [DOI] [PMC free article] [PubMed] [Google Scholar]
- Ginhoux F, Tacke F, Angeli V, Bogunovic M, Loubeau M, Dai XM, Stanley ER, Randolph GJ, Merad M. Langerhans cells arise from monocytes in vivo. Nature immunology. 2006;7:265–273. doi: 10.1038/ni1307. [DOI] [PMC free article] [PubMed] [Google Scholar]
- Gordon S. Alternative activation of macrophages. Nature reviews. 2003;3:23–35. doi: 10.1038/nri978. [DOI] [PubMed] [Google Scholar]
- Grubin CE, Kovats S, deRoos P, Rudensky AY. Deficient positive selection of CD4 T cells in mice displaying altered repertoires of MHC class II-bound self-peptides. Immunity. 1997;7:197–208. doi: 10.1016/s1074-7613(00)80523-3. [DOI] [PubMed] [Google Scholar]
- Hataye J, Moon JJ, Khoruts A, Reilly C, Jenkins MK. Naive and memory CD4+ T cell survival controlled by clonal abundance. Science (New York, N.Y. 2006;312:114–116. doi: 10.1126/science.1124228. [DOI] [PubMed] [Google Scholar]
- Hori S, Nomura T, Sakaguchi S. Control of regulatory T cell development by the transcription factor Foxp3. Science (New York, N.Y. 2003;299:1057–1061. doi: 10.1126/science.1079490. [DOI] [PubMed] [Google Scholar]
- Huleatt JW, Lefrancois L. Antigen-driven induction of CD11c on intestinal intraepithelial lymphocytes and CD8+ T cells in vivo. J Immunol. 1995;154:5684–5693. [PubMed] [Google Scholar]
- Itano AA, McSorley SJ, Reinhardt RL, Ehst BD, Ingulli E, Rudensky AY, Jenkins MK. Distinct dendritic cell populations sequentially present antigen to CD4 T cells and stimulate different aspects of cell-mediated immunity. Immunity. 2003;19:47–57. doi: 10.1016/s1074-7613(03)00175-4. [DOI] [PubMed] [Google Scholar]
- Julia V, Hessel EM, Malherbe L, Glaichenhaus N, O'Garra A, Coffman RL. A restricted subset of dendritic cells captures airborne antigens and remains able to activate specific T cells long after antigen exposure. Immunity. 2002;16:271–283. doi: 10.1016/s1074-7613(02)00276-5. [DOI] [PubMed] [Google Scholar]
- Jung S, Unutmaz D, Wong P, Sano G, De los Santos K, Sparwasser T, Wu S, Vuthoori S, Ko K, Zavala F, et al. In vivo depletion of CD11c(+) dendritic cells abrogates priming of CD8(+) T cells by exogenous cell-associated antigens. Immunity. 2002;17:211–220. doi: 10.1016/s1074-7613(02)00365-5. [DOI] [PMC free article] [PubMed] [Google Scholar]
- Khoruts A, Mondino A, Pape KA, Reiner SL, Jenkins MK. A natural immunological adjuvant enhances T cell clonal expansion through a CD28-dependent, interleukin (IL)-2-independent mechanism. J Exp Med. 1998;187:225–236. doi: 10.1084/jem.187.2.225. [DOI] [PMC free article] [PubMed] [Google Scholar]
- Kim JM, Rasmussen JP, Rudensky AY. Regulatory T cells prevent catastrophic autoimmunity throughout the lifespan of mice. Nature immunology. 2007;8:191–197. doi: 10.1038/ni1428. [DOI] [PubMed] [Google Scholar]
- Kissenpfennig A, Henri S, Dubois B, Laplace-Builhe C, Perrin P, Romani N, Tripp CH, Douillard P, Leserman L, Kaiserlian D, et al. Dynamics and function of Langerhans cells in vivo: dermal dendritic cells colonize lymph node areas distinct from slower migrating Langerhans cells. Immunity. 2005;22:643–654. doi: 10.1016/j.immuni.2005.04.004. [DOI] [PubMed] [Google Scholar]
- Knoechel B, Lohr J, Kahn E, Bluestone JA, Abbas AK. Sequential development of interleukin 2-dependent effector and regulatory T cells in response to endogenous systemic antigen. J Exp Med. 2005;202:1375–1386. doi: 10.1084/jem.20050855. [DOI] [PMC free article] [PubMed] [Google Scholar]
- Korn T, Reddy J, Gao W, Bettelli E, Awasthi A, Petersen TR, Backstrom BT, Sobel RA, Wucherpfennig KW, Strom TB, et al. Myelin-specific regulatory T cells accumulate in the CNS but fail to control autoimmune inflammation. Nature medicine. 2007;13:423–431. doi: 10.1038/nm1564. [DOI] [PMC free article] [PubMed] [Google Scholar]
- Kretschmer K, Apostolou I, Hawiger D, Khazaie K, Nussenzweig MC, von Boehmer H. Inducing and expanding regulatory T cell populations by foreign antigen. Nature immunology. 2005;6:1219–1227. doi: 10.1038/ni1265. [DOI] [PubMed] [Google Scholar]
- Kumar RK, Herbert C, Webb DC, Li L, Foster PS. Effects of Anticytokine Therapy in a Mouse Model of Chronic Asthma. Am. J. Respir. Crit. Care Med. 2004;170:1043–1048. doi: 10.1164/rccm.200405-681OC. [DOI] [PubMed] [Google Scholar]
- Lemos MP, Esquivel F, Scott P, Laufer TM. MHC class II expression restricted to CD8alpha+ and CD11b+ dendritic cells is sufficient for control of Leishmania major. J Exp Med. 2004;199:725–730. doi: 10.1084/jem.20030795. [DOI] [PMC free article] [PubMed] [Google Scholar]
- Mahnke K, Bedke T, Enk AH. Regulatory conversation between antigen presenting cells and regulatory T cells enhance immune suppression. Cellular immunology. 2007;250:1–13. doi: 10.1016/j.cellimm.2008.01.004. [DOI] [PubMed] [Google Scholar]
- Marzo AL, Klonowski KD, Le Bon A, Borrow P, Tough DF, Lefrancois L. Initial T cell frequency dictates memory CD8+ T cell lineage commitment. Nature immunology. 2005;6:793–799. doi: 10.1038/ni1227. [DOI] [PMC free article] [PubMed] [Google Scholar]
- Masopust D, Vezys V, Marzo AL, Lefrancois L. Preferential localization of effector memory cells in nonlymphoid tissue. Science (New York, N.Y. 2001;291:2413–2417. doi: 10.1126/science.1058867. [DOI] [PubMed] [Google Scholar]
- Matloubian M, Lo CG, Cinamon G, Lesneski MJ, Xu Y, Brinkmann V, Allende ML, Proia RL, Cyster JG. Lymphocyte egress from thymus and peripheral lymphoid organs is dependent on S1P receptor 1. Nature. 2004;427:355–360. doi: 10.1038/nature02284. [DOI] [PubMed] [Google Scholar]
- Moon JJ, Chu HH, Pepper M, McSorley SJ, Jameson SC, Kedl RM, Jenkins MK. Naive CD4(+) T cell frequency varies for different epitopes and predicts repertoire diversity and response magnitude. Immunity. 2007;27:203–213. doi: 10.1016/j.immuni.2007.07.007. [DOI] [PMC free article] [PubMed] [Google Scholar]
- Mora JR, Bono MR, Manjunath N, Weninger W, Cavanagh LL, Rosemblatt M, Von Andrian UH. Selective imprinting of gut-homing T cells by Peyer's patch dendritic cells. Nature. 2003;424:88–93. doi: 10.1038/nature01726. [DOI] [PubMed] [Google Scholar]
- Murphy DB, Rath S, Pizzo E, Rudensky AY, George A, Larson JK, Janeway CA., Jr. Monoclonal antibody detection of a major self peptide. MHC class II complex. J Immunol. 1992;148:3483–3491. [PubMed] [Google Scholar]
- Poulin LF, Henri S, de Bovis B, Devilard E, Kissenpfennig A, Malissen B. The dermis contains langerin+ dendritic cells that develop and function independently of epidermal Langerhans cells. J Exp Med. 2007;204:3119–3131. doi: 10.1084/jem.20071724. [DOI] [PMC free article] [PubMed] [Google Scholar]
- Rees W, Bender J, Teague TK, Kedl RM, Crawford F, Marrack P, Kappler J. An inverse relationship between T cell receptor affinity and antigen dose during CD4(+) T cell responses in vivo and in vitro. Proceedings of the National Academy of Sciences of the United States of America. 1999;96:9781–9786. doi: 10.1073/pnas.96.17.9781. [DOI] [PMC free article] [PubMed] [Google Scholar]
- Reinhardt RL, Bullard DC, Weaver CT, Jenkins MK. Preferential accumulation of antigen-specific effector CD4 T cells at an antigen injection site involves CD62E-dependent migration but not local proliferation. J Exp Med. 2003;197:751–762. doi: 10.1084/jem.20021690. [DOI] [PMC free article] [PubMed] [Google Scholar]
- Reinhardt RL, Khoruts A, Merica R, Zell T, Jenkins MK. Visualizing the generation of memory CD4 T cells in the whole body. Nature. 2001;410:101–105. doi: 10.1038/35065111. [DOI] [PubMed] [Google Scholar]
- Roers A, Siewe L, Strittmatter E, Deckert M, Schluter D, Stenzel W, Gruber AD, Krieg T, Rajewsky K, Muller W. T cell-specific inactivation of the interleukin 10 gene in mice results in enhanced T cell responses but normal innate responses to lipopolysaccharide or skin irritation. J Exp Med. 2004;200:1289–1297. doi: 10.1084/jem.20041789. [DOI] [PMC free article] [PubMed] [Google Scholar]
- Roman E, Miller E, Harmsen A, Wiley J, Von Andrian UH, Huston G, Swain SL. CD4 effector T cell subsets in the response to influenza: heterogeneity, migration, and function. J Exp Med. 2002;196:957–968. doi: 10.1084/jem.20021052. [DOI] [PMC free article] [PubMed] [Google Scholar]
- Rubtsov YP, Rasmussen JP, Chi EY, Fontenot J, Castelli L, Ye X, Treuting P, Siewe L, Roers A, Henderson WR, Jr., et al. Regulatory T cell-derived interleukin-10 limits inflammation at environmental interfaces. Immunity. 2008;28:546–558. doi: 10.1016/j.immuni.2008.02.017. [DOI] [PubMed] [Google Scholar]
- Rudensky A, Rath S, Preston-Hurlburt P, Murphy DB, Janeway CA., Jr. On the complexity of self. Nature. 1991;353:660–662. doi: 10.1038/353660a0. [DOI] [PubMed] [Google Scholar]
- Sakaguchi S, Sakaguchi N, Asano M, Itoh M, Toda M. Immunologic self-tolerance maintained by activated T cells expressing IL-2 receptor alpha-chains (CD25). Breakdown of a single mechanism of self-tolerance causes various autoimmune diseases. J Immunol. 1995;155:1151–1164. [PubMed] [Google Scholar]
- Seery JP, Carroll JM, Cattell V, Watt FM. Antinuclear Autoantibodies and Lupus Nephritis in Transgenic Mice Expressing Interferon gamma in the Epidermis. J. Exp. Med. 1997;186:1451–1459. doi: 10.1084/jem.186.9.1451. [DOI] [PMC free article] [PubMed] [Google Scholar]
- Shi HZ. Eosinophils function as antigen-presenting cells. Journal of leukocyte biology. 2004;76:520–527. doi: 10.1189/jlb.0404228. [DOI] [PubMed] [Google Scholar]
- Slifka MK, Rodriguez F, Whitton JL. Rapid on/off cycling of cytokine production by virus-specific CD8+ T cells. Nature. 1999;401:76–79. doi: 10.1038/43454. [DOI] [PubMed] [Google Scholar]
- Suffia IJ, Reckling SK, Piccirillo CA, Goldszmid RS, Belkaid Y. Infected site-restricted Foxp3+ natural regulatory T cells are specific for microbial antigens. J Exp Med. 2006;203:777–788. doi: 10.1084/jem.20052056. [DOI] [PMC free article] [PubMed] [Google Scholar]
- Sun CM, Hall JA, Blank RB, Bouladoux N, Oukka M, Mora JR, Belkaid Y. Small intestine lamina propria dendritic cells promote de novo generation of Foxp3 T reg cells via retinoic acid. J Exp Med. 2007;204:1775–1785. doi: 10.1084/jem.20070602. [DOI] [PMC free article] [PubMed] [Google Scholar]
- Tang Q, Bluestone JA. The Foxp3+ regulatory T cell: a jack of all trades, master of regulation. Nature immunology. 2008;9:239–244. doi: 10.1038/ni1572. [DOI] [PMC free article] [PubMed] [Google Scholar]
- Thorstenson KM, Khoruts A. Generation of anergic and potentially immunoregulatory CD25+CD4 T cells in vivo after induction of peripheral tolerance with intravenous or oral antigen. J Immunol. 2001;167:188–195. doi: 10.4049/jimmunol.167.1.188. [DOI] [PubMed] [Google Scholar]
- Timoshanko JR, Holdsworth SR, Kitching AR, Tipping PG. IFN-gamma production by intrinsic renal cells and bone marrow-derived cells is required for full expression of crescentic glomerulonephritis in mice. J Immunol. 2002;168:4135–4141. doi: 10.4049/jimmunol.168.8.4135. [DOI] [PubMed] [Google Scholar]
- Valladeau J, Saeland S. Cutaneous dendritic cells. Seminars in immunology. 2005;17:273–283. doi: 10.1016/j.smim.2005.05.009. [DOI] [PubMed] [Google Scholar]
- Vincent-Schneider H, Thery C, Mazzeo D, Tenza D, Raposo G, Bonnerot C. Secretory granules of mast cells accumulate mature and immature MHC class II molecules. J Cell Sci. 2001;114:323–334. doi: 10.1242/jcs.114.2.323. [DOI] [PubMed] [Google Scholar]
- Wakim LM, Waithman J, van Rooijen N, Heath WR, Carbone FR. Dendritic cell-induced memory T cell activation in nonlymphoid tissues. Science (New York, N.Y. 2008;319:198–202. doi: 10.1126/science.1151869. [DOI] [PubMed] [Google Scholar]
- Wang B, Andre I, Gonzalez A, Katz JD, Aguet M, Benoist C, Mathis D. Interferon-gamma impacts at multiple points during the progression of autoimmune diabetes. PNAS. 1997;94:13844–13849. doi: 10.1073/pnas.94.25.13844. [DOI] [PMC free article] [PubMed] [Google Scholar]
- Yang J, Murphy TL, Ouyang W, Murphy KM. Induction of interferon-gamma production in Th1 CD4+ T cells: evidence for two distinct pathways for promoter activation. Eur J Immunol. 1999;29:548–555. doi: 10.1002/(SICI)1521-4141(199902)29:02<548::AID-IMMU548>3.0.CO;2-Z. [DOI] [PubMed] [Google Scholar]
- Yoshimoto T, Takeda K, Tanaka T, Ohkusu K, Kashiwamura S, Okamura H, Akira S, Nakanishi K. IL-12 up-regulates IL-18 receptor expression on T cells, Th1 cells, and B cells: synergism with IL-18 for IFN-gamma production. J Immunol. 1998;161:3400–3407. [PubMed] [Google Scholar]
Associated Data
This section collects any data citations, data availability statements, or supplementary materials included in this article.
Supplementary Materials
Supplemental Figure 1. Identification and cytokine production of adoptively transferred T cells. (A) Representative CD4 versus CD90.1 staining to identify TEa T cells from lymph nodes of a transfer recipient that did not receive antigen (left panel), draining cervical lymph nodes (middle panel), or the EαRFP/IFA injection site (right panel) from transfer recipients injected with EαRFP/IFA 12 days earlier. (B) CFSE histograms for TEa cells shown in (A). Data in (A) and (B) are representative of three independent experiments. (C) Intracellular IFN-γ (top left panel), TNF-α (top right panel), IL-5 (lower left panel) and IL-17 (lower right panel) staining in TEa cells in an EαRFP/IFA injection site 12 days following antigen injection.
Supplemental Figure 2. Characterization of Foxp3+ TEa T cell accumulation. (A) Isotype control (left panel) or intracellular Foxp3+ (right panel) staining of CD4+ T cells from a TEa TCR transgenic RAG1-deficient mouse. (B) Mean number ± SD (n=2/timepoint) of Foxp3− (closed squares) or Foxp3+ (open squares) TEa T cells in the draining lymph nodes of mice injected with EαRFP/IFA. The number of Foxp3− TEa cells was calculated by subtracting the number of Foxp3+ TEa cells from the total number of TEa cells. (C) Number of Foxp3+ TEa cells in the indicated injection site from individual TEa recipient mice (from 2 experiments) 12 days after injection of EαRFP/IFA in one ear and OVA/IFA in the other. *, P=0.04
Supplemental Figure 3. IFN-γ production by TEa T cells in inflamed skin is not dependent on trafficking from the lymph node. B6 recipients of TEa T cells were injected with EαRFP/IFA in both ears and either 8 or 11 days later injected i.p. with an S1P1 receptor agonist to block TEa lymph node egress. Ears and blood were harvested 24 hours after agonist injection. (A) Scattterplot depicts TEa T cells as a percentage of total blood cells in vehicle (closed squares) or agonist (open squares) injected mice. (B) Intracellular IFN-γ in TEa cells in the injection site 9 or 12 days following antigen injection and 24 hours after vehicle (closed squares) or agonist (open squares) injection. n.s.=not significant. *, P=0.04
Supplemental Figure 4. Ablation of Langerin+ cells does not affect IFN-γ production by TEa T cells in inflamed skin. (A) Langerin-DTR mice were injected in the ear with 2W1S/IFA, then 11 days later with PBS (left panel) or DT (right panel). Representative CD11c versus Langerin-GFP plots are shown for CD11c+ cells from each group. (B) Scatterplot represents the percentage of Langerin+ cells within the CD11c+ population from injection sites of Langerin-DTR mice (identified as in (A)) injected with PBS (closed squares) and DT (open squares). Intracellular (C) IFN-γ and (D) IL-10 in Foxp3− or Foxp+ 2W1S:I-Ab-specific CD4+ T cells (identified as in Fig. 3E and F), respectively, in 2W1S/IFA injection sites 12 days following antigen injection and 24 hours after vehicle (closed squares) or DT (open squares) injection. n.s.=not significant. *, P=0.05