Abstract
Small animal magnetic resonance microscopy (MRM) has evolved significantly from testing the boundaries of imaging physics to its expanding use today as a tool in non-invasive biomedical investigations. This review is intended to capture the state-of-the-art in MRM for scientists who may be unfamiliar with this modality, but who want to apply its capabilities to their research. We therefore include a brief review of MR concepts and methods of animal handling and support before covering a range of MRM applications including the heart, lung, brain, and the emerging field of MR histology. High-resolution anatomical imaging reveals increasingly exquisite detail in healthy animals and subtle architectural aberrations that occur in genetically altered models. Resolution of 100 µm in all dimensions is now routinely attained in living animals, and 10 µm3 is feasible in fixed specimens. Such images almost rival conventional histology while allowing the object to be viewed interactively in any plane. MRM is now increasingly used to provide functional information in living animals. Images of the beating heart, breathing lung, and functioning brain can be recorded. While clinical MRI focuses on diagnosis, MRM is used to reveal fundamental biology or to non-invasively measure subtle changes in the structure or function of organs during disease progression or in response to experimental therapies. The ability of MRM to provide a detailed functional and anatomical picture in rats and mice, and to track this picture over time, makes it a promising platform with broad applications in biomedical research.
Keywords: Magnetic, resonance, imaging, microscopy, rodent, rat, mouse, disease model
Introduction
Small animal imaging, both in vivo and ex vivo, has become increasingly important in biomedical, genetic, toxicologic, and pharmacologic research. The ability to spatially localize morphologic and functional changes in the organ systems of small animals has fostered a better understanding of embryonic development, genetic mutations, potential therapeutic treatments, and the effects of environmental insults. Being able to perform non-invasive repeated imaging in the same animal enables us to study the longitudinal progression of disease or treatment. The importance of small animal imaging is also illustrated by the increasing number of commercial imaging systems now available for most modalities.
It became evident in the early 1980s, when magnetic resonance imaging (MRI) started being used clinically, that it offered a rich contrast capable of displaying many physical characteristics of soft tissues. Because of that advantage of MRI compared to x-rays, with its contrast relying solely on differences in organ tissue density, considerable effort has been devoted to adapting clinical MRI for small animal studies. The extension of MRI to magnetic resonance microscopy (MRM), however, has not been straight-forward. It required image resolution to be increased at least 10-fold in all three dimensions, resulting in signal reductions of at least a factor of 1000. Overcoming this deficit required developing specific technology for MRM — magnets, imaging coils, image acquisition sequences, and biological support geared toward small animals. Relative to clinical MRI, small animal MRM poses many additional challenges. An animal in the bore of a physically large and strong magnet is no longer directly accessible to the investigator and thus, physiologic monitoring and delivery of agents to the animal must be done remotely. The strong magnetic field restricts the use of certain types of equipment, particularly those containing ferrous materials or motors. Furthermore, electrical recordings like those for cardiac monitoring are distorted by the radiofrequency pulses and gradients used for imaging. These problems are also associated with clinical MRI, but are exacerbated by the large gradients and small bores of animal scanners. A further issue is that biological motion, including that of the heart and lung, must be carefully controlled to avoid pronounced artifacts. Finally, the costs of purchase and maintenance of MR scanners far exceed most other imaging systems. However, the unique and exceptionally valuable information that can be derived from MRM makes it worth the investment.
The tissue contrast and spatial resolution now attainable by MRM is unrivaled by other modalities and since MRM is inherently digital and can be three-dimensional (3D), images of whole animals or organs can be viewed in virtually any plane. Functional studies can be performed with the aid of physiologically controlled imaging sequences that can be synchronized with the injection or inhalation of contrast agents, or with the desired phase of the cardiac cycle. The ability to use MRM to non-invasively study a single animal over a prolonged course of disease development and treatment can eliminate the need to sacrifice animals, thereby reducing the number of animals needed.
The intent of this article is to provide a basic overview of MRM, how it works, how it is used for small animal imaging, and its broad range of applications for pre-clinical studies. The examples we provide are drawn primarily from our own laboratory and are by no means exhaustive, nor do they represent the excellent science being pursued by other imaging laboratories. The article is intended to give the reader an understanding of the capabilities of MRM and what components must be put in place to extract maximum value from this modality. Suitable references are included throughout the text to ensure that interested readers can review the field in greater detail.
Overview of Magnetic Resonance Imaging
To appreciate the opportunities and limitations of MRM, a basic introduction to the fundamentals of magnetic resonance imaging is useful (Bushberg 2001; Haacke 1999; Hornak 2006). First, it is important to understand the source of signal in MRI, which originates from the tiny nuclear magnetic moments of the constituent atoms and molecules that make up the object to be imaged. The most commonly detected nuclei, including some that are not native but can be administered, are: 1H, 3He, 13C, 17O, 19F, 23Na, 31P, and 129Xe. The proton, 1H, is the nucleus used for anatomical imaging given its abundance in tissues (slightly less than the 110 mol/liter concentration in pure water) and large magnetic moment. The other nuclei are useful for functional and metabolic imaging in a wide range of applications, and we will discuss 3He and 129Xe later in this article.
The MR scanner used detect and spatially localize these nuclei consists of several major components. A powerful static magnetic field (B0) is used to create alignment of the nuclei, and to determine their detection frequency. A radiofrequency (rf) coil surrounding the sample is used to elicit and receive the nuclear magnetic signal. Gradient coils are used to encode the spatial distribution of the nuclei. Finally, a computer synchronizes the application of rf pulses, switching of gradients, reading and digitization of signal, image reconstruction, and image display.
The first step of an MR scan is to place the sample in a magnetic field B0, which provides an axis for the nuclei to align along or against. In addition to providing an alignment axis, B0 also causes the nuclei to precess around it. (To envision precession, think of a child's spinning top, its axis tilted slightly away from the vertical axis, and tracing an orbit around it). Precession occurs at a precise frequency that is determined by the size of the nuclear magnetic moment and the intensity of B0 — 63 MHz for protons at 1.5 Tesla (T) and 500 MHz for protons at 11.7 T, one of the highest magnetic fields commonly available. Although, all nuclei precess at the same frequency, they do not do so in the same direction. If they are aligned with B0, they precess in one direction, and if the nuclei are aligned against B0, they precess in the opposite direction. This causes the eventual signals of the nuclei to exactly cancel unless the population of one state exceeds the other. Fortunately, it is slightly more energetically favorable for nuclei to align along B0 rather than against it and this population imbalance is called nuclear polarization. It is typically just a few parts per million in even the strongest magnetic fields and this lack of cooperation among nuclei is one reason MRI is less sensitive than some other imaging modalities. (A new class of imaging agents, called hyperpolarized materials overcomes this problem and will be discussed later.) Collectively, the polarization, density, and strength of the nuclear magnetic moments are referred to as the nuclear magnetization, and this is the signal source in MRI.
The magnetization that forms along B0 is called longitudinal magnetization and to be detected, its orientation must made transverse to B0 at which point the changing flux resulting from its precession induces a voltage in the surrounding rf coil (Faraday’s law). The rf coil is used to convert longitudinal into transverse magnetization through application of electromagnetic energy to the nuclei by means of a rf pulse. For the pulse to affect the nuclei, its frequency must closely match their precession frequency and this is the resonance in MRI.
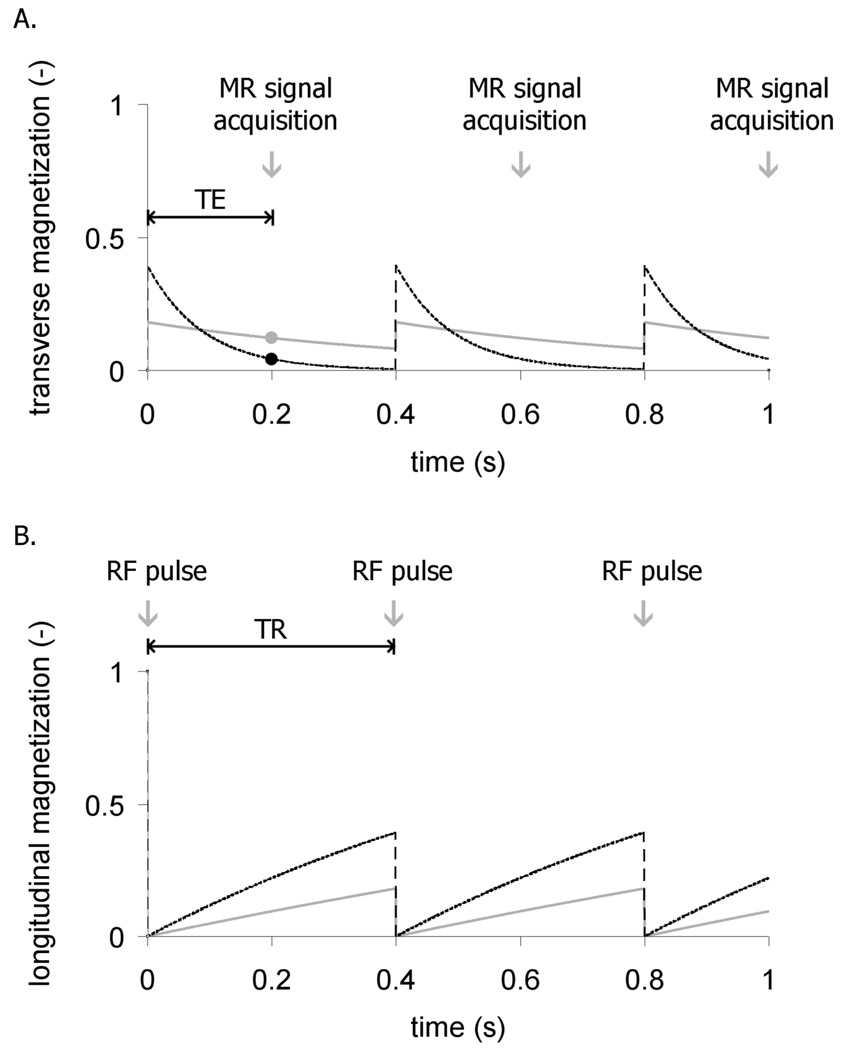
The transverse magnetization, along with its associated signal, does not persist indefinitely. It decays exponentially with a time constant T2 that is determined by the physical and chemical attributes of the particular tissue. For example, the T2 of the liver at 1.5 T is 40 ms, whereas the T2 of fat exceeds 60 ms. These T2 differences can be used to distinguish the tissues by waiting a suitable delay time before recording the signal. This delay is known as the echo time (TE). For the example of liver imaging, TE can be set to 30 ms at which time the liver signal will have decayed, whereas fat signal will remain intense. Such contrast is called T2-weighting and is illustrated in Figure 1A.
Figure 1.
Repetition time (TR) and echo time (TE) can differentiate tissues depending on their T1 and T2 values. (a) A 90° rf pulse converts the longitudinal magnetization into transverse magnetization to generate an imaging signal. The signal acquisition is delayed by an echo-time TE to distinguish tissues with different T2 values. In this example, a tissue with short T2 (dashed black line) diminishes quickly before the signal is recorded (black dot) while the tissue with a long T2 (solid gray) retains more signal (gray dot). (b) The radiofrequency excitation occurs every TR, creating transverse magnetization (signal), but depleting longitudinal magnetization which recovers with exponential time constant T1. In this example, white matter with T1 = 0.8 s (dashed black) recovers more quickly than cerebrospinal fluid with T1 = 2 s (solid gray).
To turn the magnetic resonance signal and contrast into an image, the spatial variation of the transverse magnetization must be captured. This is done by exploiting the linear dependence of the nuclear resonance frequency on magnetic field strength. Applying a magnetic field that varies linearly as a function of position (a gradient) causes the resonance frequencies across the sample to be dispersed. The frequency dependence of the signal acquired in the presence of a linear gradient describes the spatial variation of the sample in one dimension. The image is then built up into two and three dimensions by acquiring many such signals, while encoding-gradients are applied in three orthogonal directions to capture the full structure of the object. Image acquisition therefore requires many repeated rf excitations and signal read-outs to fully encode the 3D structure of a sample line by line. For example, assembling a 3D image resolved into 256×256×256 pixels requires 2562 rf excitations to acquire 2562 image lines of 256 points each, which can take considerable time.
The repeated application of rf pulses introduces careful timing considerations that also affect image contrast — specifically the pulse repetition time (TR) and flip angle. For example, a 90° flip angle rotates all the longitudinal magnetization into the transverse plane and generates the largest possible signal, while leaving no magnetization along B0 for the next pulse. A smaller flip angle pulse produces less transverse magnetization, but leaves more longitudinal magnetization for the next pulse. If a very large flip angle is used (like 60–90°) then the next pulse must be delayed long enough for magnetization to grow back by longitudinal relaxation. This re-growth is characterized by the exponential recovery time constant T1, which, like T2, is also dependent on the physical and chemical attributes of tissues. For example, at a magnetic field of 1.5 T, the T1 of cerebrospinal fluid (CSF) is ~2 s, whereas the T1 of white matter in the brain is only 0.8 s. By applying 90° pulses at short TR intervals (~1s), magnetization in the CSF will not recover fully, whereas white matter magnetization will largely recover and be brighter in the image. Such contrast is called T1-weighting. Figure 1B shows an example of the different longitudinal magnetization recovery dynamics for these tissues.
Finally, to provide the reader the lexicon needed to interpret the magnetic resonance literature, we define a few additional parameters. A typical report might describe image acquisition as follows: FOV=10 cm2, slice=5 mm, matrix 128×256, bandwidth=62 kHz, flip=30°, TR/TE=100/5 ms. Here, field of view (FOV) represents the linear dimension of the square viewing area. The matrix tells us how many pixels are used to sample the FOV (resolution). Slice determines the resolution in the direction orthogonal to the image viewing plane. The receiver bandwidth determines how many pixels per second are acquired and is usually set to strike a balance between image noise and acquisition speed.
The Challenge of MR Microscopy
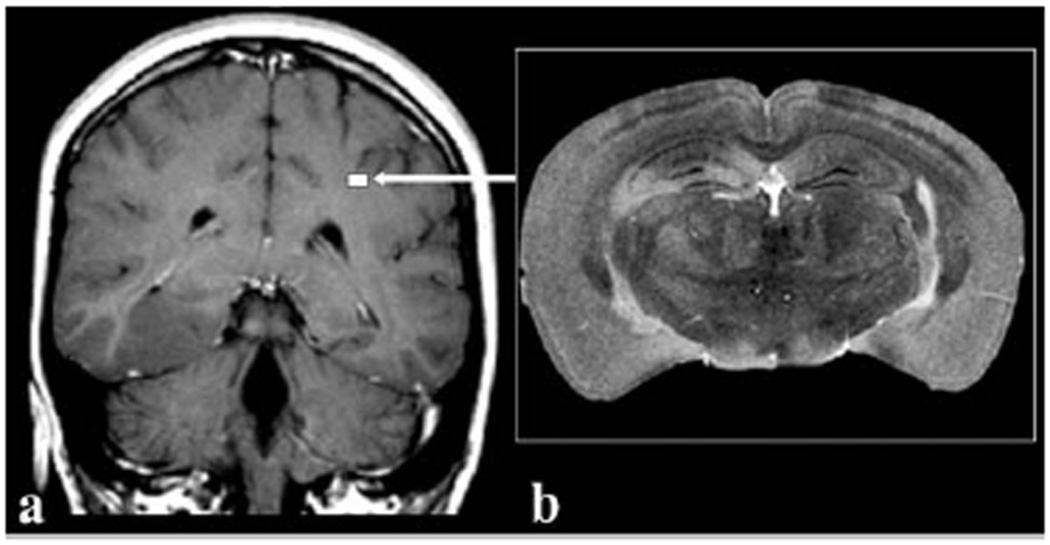
With the previous introduction to magnetic resonance, we are in a position to appreciate the challenges of MR microscopy. One of the most important aspects of any imaging modality is the signal-to-noise-ratio (SNR). It is readily apparent that the signal is decreased as the 3D pixel volume (voxel) is decreased as illustrated in Figure 2 depicting the striking difference in scale between a human brain and that of a mouse. For the mouse image to retain the same relative anatomical definition as the human image, it must be acquired with a voxel volume approximately 3,000-times smaller than that of a human and the accompanying signal loss must be won back. One method for increasing signal is to work at higher B0, which increases the signal frequency, and thus the signal voltage induced in the coil. Increasing B0 also improves signal by increasing the degree of nuclear polarization. Therefore, imaging at 7 T versus 1.5 T can theoretically win back as much as a factor of 5 to 15 in SNR, depending on sample size and dominant noise contribution. (The issue of SNR gain versus field strength is somewhat complex, and often theoretically expected gains are not realized experimentally (Beuf 2006)). However, the two most important ways for overcoming the signal deficits of MRM are by optimizing the rf coil design and employing longer image acquisition times. Extending imaging times introduces the need for precise physiological control to prevent biologic motion from causing image artifacts. Microscopic MR imaging also requires renewed attention to the gradient system. The gradients needed to create sufficient resonance frequency dispersion to resolve the pixels across a 4 cm mouse FOV are 10 times larger than those required to resolve the pixels in a 40 cm human FOV. Therefore, it is not possible to perform MRM on a clinical scanner by simply typing in the desired resolution. A dedicated MR microscope is necessary with the strong and rapidly switching gradient systems needed to attain high resolution.
Figure 2.
Comparison of (a) a clinical MR image of a 5-mm thick slice of human brain imaged at 1×1 mm2 in-plane resolution compared to (b) a 40 µm thick slice of a mouse brain imaged at 40×40 µm2 resolution. The size of the mouse brain relative to the human brain is depicted by the white square (arrow). The voxels in the mouse brain image represents a volume 80,000 times smaller than the voxels in the clinical image. Reproduced with permission from Maronpot, Tox Path 2004.
Imaging Coils
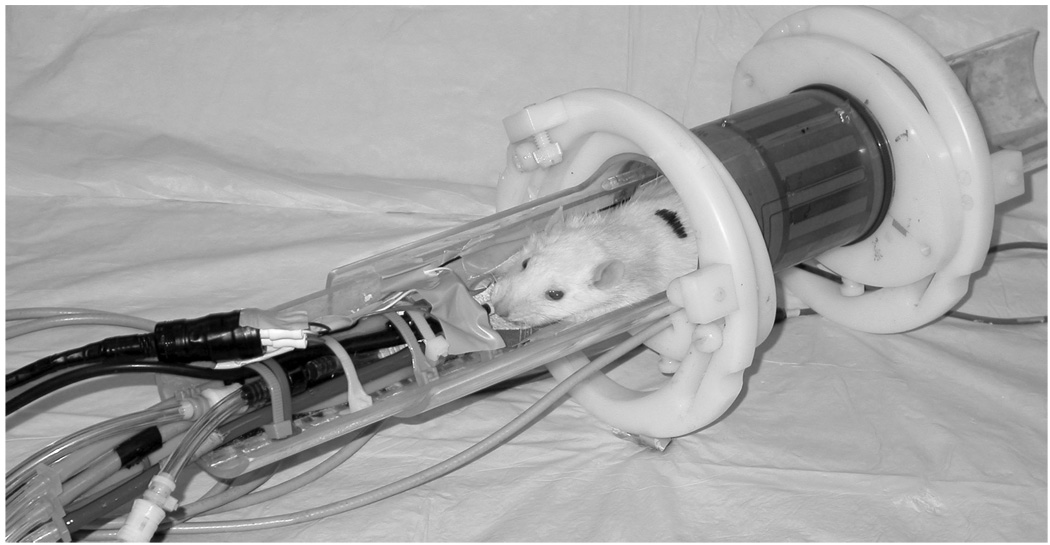
Perhaps the most critical determinant of imaging performance is the radiofrequency coil (Doty 2007), which drives both signal excitation and reception. Good coils can yield significant signal gains when they are designed to be as small as possible while still covering the anatomical region of interest. The coil’s sensitivity decreases with the square root of its volume. Consequently, reducing coil dimensions from clinical to MR microscopy scales can improve SNR by a factor of 20. The coil of choice for most live whole-body imaging of rats and mice is the bird cage coil (Hayes 1985). Such a coil, used for rat imaging, is shown in Figure 3. Coil size can be further reduced for additional sensitivity gains — a dedicated head coil for brain imaging, or a surface coil for cardiac imaging. Coil dimensions can be reduced to extremes as shown by Summers et al., who implanted an inductively coupled 5 mm diameter coil around the carotid artery of a rat to visualize the development of stenosis (Summers 1995). It is also possible to assemble multiple, high-sensitivity surface coils into larger phased arrays (Gareis 2007), which can deliver high SNR over large regions of interest such as the spine (Beck 2001). Alternatively, phased array technology can accelerate imaging speed, although this is less common in MRM than in clinical MRI. Another advantage in MRM versus clinical MRI is that up to moderate frequencies (200 MHz) the image noise is largely determined by the electrical noise of the coil rather than noise created by the sample (Black 1993; Edelstien 1986). The noise contributed by the coil is directly related to its resistive energy dissipation, which is characterized by its quality factor (Q). A high Q means the coil dissipates little energy and contributes little noise. Q values are generally higher for MRM than clinical MRI (300 vs. 50) and this translates into another factor of 2–3 SNR gain. Further gains in Q can be attained by cooling the coils to cryogenic temperatures and such coils are becoming available commercially (Bruker Biospin, Billerica, MA). In fact, extreme gains in Q are possible by using superconducting materials (Darrasse 2003), and this area of research will be discussed in a later section.
Figure 3.
A 250 g rat prepared for imaging in a 2 T system using a 6 cm diameter bird cage coil. The animal is lying on a Plexiglas cradle and is anesthetized with isoflurane delivered by mechanical ventilation. The hoses to the left are for ventilation gases and the black cables carry signals from ECG electrodes on the foot pads, airway pressure transducer on the breathing valve attached to the endotracheal tube, and body temperature from a thermistor in the rectum. The gray cable connects the coil to the MR scanner.
MR Contrast Agents
Beyond the technical factors and imaging physics, another valuable tool for enhancing the image quality and organ delineation in MRI is the use of contrast agents. Such agents can further accentuate tissue differences by altering the T1 and T2 relaxation times of protons in their vicinity. For example, in a 3 T field, the T1 of protons in blood is reduced from 1600 ms to 300 ms after administering a typical bolus of contrast agent. This T1-reduction highlights the blood vessels when images are acquired using a large flip angle and short TR (T1-weighted). The majority of T1-reducing contrast agents are based on the paramagnetic Gadolinium atom whose large magnetic moment results from its seven unpaired electrons (Caravan 1999). The Gadolinium atom must be chelated because it is toxic in the ionic form and is typically administered at a concentration of 0.1 mmol per kilogram of body weight to substantially alter contrast. Contrast agent development has progressed tremendously over the years with novel formulations and applications in vascular and molecular imaging (Querol 2006; Weissleder 2001). Contrast agents can be administered intravenously to improve small animal MRM by highlighting vascular changes or delineating tumors. An application of contrast media, specific to MRM, is to include them in solutions used to fix and “stain” entire specimens for high-resolution imaging.
Fixed Specimen Preparation and Imaging
While imaging the live, small animal is undoubtedly one of MRM’s most valuable capabilities, we begin our discussions with imaging of fixed specimens. The use of perfusion-fixation methods employing contrast media was introduced by Johnson et al., (Johnson 2002a; Johnson 2002b). These methods increase the achievable anatomic image resolution of MRM from ~100µm3 to 20µm3, allowing organs to be studied in superb detail. MRM of perfusion-fixed specimens rivals conventional microscopy because it is non-destructive, can be 3D, and is inherently digital. Furthermore, since the specimens do not have to be dehydrated, as is the case for many conventional histology processes, MRM images show the natural distribution of water in tissues and organs. MRM of specimens achieves the highest resolution partly because of lack of biologic motion and because imaging times can be extended for maximum resolution without concern for survival. Thus, for many types of studies, MRM of specimens can improve imaging throughput by eliminating the maintenance and monitoring needed for the live animal.
MRM requires specialized specimen preparation techniques to achieve maximum resolution and tissue/organ contrast and structural definition. For instance, organs in a formalin-fixed specimen reveal relatively little structural detail, whereas exquisite anatomic detail becomes apparent with the aid of MR contrast agents specifically applied to stain the specimen (Figure 4). Staining is achieved using solutions containing both a fixative and a Gd-based contrast agent. The fixative is either Bouin’s (LabChem, Pittsburg, PA) or 10% neutral buffered formalin (Form) and the contrast agent is ProHance (Bracco Diagnostics, Princeton NJ). We abbreviate these fixative/staining solutions as Bouins-Gd and Form-Gd and each are mixed in a volume ratio of 20:1. An important distinction from conventional histologic methods is that MRM achieves fixation and staining with a single solution. These staining solutions are delivered to the various organ systems in the body by several different methods, as discussed below, such as immersion (Petiet 2007), bulk injection, and vascular perfusion. The choice of method depends on the particular organ system and stage of development.
Figure 4.
Coronal 2-mm-thick sections were acquired in a formalin-fixed specimen and a specimen stained with a 1:20 mixture of gadopentetate dimeglumine and formalin. At TR of 100 ms, the gain in signal-to-noise ratio is five-fold for all tissues except fat. Reprinted with permission from Johnson, Radiology 2002.
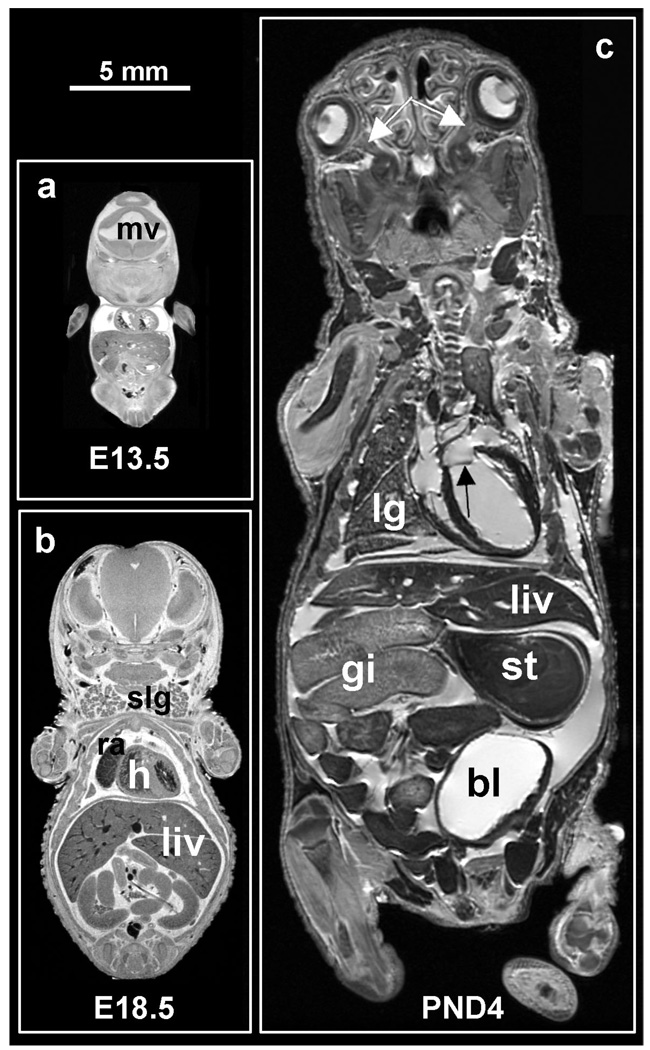
One example illustrating the power of fixed specimen imaging is in studying pre-and post-natal development. This capability, especially in mice, offers a unique opportunity to study normal development, as well as teratologic and toxicologic processes. Rat and mouse embryos and fetuses are harvested from the anesthetized dame, cooled, and immersed in a solution of cold Bouins-Gd. The solution penetrates the entire specimen sufficiently during the early stages of development (up to 18 days gestation) to achieve complete fixation and staining. Examples of imaging fixed pre-natal stage embryos are shown in Figure 5a and b depicting embryonic (E) day E13.5 and E18.5. At the earliest stage, relatively little organ differentiation has occurred and it is difficult to identify structures, although mesencephalic vesicle, cardiac, and hepatic structures are apparent at E13.5. At later stages (E18.5), familiar structures clearly emerge: the left and right ventricles of the heart, right atrium, liver, and salivary glands Being able to image the whole body at these early stages of development is particularly important for following animals having lethal pre-natal mutations.
Figure 5.
Sample mid-coronal slices of (1) a 13.5-day embryo, (b) an 18.5-day fetus, and (c) a 4-day pup. The two pre-natal specimens were prepared by immersion in Bouins fixative with MR contrast ProHance (20:1, v/v), and the post-natal specimen was prepared by ultrasound-guided trasncardial perfusion of fixative and stain. All three specimens show the liver (liv), parts of the gastro-intestinal tract (gi), and left and right ventricles of the heart (h). Notice that blood appears in the heart of the two pre-natal specimens, but not in the post-natal ones as it was flushed out during perfusion. The E13.5 embryo also shows the mesencephalic vesicle (mv), a precursor of brain’s ventricular system. The E18.5 fetus shows the right atrium (ra), and salivary glands (slg). The PND4 shows part of the right lung (lg), the bladder (bl), and the stomach (st) as well as much smaller structures such as the left/right optic nerves (white arrows) and the mitral valve (black arrow). All three specimens were imaged in a 9.4 T scanner, using a matrix size of 1024×512×512, TR/TE = 75/5.2 ms. The two pre-natal specimens were scanned at an isotropic resolution of 19.5µm3 in a time of 6h 22 min, and the post-natal specimen was scanned at an isotropic resolution of 39µm3 in a time of 3 h 11 min.
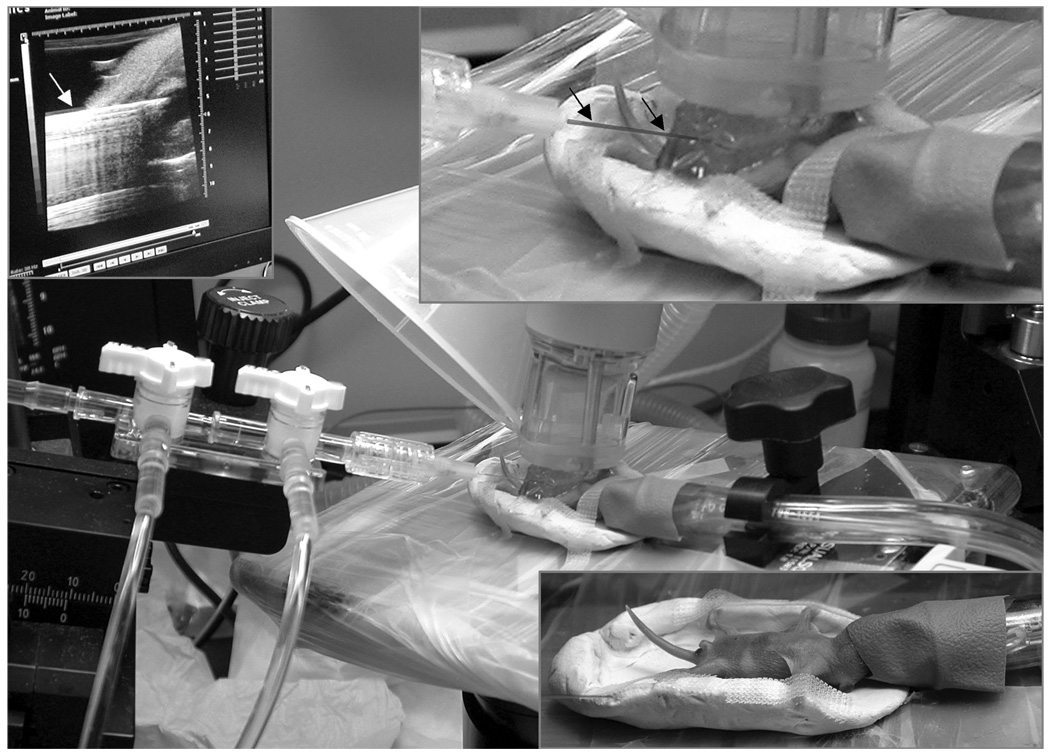
Staining by immersion becomes more difficult with neonates and fetuses older than 18 days as the integument becomes impermeable to the fixative and staining solutions. For these ages and older, fixation and staining must be done either by direct injection into the intraperitoneal cavity or under the skin, or by using vascular perfusion. For neonates, ultrasound is used to guide the percutaneous insertion of the catheter in the left ventricle as shown in Figure 6 (Zhou 2004). This method avoids damaging the thorax, such as occurs when performing a thoracotomy to access the left ventricle. Perfusion begins with a mixture of 0.9% saline and ProHance (Sal-Gd, 20:1, v/v) and continues with Form-Gd. The perfusate is then drained via cuts in the jugular veins, femoral veins, and arteries of the legs. An exemplary image of a 4-day neonate prepared by this method is seen in Figure 5c. This kind of high-resolution MRM of fixed mouse neonates provide 3D anatomical detail of structures that complements information available from traditional histology. Note, in addition to many major organs, small structures are visible, including the optic nerves, and the mitral valve (white and black arrows respectively, in Figure 5c). Such detail is valuable in studying embryonic heart development, for example, where numerous mouse models are available (Bamforth 2004; Schneider 2003) to examine one of the major causes of pre-natal deaths in humans.
Figure 6.
Perfusion fixation/staining method for neonatal mice. The primary image shows the post-natal day 4 mouse (2.2 grams), lying in a cradle (lower right inset). Surgical anesthesia is maintained by isoflurane delivered by the purple nose-cone shroud. Immediately above the mouse’s chest is a layer of gel and an ultrasound transducer (40 MHz). On the left are the hoses for saline flush and formalin fixation, which are attached to a 30-gauge catheter inserted into the left ventricle, and supplied by a syringe pump. The upper left inset shows the monitor display from the ultrasound system (VisualSonics, Toronto, CA) showing that the catheter (white arrow) has penetrated the chest wall and the tip is in the left ventricle. The upper right inset shows a closer view of the catheter (black arrows) insertion through the gel, into the left ventricle with the US probe above.
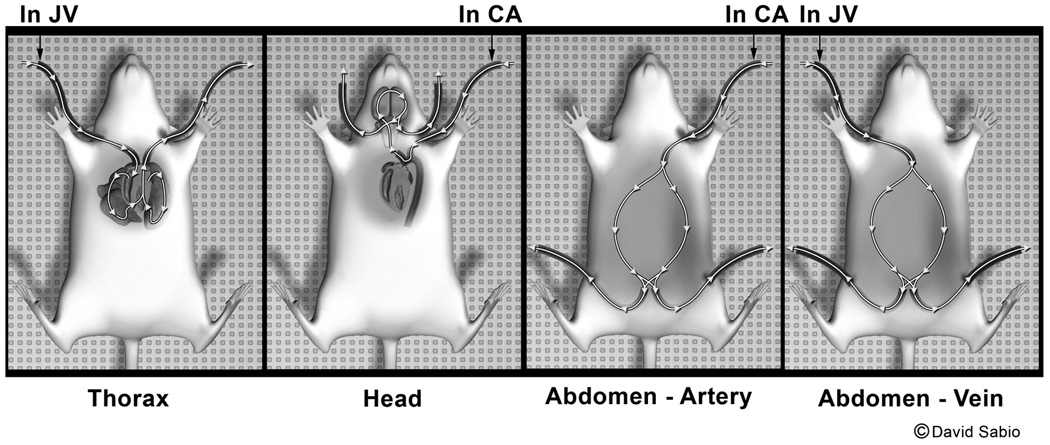
Fixation and staining methods can also be adapted to prepare adult rats and mice for whole body MRM. Adult animals are perfused and stained via the peripheral blood vessels to avoid invasion of major body cavities, which would disturb the anatomy of internal organs. Perfusion uses two solutions, previously described (Sal-Gd and Form-Gd), and begins with placing catheters in the right jugular vein and left carotid artery, and then injecting heparin through the jugular catheter to ensure that blood clotting will not occur during the perfusion process. Then a solution of warmed Sal-Gd (36 to 37° C) is infused into the jugular catheter with the aid of a peristaltic pump, while blood is withdrawn from the carotid artery as illustrated in Figure 7. This step clears blood from the heart and lungs following the normal direction of blood flow. Next, Sal-Gd and Form-Gd are sequentially perfused into the left carotid artery and the fluid is drained from a cut of the cranial end of the right jugular vein. This step ensures clearance of blood and fixation and staining of the head. Next, Form-Gd is pumped into the left carotid artery with primary drainage from the femoral arteries in the legs. This step provides for antegrade flow through the abdominal arterial system. Finally, Form-Gd is pumped into the right jugular vein for fixation and staining of the cardiopulmonary and abdominal structures, primary drainage being from the femoral vessels. This stepwise process ensures that all major body organs are fixed and stained without structural damage.
Figure 7.
Perfusion fixation/staining method for rats and mice. Catheters are inserted in the right jugular vein and the left carotid artery. The animal is heparinized and then jugular vein infusion begins with saline/gadolinium (Sal-Gd) while blood is simultaneously withdrawn from the carotid artery to flush the cardiopulmonary system (thorax panel). Second, the head is flushed and fixed by infusion of Sal-Gd followed by formalin/gadolinium (Form-Gd) into the left carotid artery, with drainage from the cranial jugular veins (head panel). Third, infusion of Form-Gd continues into the carotid artery with drainage from the femoral arteries (abdomen – artery panel). Finally, infusion of Form-Gd continues into the jugular vein (right) with drainage from the femoral vessels (abdomen – vein panel).
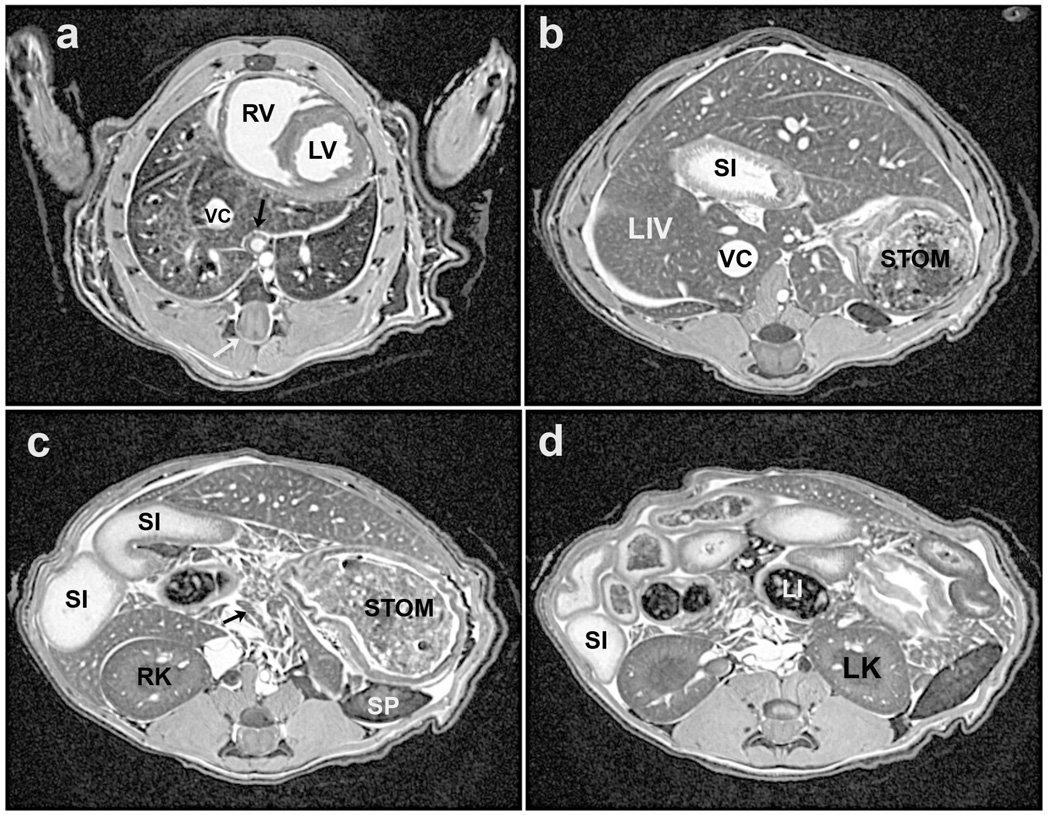
A normal, perfusion-fixed/stained C57BL/6 mouse (19 g) is shown in Figure 9 depicting four out of 2048 contiguous axial slices through the entire body and illustrating major structures of the thorax and abdomen. This specimen was imaged in a 7 T MR scanner at a 3D isotropic resolution of 63 µm. All of the 2048 image slices are available in the computer to view slice-by-slice, which is particularly valuable to follow the course of tubular structures such as major systemic blood vessels, pulmonary airways and vessels, and the intestinal tract. Because the image voxels are isotropic, the images can also be viewed in the coronal and sagittal planes. Having the whole body to view in digital form can be valuable in morphologic phenotyping of different genetically altered mouse strains, for detecting metastatic tumors, and toxicology studies, to name but a few applications (Johnson 2002b; Maronpot 2004).
Figure 9.
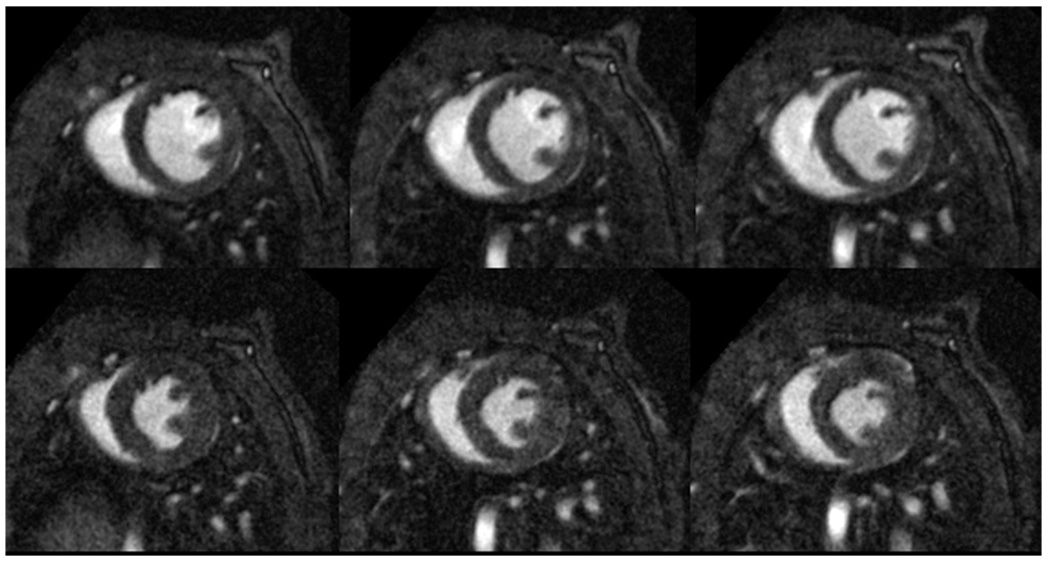
Three short-axis slices of a 3D acquisition of a C57BL/6 mouse heart in diastole (top row) and systole (bottom row). Resolution is 87×87×348 µm3 and total acquisition time for the 4D (3D, plus time) dataset was 15 minutes. Note the excellent contrast between blood and myocardium that allows for the visualization of papillary muscles and interior structure in the heart.
Animal Preparation, Support, and Monitoring for In Vivo MRM
Without a doubt, imaging of live animals is one of the most important advantages of MRM. In vivo imaging also introduces the most significant obstacle for achieving microscopic resolution, specifically biologic motion. Both gross body movement and motion originating from cardiac and breathing activity must be controlled. Combined with the longer image acquisition times needed to attain high resolution, such motion not only produces imaging blurring, but can also result in artifacts due to spatial encoding errors because the same anatomic structures occupy different positions during the scan. These artifacts are often seen as “ghost” artifacts, faint images of the entire structure, which can significantly obscure anatomic detail. Hence, during imaging, the animal must be still and must be restrained from making gross body movements, such as crawling out of the magnet, and this restraint is achieved by using anesthesia. However, anesthetics have the undesirable effect of interfering with body temperature control (Flecknell 1987) and, consequently, the animal can quickly lose body heat, especially in the cold bore of the magnet. To avoid reduced body temperature, exogenous heat must be supplied and to maintain normal physiologic status and ensure survival, the animal’s vital signs must be monitored. Therefore, the basic principle of animal preparation for MR imaging involves anesthesia, body temperature support, and physiologic monitoring. Additional support and control may be required depending on the nature of the study, such as respiratory support using mechanical ventilation and gating triggers to synchronize image acquisition with breathing and cardiac motion. Achieving support, monitoring, and control in the MR imaging environment presents significant obstacles not associated with other modalities — strong magnetic fields, rapidly switching gradients, and inaccessibility of the animal during imaging. These conditions usually mean that most conventional animal monitoring and support devices cannot be used or must be significantly modified, although in the past few years, MR-compatible equipment has become commercially available (SA Inc, Stony Brook, NY; CWE, Ardmore, PA) to make support and monitoring easier to manage.
Anesthetics for chemically restraining animals can be either inhalational or injectable. Inhalational anesthesia has the major advantage of ease of control, such as with isoflurane (Halocarbon Products Corp, River Edge, NJ), which is rapidly taken up by pulmonary circulation and delivered to the central nervous system for effect (Brunson 1997). Because gas exchange occurs quickly, changes to anesthesia level can be made quickly and recovery from inhalational anesthesia is rapid once delivery is stopped. Inhalational anesthesia can be administered either by nose cone or by mechanical ventilation. Controlling anesthesia level requires a calibrated vaporizer, which is relatively easy to attach to a nose cone using a flow and pressure regulator. This is a convenient route of delivery, since rats and mice are obligate nose breathers. Delivery of isoflurane by mechanical ventilation is somewhat more complicated, requiring an MR-compatible ventilator (Hedlund 2002) and endotracheal intubation either by tracheostomy or transorally (Costa 1986; Thet 1983). The combination of mechanical ventilation and endotracheal intubation is also essential for delivery of hyperpolarized gases for lung imaging (Hedlund 2002), as described later. Mechanical ventilation has the further advantage of mitigating the respiratory depressive effects of anesthesias. If mechanical ventilation is used for longitudinal survival studies, intubation should be done perorally. Endotracheal intubation tubes can be fashioned from intracatheters (Quick-Cath, Baxter Healthcare Corp, Deerfield, IL) cut to the proper length. Intubation is accomplished using 16–18 gauge for rats and 20–24 gauge for mice. First, the anesthetized animal is placed supine on a 45° slant board and its mouth held open with the aid of a laryngoscope blade equipped with a fiber-optic light. The endotracheal tube is then inserted between the vocal cords as the animal inhales. To intubate a mouse, a strong fiber-optic lamp is positioned on the ventral surface of the neck to illuminate the oropharynx while the endotracheal tube is inserted into the trachea between the vocal cords.
Injectable anesthesias are an appropriate alternative to inhalational anesthesia, and while easier to administer, they are more difficult to control. Intraperitoneal (IP) injection is the most common route for induction of anesthesia and also allows for delivery of maintenance doses. Responses to IP injection of anesthesia are inherently slower than pulmonary uptake of gaseous anesthesia due to serosal membrane absorption and hepatic and renal elimination prior to these agents reaching the CNS. Injectable anesthesias can also be administered intravenously, for example, by a tail vein injection or indwelling catheter. Popular choices for injectables include methohexital for ultrashort procedures (less than 15 minutes); and pentobarbital combined with ketamine diazepam or ketamine xylazine for longer procedures. When using ketamine combinations, especially with xylazine, maintenance doses should be given with ketamine alone because of the risk of bradycardia effects from xylazine overdosage. For exact doses, routes and durations of injectable drugs, consult available sources (Flecknell 1987; Plumb 2005; Wixson 1997).
Regardless of the anesthesia used, the combination of the MR imaging environment, cryogenically cooled magnets, and depressive effects of anesthesia and loss of body temperature control requires a supply of exogenous heat. This is especially the case with anesthetized mice, whose large surface area-to-body-mass-ratio causes body temperature to fall rapidly, so support for body temperature must be continually provided. Effective temperature-control solutions for the table top are heat lamps with temperature feedback controllers (DigiSense, Cole-Parmer Instrument Co., Vernon Hills, IL) or microwavable heat pads (SnuggleSafe, Littlehampton, West Sussex, UK). When animals are placed in the magnet, their body temperature can be monitored by an endorectal thermistor, which provides feedback control for warm air directed through the bore (Qiu 1997).
To effectively maintain the physiologic status of the animal during imaging, the animal must be continuously monitored, at a minimum for body temperature, heart rate, and breathing rate. Custom systems can be made MR-compatible or commercial MR compatible systems are available for monitoring ECG, breathing, body temperature, and peripheral pulse (SA Inc, Stony Brook, NY). As long as body temperature is normal and constant, changes in cardiac or breathing rates can be used as indices of anesthesia level. Signs that additional anesthesia is required include increasing cardiac and/or breathing rates.
At the completion of imaging, recovery of the animal will be hastened by maintaining normal body temperature using heat lamps or heating pads. During this time, continued body temperature monitoring is essential to avoid overheating. Also, to ensure unobstructed breathing, aspiration of any excess fluid in the oral cavity may be needed. Because animals may become dehydrated during imaging and unable to drink afterwards, subcutaneous fluids (saline, lactated ringers) can be given to aid recovery.
A final issue of animal imaging support is that the animal must be physically supported in a stable, repeatable position. This is optimally accomplished using semi-circular cradles because the animal body is nominally cylindrical, as is the rf coil into which it will be inserted (Figure 3). Cradles can also be fashioned to include built-in nose cones for anesthesia delivery, ECG electrodes for heart monitoring, pneumatic pillows for breathing monitoring, and body temperature probes (Dazai 2004). Such physical support cradles with expanded monitoring capability can also facilitate faster animal set-up, and improve imaging throughput. Cradles can also facilitate multi-modality imaging by allowing the animal to be moved from one imaging system to another while maintaining monitoring, physiologic support, physical position, and ensuring image registration.
Cardiac MRM
Perhaps the organ that provides the greatest challenges for in vivo MR microscopy is the rodent heart. The first is simply size — the rat heart is about the size of the last segment of the human pinky and that of the mouse spans about the width of a pinky nail. Resolving a structure this small poses a significant SNR challenge, even in the absence of motion. However, the heart is anything but still, with normal heart rates ranging from 500–600 beats per minute for mice (100 milliseconds between beats), and 300 beats per minute for rats (200 milliseconds between beats). Compare these rates to the adult human heart rates of 60 beats per minute and the challenge becomes apparent. To image the heart without major artifacts, this cardiac motion must be “frozen” by acquiring image data during precisely timed intervals of the cardiac cycle (Cassidy 2004). Furthermore, since functional information is desired, the heart must be imaged at multiple phases, from systole to diastole. Finally, because image acquisition occurs over the course of many beats, the heart rate must be constant for the duration of the scan. An additional challenge is thoracic movement contributed by breathing that occurs in rodents with frequencies ranging from 60 to 120 breaths per minute.
One solution to these problems is to use MR acquisition sequences that are resistant to motion. For example, radial acquisition captures each line of image data within a fraction of a heart beat (1 ms), which makes such a sequence resistant to motion by virtue of its very short TE and TR (Brau 2004). A full image is then built up by using cardiac gating to acquire 800 or more image lines (for a 2D image) at the same phase of the cardiac cycle, thus effectively freezing the motion. The problem of SNR is addressed by using a small surface coil placed on the chest. The small size of a surface coil relative to a whole-body coil enhances its sensitivity and it is among the simplest coils to build. However, surface coils sacrifice some image homogeneity, which can be retained more effectively by more sophisticated designs such as the half bird cage coil (Fan 2006). To image the heart with both high spatial and temporal resolution requires exceptionally strong and rapidly switching gradients. We use peak gradients of 77 Gauss/cm, a nearly 50-fold increase compared those on a clinical system. When these techniques are employed, high-quality images of mouse hearts can be obtained and the 100 ms beat-to-beat cardiac cycle can be captured in as many as 40 phases. More typically only 10 phases are acquired, which reduces the effective temporal resolution but also shortens the time for image acquisition. This trade-off increases the available time window to acquire the image lines of each phase and hence the image is built up more quickly.
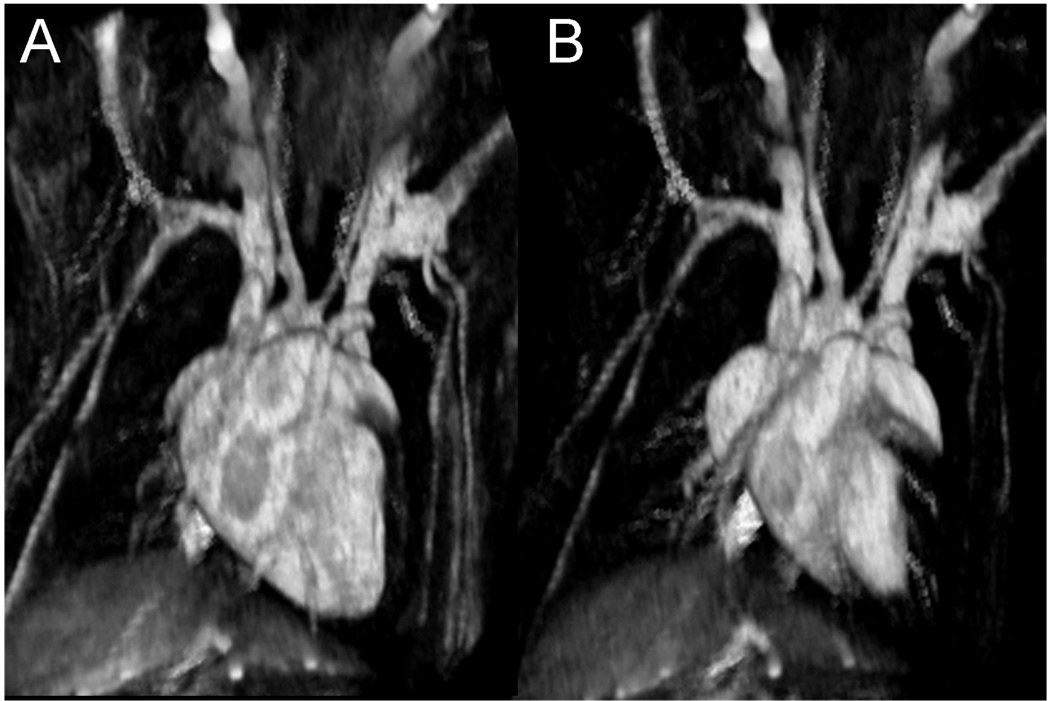
Initial work in imaging of cardiac function in the rodent focused on 2D imaging of a single slice through the heart (Brau 2004). 2D images showed excellent contrast between the blood and myocardium because fresh magnetization was continually carried into the image slice by the flowing blood. However, such magnetization in-flow is eliminated in the transition to 3D imaging because all tissues experience the rf pulses and hence, all magnetization is equally depleted. To differentiate the blood from myocardium in 3D imaging one solution is to supply a contrast agent that preferentially enhances blood over myocardium. A particularly useful agent for this is a novel gadolinium-based nanoparticle contrast agent (Ghaghada 2007). This agent, which remains preferentially in the blood and is not taken up by the myocardium, shortens the blood T1, while leaving the myocardium T1 unchanged. After the agent is injected, a T1-weighted image will show bright blood and dark myocardium as seen in Figure 9 depicting a 3D image of a C57 mouse heart. These images were acquired in 15 minutes with a spatial resolution of 87×87×348 µm3 and have an effective temporal resolution of 12.4 ms. Such images are readily appreciated in 3D volume renderings, shown in Figure 10.
Figure 10.
3D visualization of a C57/BL6 mouse heart at diastole (a) and systole (b). Note the reduced size of the left and right ventricle and the visualization of surrounding blood vessels in the heart.
Improved techniques for rodent cardiac MRM can now be used to extract cardiac performance parameters such as ejection fraction, end diastolic volume, and end systolic volume (Epstein 2002). Cardiac MRM, by virtue of its 3D nature, is beneficial for exact volumetric calculations of the blood and myocardium volumes (Ruff 1998). MRM is therefore advantageous compared to ultrasound methods that calculate these parameters from 1D measurements of the heart but require assumptions about the its 3D shape and skilled probe placement, both of which can lead to large error bars. Cardiac MRM and its associated quantitative power is particularly useful for phenotyping different mouse strains to show how genetic manipulation can result in valvular defects or septal malformations and associated functional changes (Nahrendorf 2006).
Imaging the Lung
The lungs are typically the last organs to yield quality images with relatively new imaging technologies. Not only are the lungs always moving, but the necessary signal source (water protons) is sparse because lungs consist largely of airspaces (80%) and little tissue (20%). The imaging challenge with MR is further exacerbated by the many air-tissue interfaces in the lung, which reduce the apparent T2 (known as T2*) to vanishingly small values (<1 ms). Nonetheless, MR imaging of the lung parenchyma is possible by using image acquisition strategies employing ultra-short TE (Gewalt 1993; Shattuck 1997). Beyond lung structure, however, our ultimate interest is in the function of the lung (gas exchange). Recent advances in MR imaging can now reveal the 80% of the lung that we normally do not see! The trick is using breathable gases that provide a strong MR signal.
The ability to visualize gases by MRI is surprising considering that gas is roughly 3000-times less dense than tissues, and this would generally result in 3000-fold SNR reduction. Indeed, most gases are ill-suited for MRI and yield little or no signal, though some heroic efforts involving fluorinated gases have borne fruit (Kuethe 1998). However, high-resolution gas imaging can be performed using the hyperpolarized (HP) gases – 3He and 129Xe. Their MR signals are dramatically enhanced by aligning their nuclear magnetic moments outside the MRI scanner to a level equivalent to what they would attain in a magnetic field of 150,000 T. The method used is called optical pumping and spin exchange, which works by transferring alignment from laser photons to nuclei via an intermediary alkali metal atom (Leawoods 2001). Once the nuclei are aligned, the hyperpolarized state can be preserved for hours or even days (van Beek 2003). The HP gas is then harvested from the device in a delivery bag and is administered to the animal by a custom-made ventilator (Chen 2003; Hedlund 2002). HP gas MRI can produce images of normal or impaired ventilation in humans and small animals in exquisite detail. A simple overview of 3He and 129Xe hyperpolarization for small animal pulmonary imaging was recently published (Driehuys 2007) and excellent clinical reviews are available (Leawoods 2001; Moller 2002; Salerno 2001).
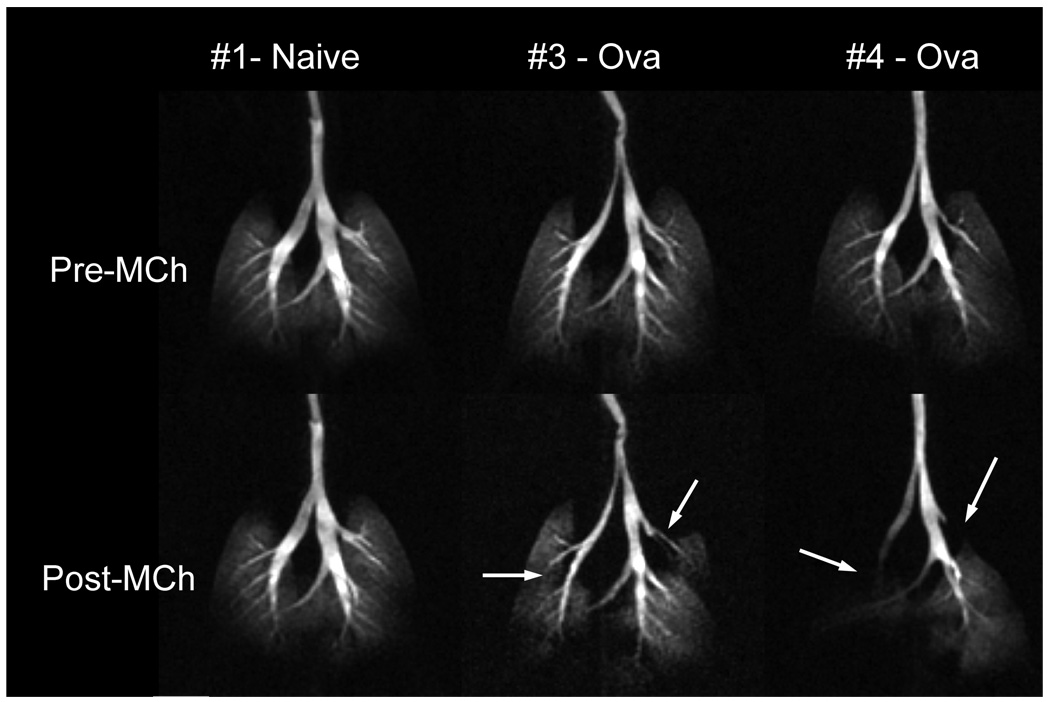
One of the most natural applications of gas imaging is to use it to visualize the altered distribution of ventilation in cases of pathology, such as asthma or emphysema. In human asthma, HP 3He has been used to visualize subtle and severe deficits in ventilation (Altes 2001) and to show that such ventilation defects can also be elicited through challenge with bronchoconstrictive agents such as methacholine (MCh) and subsequently reversed by administration of bronchodilators (Samee 2003). It is also desirable to extend HP 3He MRI to study the fundamental mechanisms of asthma in small animal models. This requires the ability to image and quantify (Spector 2005) the ventilation distribution in small animals with normal breathing and those who are challenged. Of particular interest is 3He imaging of mice where transgenic and knock-out techniques can be used to create physiologic phenotypes that either mimic human disease or test the involvement of certain pathways and receptors. Recently, we demonstrated 3D imaging of the 3He distribution at 125×125×1000 µm3 resolution in the lungs of a mouse model of asthma before and after challenge with MCh (Driehuys et al. 2007). After MCh challenge, imaging showed constriction of several major bronchi (Figure 11). Such regional information about specific airway involvement in the asthmatic response has never before been available and opens exciting avenues for translational research in this disease area.
Figure 11.
3D 3He images of three BALB/C mice represented as maximum intensity projections. Top row shows mice before and bottom row shows mice after challenge with 25µg/kg methacholine (MCh) to induce broncho-constriction. From left to right in the figure are one naive mouse and two mice sensitized to ovalbumin to exhibit asthma. The ova-sensitized mice respond to MCh with severe narrowing of several major airways. Such regional visualization of ventilation redistribution is a powerful new tool in asthma research. Images were acquired using a 3D radial sequence with 125×125×1000 µm3 resolution in a time of 5.8 min, FOV = 32×32×16 mm, matrix = 256×256×16, TR/TE = 5/0.2 ms. (Reprinted from Driehuys, Accepted)
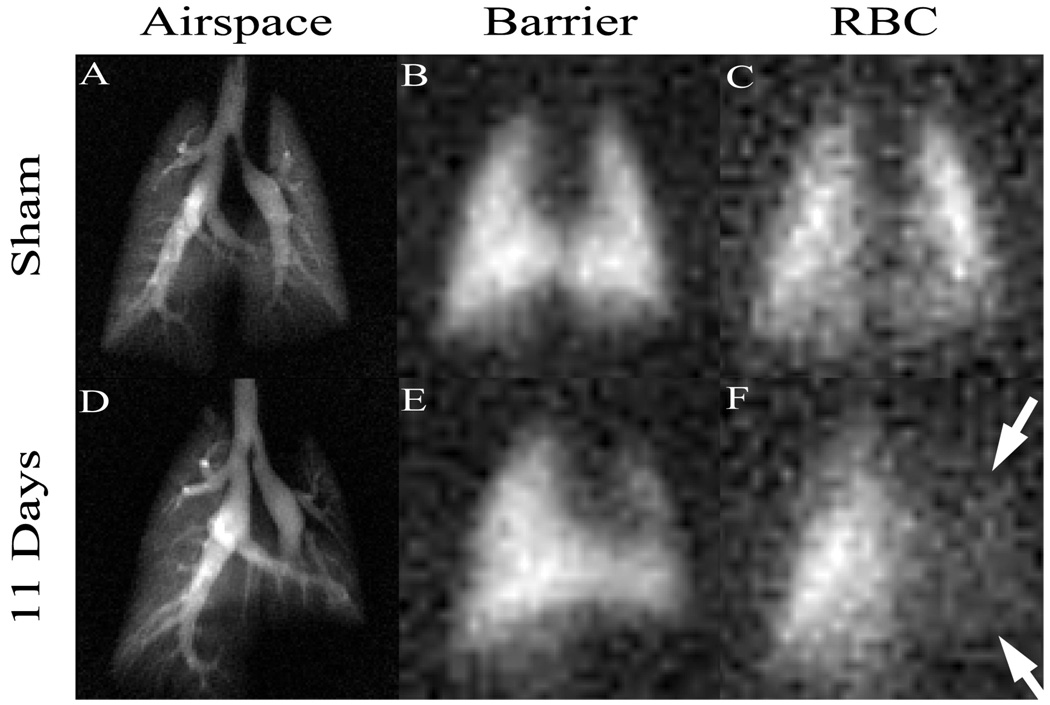
Hyperpolarized 129Xe has received less attention than 3He due to the challenges in producing it and its somewhat lower MRI signal. However, in recent years, these technical problems have been addressed to the point that the unique functional information offered by 129Xe (Oros 2004) can be extracted. 129Xe, like 3He can be used to make high-quality images of airspaces. However, its most valuable properties are its solubility in tissues and fluids and that 129Xe can be distinguished in different molecular environments by a characteristic shift in its resonance frequency. For example, in the lung, 129Xe exhibits three distinct resonant frequencies corresponding to 129Xe in the airspaces, in the interstitial spaces, and in the red blood cells (RBCs). We recently exploited these frequency shifts to image the transfer of 129Xe gas from alveoli, into the blood-gas barrier, and to the RBCs (Driehuys 2006). Such differential imaging of these three compartments is shown in Figure 12 and appears to be extremely sensitive to pulmonary gas-exchange abnormalities. These were created by unilateral instillation of bleomycin, which caused thickening of the blood-gas barrier that impaired the diffusive transfer of 129Xe to the RBCs, leading to an absence of 129Xe signal in the injured left lung (Figure 12F). Such gas-exchange imaging could be useful in the study of a large variety of models of chronic obstructive pulmonary disease (COPD), interstitial disease, inflammation or radiation-induced fibrosis.
Figure 12.
Hyperpolarized 129Xe MR images in three compartments of the lung. The ability to separately image uptake of 129Xe from the pulmonary airspaces (A,D) into the pulmonary tissue barrier (B,E) and red blood cells (C,F) is especially powerful for detection of gas exchange impairment. Such impairment is seen in (F), where 129Xe uptake in red blood cells has been diminished by inflammation and fibrosis caused by instillation of bleomycin. This agent creates thickening of the blood-gas barrier, causing 129Xe (or oxygen) to take longer to reach the red blood cells. Such direct visualization of gas exchange is uniquely enabled by the large frequency shift of 129Xe which allows separate imaging of the three compartments. Images were acquired using a 2D radial sequence with 0.3×0.3mm2 resolution in airspaces and 1×1mm2 in tissues in a time of 2 min. (Reprinted from Driehuys, 2006)
Imaging the Brain
Compared to the heart or lung, the brain presents an ideal organ for imaging since it involves little gross motion and the head can be physically stabilized. Imaging the rodent brain non-destructively at high-resolution is particularly useful in studying genetically manipulated animals and provides valuable morphologic information on neurological diseases that are often characterized by subtle structural changes. A continuing challenge in brain imaging, however, is to create sufficient contrast because conventional contrast agents do not penetrate the blood brain barrier (BBB). Highly specialized techniques and often exogenous contrast agents are needed to reveal structural detail based on nuclei, fiber tracts, and ventricular spaces.
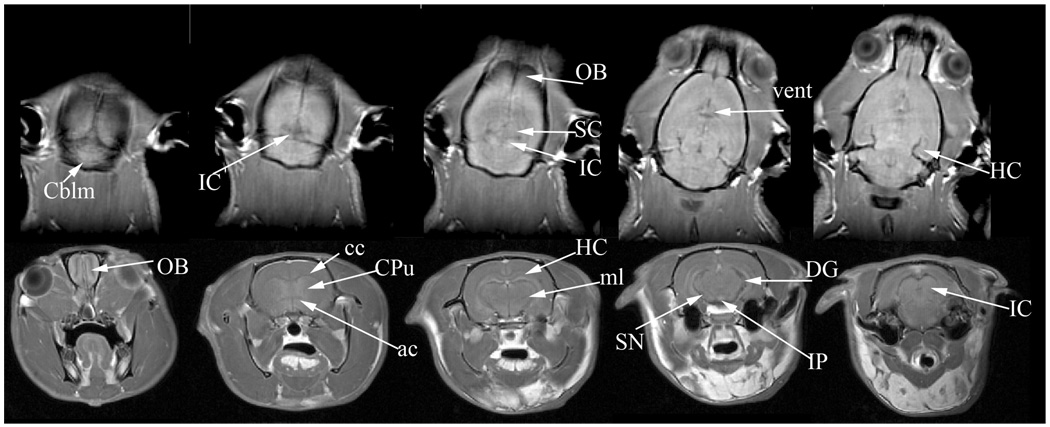
A typical in vivo rat brain image is shown in Figure 13. This dataset was acquired at 7 T over a span of 40 minutes with a resolution of 250×250×1000 µm3. In vivo brain imaging can be used to view several major structures including the olfactory bulbs (OB), cerebellum (Cblm), corpus calossum (cc), anterior commissure (ac), hippocampus (HC) and its dentate gyrus (DG), medial lemniscus (ml) , superior and inferior colliculi (SC, IC), and ventricles (vent). In vivo brain imaging is particularly valuable in longitudinal progression studies involving disease models (Benveniste 2002), the effects of drugs (Lu 2007), and cell migration (Shapiro 2006).
Figure 13.
In vivo imaging of the rat brain at a resolution of 250×250×1000µm3. The top row shows horizontal slices progressing in the dorsal to ventral direction. The bottom row shows axial slices progressing in the rostral to caudal direction. The images reveal several structures including the olfactory bulbs (OB), cerebellum (Cblm), corpus calossum (cc), anterior commissure (ac), hippocampus (HC) and its dentate gyrus (DG), medial lemniscus (ml), superior and inferior colliculi (SC, IC), and ventricles (vent). All images were acquired using a 3D spin echo protocol at 62.5 kHz bandwidth and a matrix of 256×128×32. The top row images were acquired with FOV=64×32×32 mm3 , TR/TE=1500/4.0 ms. The bottom row images were acquired with FOV=40×40×45 mm3, TR/TE=400/5.1 ms.
While the image resolution and contrast attainable in vivo are sufficient for many biological studies, numerous investigations demand the high resolution attainable only in fixed brain specimens. For example, many genetically modified animals exhibit abnormalities in certain brain structures that are only 10 to 20 µm. To better detect these subtle neuroanatomical variations, the spatial resolution and structural contrast of MRM can be enhanced through variants of the contrast-infused fixation methods previously described. Fixation of brain specimens faces the additional hurdle of requiring the contrast medium to penetrate the blood-brain-barrier (BBB). This is achieved by first flushing the blood from the head and then perfusing with a mixture of warmed Sal-Gd followed by Form-Gd fixative. Although, the mechanism by which Gd crosses the BBB remains to be elucidated, its efficacy is evident from the excellent T1 and T2 contrast seen in the stained brain image of Figure 14.
Figure 14.
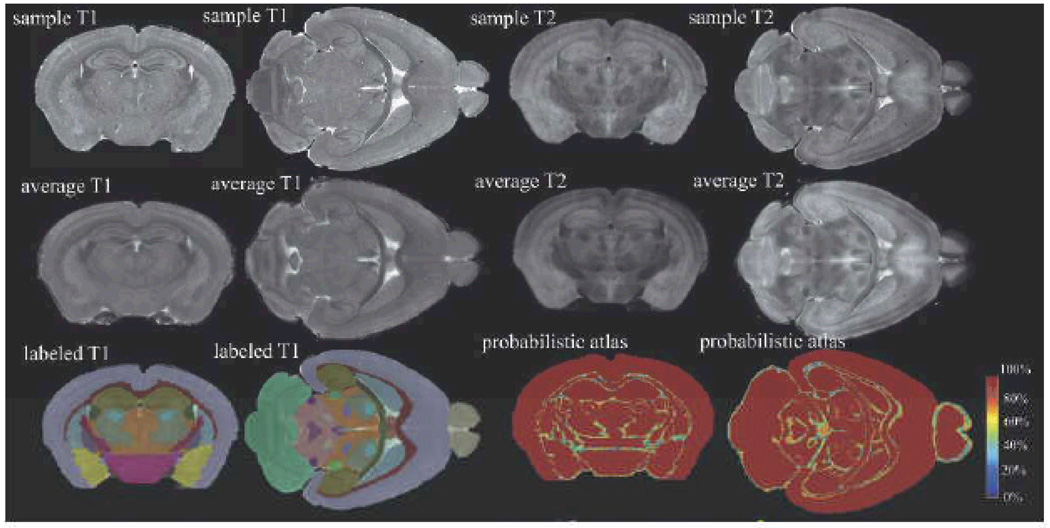
MRM is used to create a labeled atlas for the C57BL/6 mouse brain. The top row shows axial and horizontal image slices of T1- and T2-weighted datasets from fixed brain specimens acquired with 21.5µm3 resolution. Such images from multiple brains are co-registered and combined to create average brain images (middle row), which are then segmented to identify individual brain structures and create a labeled atlas (bottom row, 1st and 2nd columns). An additional measurement of interest is the variability of structures within the species. Variability is captured in a probabilistic atlas (bottom row, 3rd and 4th column), which exhibits in each voxel the level of agreement of all labels, in all brains. Regions of low agreement are found at the border of structures and in regions where small structures are in close vicinity. All images were acquired with a 3D spin echo sequence, matrix size of 1024×512×512, TR/TE= 50/5.2ms.
Images of the Gd-stained, fixed brain, either in the cranium or excised from it, are acquired using a 3D spin echo sequence requiring a scan time of 2 h to yield an isotropic resolution of 21 µm3. This type of high-resolution imaging uses numerous technical tricks including non-uniform radial gain and asymmetric data collection (Johnson 2007). These images can be augmented with T2-weighted images that accentuate the contrast between different brain structures (Sharief 2006). Such multi-contrast scans, acquired at 43µm3 resolution, were used to drive an automated brain segmentation method (Ali 2005) that identified 33 brain structures (Figure 14). Structures that are now detectable and quantifiable, including several not included in prior MRM-based brain atlases (Kovacevic 2005; Ma 2005), include the deep mesencephalic reticular nucleus and red nucleus (DpMe); thalamic nuclei, including the ventral posterior and lateral thalamic nuclei (VT); anterior pretectal nucleus (APT); lateral dorsal nucleus (LD); geniculate bodies (Gen); trigeminal tract; pons; cochlear nucleus; substantia nigra; and lateral lemniscus.
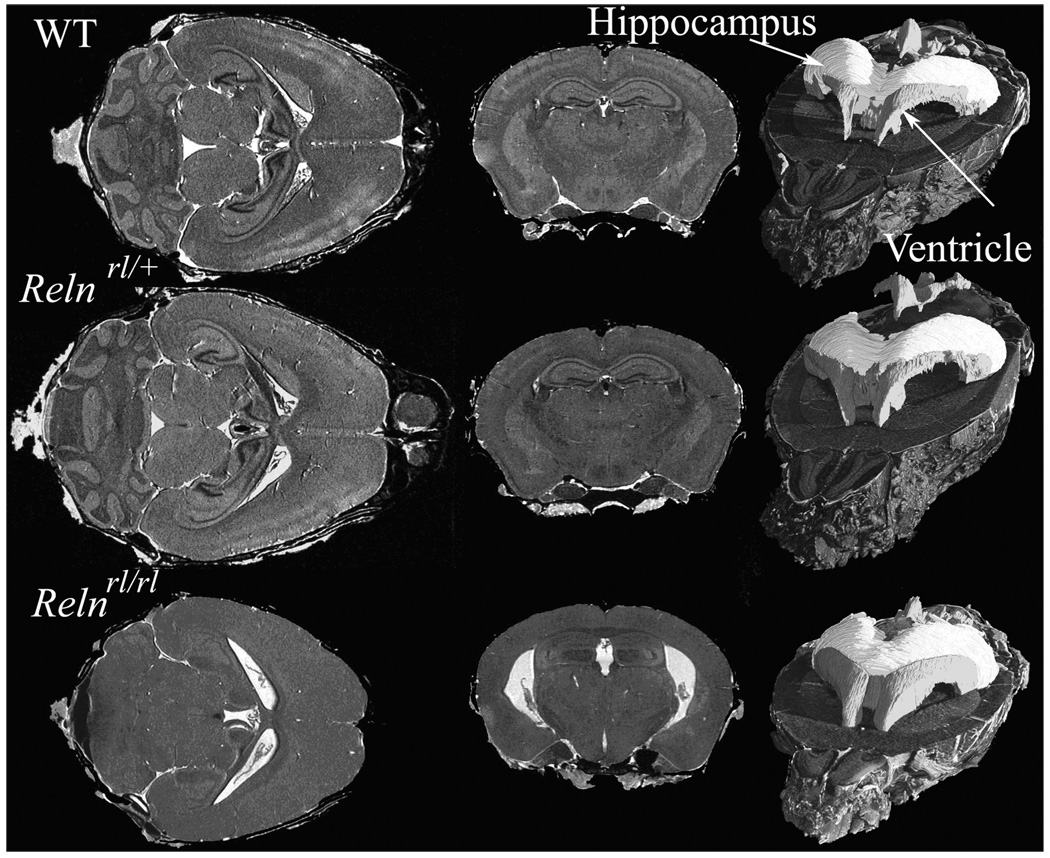
An example of high-resolution morphological phenotyping with MRM can be seen in Figure 15, depicting the Reeler mouse (Falconer 1951), a neurodevelopmental model proposed for neurological and psychiatric conditions. Images of brains in reelin (Reln)-deficient mice and wild-type (WT) control mice were acquired using a T1 weighted MRM protocol. A marked difference was observed with Relnrl/rl mice possessing a smaller brain, and both Relnrl/+ and Relnrl/rl mice exhibiting larger ventricles compared to WT controls. Brain structures also showed shape differences between Relnrl/rl and WT brains, which were evident in the cerebellum, olfactory bulbs, dorsomedial frontal and parietal cortex, certain regions of temporal and occipital lobes, the lateral ventricles, and ventral hippocampus. These findings suggest that certain brain regions may be more severely impacted by the Reln mutation than others. This example shows that high-resolution anatomical phenotyping by MRM is clearly poised to play a significant role in understanding how specific gene mutations affect brain organization (Badea 2007).
Figure 15.
T1-weighted images of the brains of wild type (WT) and mice with heterozygous and homozygous Reln mutation. These images of fixed perfused mouse brains were acquired at 21.5 µm3 resolution and segmented to show the ventricles and hippocampus. Horizontal sections in the homozygous Reeler mutant show severe atrophy in the cerebellum compared to the heterozygous mutant and WT. The heterozygous mutant also shows disturbances in the layered structures of the cortex and hippocampus, as well as enlarged ventricles. The right column shows segmentation of hippocampus (light gray) and ventricles (dark gray) which indicate shape differences among the three genotypes. Images were acquired using a 3D spin echo sequence with TR/TE=50/51 ms, FOV=22×11×11 mm, a 1024×512×512 matrix.
Although we have only covered high-resolution anatomical brain imaging, note that numerous other powerful types of contrast mechanisms are available. For example, diffusion tensor imaging (DTI) (Mori 2006) uses the fact that water diffusion is spatially constrained to map the fiber tract architecture of the brain. DTI is enormously powerful for the study of CNS disorders involving white matter tracts and demyelination (Chahboune 2007). Another powerful tool long recognized in clinical MRI is functional MRI (fMRI), which is now reaching the stage of application to animal models. fMRI has been applied with good success to the study of the visual (Huang 1996) and somatosensory systems (Ahrens 2001) of the mouse.
Current and Future Research Directions
Despite considerable successes, MRM continues to present opportunities to extend image SNR, resolution, contrast, and specificity. While the small samples imaged in MRM contribute less signal compared to clinical subjects, they also tend to contribute little or no noise except at very high frequencies. Consequently, in MRM, image noise is often primarily contributed by the rf coil (Black 1993). Coil noise is both proportional to the coil resistance and its absolute temperature and therefore could be dramatically reduced by employing cold copper rf coils or superconducting rf coils. Unlike conventional copper coils, superconducting coils present a negligible resistance and a very low absolute temperature, thereby drastically reducing the amount of noise that contaminates the image. Their low resistance endows them with a very high quality factor and results larger signals and higher SNR.
Though conceptually appealing, the practical implementation of superconducting coils has taken more than a decade of dedicated effort. This is because specialized superconducting coil design techniques are required to make production costs and turn-around times practical. Furthermore, cryogenic temperature regulation must be very stable to avoid frequency shifts and abrupt changes in quality factor (Hurlston 1999; Miller 1999) both of which can cause image artifacts. Particular care must also be taken to obtain sufficient radiofrequency field homogeneity by choosing appropriate dielectric materials and understanding second-order electromagnetic effects in superconducting coils. These coils may transfer radiofrequency power in a non-linear fashion during pulse transmission, making slice-selection and variable flip angles non-trivial to implement. Radiofrequency simulations may provide valuable guidance during the design process (Nouls 2006).
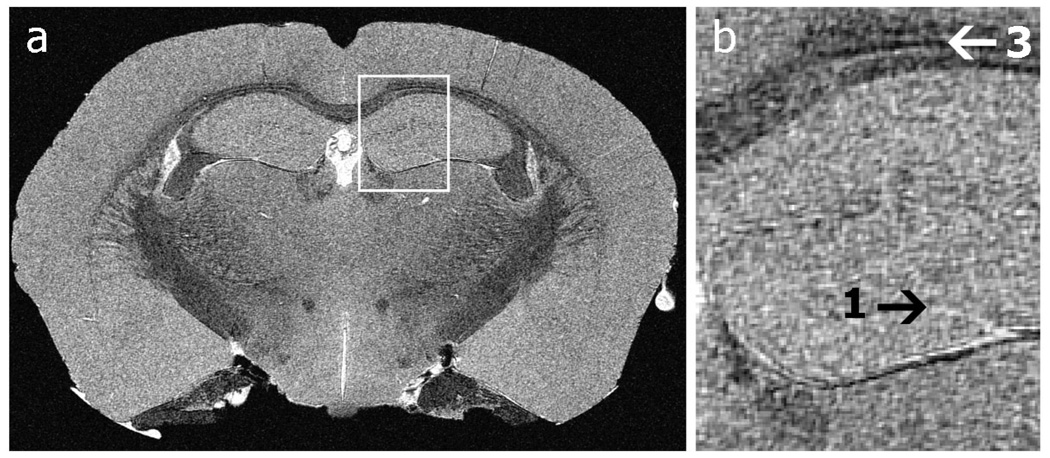
When the technical challenges have been successfully addressed, SNR improvements have been reported ranging from a factor of 3 (Hurlston 1999; Nouls 2006) to as much as 10 (Black 1993). Such SNR improvements can be used to reduce image acquisition time, increase sensitivity, or improve spatial resolution and shown in Figure 16. This figure shows a coronal view of a mouse brain acquired using a superconducting Helmholtz coil pair in 17 h and with an in-plane resolution of 10-microns. Such resolution could not be achieved within reasonable time constraints if a conventional copper coil were used.
Figure 16.
(a) a 10-micron in-plane resolution, coronal slice through the mouse hippocampus. (b) Anatomical features unseen at the resolution achievable with copper coils become apparent: the transitions between layers (arrow 1) in the hippocampus and the layering of the corpus callosum (arrow 2) are visible. Images were acquired using a GRE sequence, 90° flip angle, TR/TE=100/5.5 ms, FOV=21.3×10.6×10.6 mm3, Bandwidth=62.5 kHz, resolution of 10×10×20 µm3.
In addition to improving spatial and temporal resolution, recent efforts in MRI have been geared towards probing beyond anatomy and function, down to the molecular level. This so-called “molecular imaging” (Weissleder 2001) is an area of active research in all imaging modalities and is defined as “visualization, characterization, and measurement of biological processes at the molecular and cellular levels.” Although, molecular imaging has predominantly been performed using the more sensitive nuclear imaging methods such as positron emission tomography (PET) and single photon emission computed tomography (SPECT), there are certain advantages to using MRI (Sosnovik 2007). For example, MRI can add exquisite anatomical and functional information to provide context for the usually fuzzy molecular picture. Furthermore, in MRI the contrast can be “turned on” in response to a specific event (Lowe 2004), whereas signal from the nuclear methods cannot be manipulated in this manner.
The primary focus of molecular imaging with MRM is to develop contrast agents (probes) that can report on molecular events or targets of interest. However these targets are often present at only very low concentrations. Thus, their detection requires development of probes whose presence can be amplified when they have reached their objective (Querol 2006). Probes for molecular imaging contain either a paramagnetic (Gadolinium) or superparamagnetic (iron) moiety that acts as a T1, T2, or T2* contrast agent, but also include linkers and/or vectors that enabled the probes to target and accumulate in areas where specific molecular or cellular processes are most prolific. For example, targeted probes have been reported for imaging atherosclerotic plaques via surface integrins (Winter 2003), tumor vasculature via surface receptors (Sipkins 1998), and cell apoptosis (Zhao 2001). Examples of probes that activate in response to an event incude those for sensing pH (Lowe 2001) or sensing enzymatic activity (Louie 2000). Another important aspect of molecular imaging to which MRM is particularly well-suited is the tracking of cells to study cell and gene therapy (Bulte 2004; Ho 2004).
As a final note, we would be remiss if we did not point out that image acquisition is only the first step in applying MRM to biological problems. Once image data has been collected, a further challenge is to extract the most relevant and sensitive measures of interest. This can be a daunting challenge when data consists of 512×512×512 pixels each containing 16 bits of grayscale information. The area of image analysis is vitally important and is indeed the subject of active research. It includes such issues as co-registration of serial images or those from multiple modalities, image segmentation to identify key structures, image enhancement to accentuate desired features, and most importantly image quantification to enable researchers to distill these complex datasets into useful numbers that can be used to study the problem at hand. While we have not discussed this important topic, we refer the interested reader to the text by Gonzalez and Woods as a starting point (Gonzalez 2006).
Conclusion
Magnetic resonance microscopy has become a stable and ubiquitous platform for biomedical investigations and occupies a unique position in the pantheon of small animal imaging modalities. With so many imaging modalities becoming available, a common question is when should one employ MRM rather than micro-CT, for example. Micro-CT is capable of generating images of exquisite resolution, down to 6–8 µm for fixed specimens (Johnson 2006) and 100 µm for in vivo imaging (Badea 2004). Micro-CT enjoys advantages of generally higher throughput, lower cost, and exquisite resolution. However, CT is encumbered by high x-ray dose, which constrains its use in longitudinal studies. A further limitation is that the contrast available for CT is limited primarily to differences in tissue density and therefore molecular imaging with CT has not yet made much headway. Thus, while the choice of imaging modality is a complex one that must be made while considering all aspects of a project, MRM is almost always in the mix. MRM benefits from its non-invasive, 3D nature and high resolution for both anatomic and functional images. Perhaps its greatest asset is its extraordinary richness of contrast that is now being pushed towards the molecular imaging level. The challenges of MRM continue to be the expense of equipment, specialized MR physics knowledge required to get the most out of a scanner, the time required to acquire an image and therefore, low throughput. It is likely that many of these challenges can be overcome with ongoing technical development effort occurring in laboratories around the world. By driving development efforts in concert with the questions of the biologists, MRM may indeed become the modality of choice for many biomedical investigations. Particularly exciting developments include the increase in throughput enabled by imaging multiple mice simultaneously (Bock 2003; Nieman 2005), as well as the opportunities offered by technologies like superconducting coils, hyperpolarized gases, and molecular imaging probes. With these issues and opportunities, there will be ample chance to keep both the MRM technology developers and biomedical end-users busily engaged.
Figure 8.
Four representative slices from a perfusion-fixed 19 g C57BL/6 mouse, imaged at 7 T with in-plane resolution of 63×63 µm2. A. Mid-thoracic level showing the vena cava (VC) within the accessory lobe of the right lung and below that is the main bronchus of the middle lobe of the right lung (dark area). The black arrow points to the circular profiles of the esophagus, abdominal aorta, and azygous vein (in order). Also seen are the right and left ventricles (RV, LV) of the heart. The lower white arrow points to the spinal cord, which is seen in all panels. B. Upper abdominal level image showing liver lobes surrounding a loop of the small intestine (SI), vena cava (VC), and the stomach (STOM) to the animal’s left. C. Image slice from slightly lower in the abdomen showing more loops of the small intestine (SI) and part of the stomach (STOM), as well as the right kidney (RK), a section of the spleen (SP) and fragments of the pancreas (arrow). D. Further into the abdomen the right kidney and also the left kidney (LK) are visible, and loops of the large intestine (LI), which are dark because of the lack of water, fragments of the pancreas, and a section of the spleen to the animal’s left.
Acknowledgements
The authors wish to thank Sally Zimney for assistance in preparation of the manuscript and Al Johnson for fostering many of the developments reviewed in this manuscript. This work was performed at the Duke Center for In Vivo Microscopy, an NCRR/NCI National Biomedical Technology Resource Center (P41 RR005959/U24 CA092656), with additional support from NIH/NHLBI (R01 HL055348), NIH/NIBIB (1 T32 EB001040), the mouse Bioinformatics Research Network (MBIRN) — NIH/NCRR grant U24 RR021760 and the GEMI Fund 2005.
References
- Ahrens ET, Dubowitz DJ. Peripheral somatosensory fMRI in mouse at 11.7 T. NMR Biomed. 2001;14:318–324. doi: 10.1002/nbm.709. [DOI] [PubMed] [Google Scholar]
- Ali AA, Dale AM, Badea A, Johnson GA. Automated segmentation of neuroanatomical structures in multispectral MR microscopy of the mouse brain. Neuroimage. 2005;27:425–435. doi: 10.1016/j.neuroimage.2005.04.017. [DOI] [PubMed] [Google Scholar]
- Altes TA, Powers PL, Knight-Scott J, Rakes G, Platts-Mills TAE, DeLange EE, Alford BA, Mugler JP, Brookeman JR. Hyperpolarized 3He MR Lung Ventilation Imaging in Asthmatics: Preliminary Findings. J. Mag. Res. Imag. 2001;13:378–384. doi: 10.1002/jmri.1054. [DOI] [PubMed] [Google Scholar]
- Badea A, Nicholls PJ, Johnson GA, Wetsel WC. Neuroanatomical phenotypes in the Reeler mouse. Neuroimage. 2007;34:1363–1374. doi: 10.1016/j.neuroimage.2006.09.053. [DOI] [PMC free article] [PubMed] [Google Scholar]
- Badea C, Hedlund LW, Johnson GA. Micro-CT with respiratory and cardiac gating. Med Phys. 2004;31:3324–3329. doi: 10.1118/1.1812604. [DOI] [PMC free article] [PubMed] [Google Scholar]
- Bamforth SD, Braganca J, Farthing CR, Schneider JE, Broadbent C, Michell AC, Clarke K, Neubauer S, Norris D, Brown NA, Anderson RH, Bhattacharya S. Cited2 controls left-right patterning and heart development through a Nodal-Pitx2c pathway. Nat Genet. 2004;36:1189–1196. doi: 10.1038/ng1446. [DOI] [PubMed] [Google Scholar]
- Beck BL, Blackband SJ. Phased array imaging on a 4.7T/33cm animal research system. Rev Sci Instrum. 2001;72:4292–4294. [Google Scholar]
- Benveniste H, Blackband S. MR microscopy and high resolution small animal MRI: applications in neuroscience research. Prog Neurobiol. 2002;67:393–420. doi: 10.1016/s0301-0082(02)00020-5. [DOI] [PubMed] [Google Scholar]
- Beuf O, Jaillon F, Saint-Jalmes H. Small-animal MRI: signal-to-noise ratio comparison at 7 and 1.5 T with multiple-animal acquisition strategies. Magnetic Resonance Materials in Physics Biology and Medicine. 2006;19:202–208. doi: 10.1007/s10334-006-0048-9. [DOI] [PubMed] [Google Scholar]
- Black RD, Early TA, Roemer PB, Mueller OM, Morgo-Campero A, Turner LG, Johnson GA. A high temperature superconducting receiver for NMR microscopy. Science. 1993;259:793–795. doi: 10.1126/science.8430331. [DOI] [PubMed] [Google Scholar]
- Bock NA, Konyer NB, Henkelman RM. Multiple-mouse MRI. Magn Reson Med. 2003;49:158–167. doi: 10.1002/mrm.10326. [DOI] [PubMed] [Google Scholar]
- Brau ACS, Hedlund LW, Johnson GA. Cine magnetic resonance microscopy of the rat heart using cardiorespiratory-synchronous projection reconstruction. J Magn Reson Imaging. 2004;20:31–38. doi: 10.1002/jmri.20089. [DOI] [PubMed] [Google Scholar]
- Brunson DR. Chapter 2: Pharmacology of inhalational anesthetics. In: Kohn DF, editor. Anesthesia and Analgesia in Laboratory Animals. San Diego, CA: Academic Press; 1997. [Google Scholar]
- Bulte JWM, Kraitchman DL. Iron oxide MR contrast agents for molecular and cellular imaging. NMR Biomed. 2004;17:484–499. doi: 10.1002/nbm.924. [DOI] [PubMed] [Google Scholar]
- Bushberg JT, Seibert JA, Leidholdt EM, Boone JM. The Essential Physics of Medical Imaging, 2nd Edition. 2 edition. Baltimore: Williams and Wilkins; 2001. [Google Scholar]
- Caravan P, Ellison JJ, McMurry TJ, Lauffer RB. Gadolinium(III) chelates as MRI contrast agents: Structure, dynamics, and applications. Chem Rev. 1999;99:2293–2352. doi: 10.1021/cr980440x. [DOI] [PubMed] [Google Scholar]
- Cassidy PJ, Schneider JE, Grieve SM, Lygate C, Neubauer S, Clarke K. Assessment of motion gating strategies for mouse magnetic resonance at high magnetic fields. J Magn Reson Imaging. 2004;19:229–237. doi: 10.1002/jmri.10454. [DOI] [PubMed] [Google Scholar]
- Chahboune H, Ment LR, Stewart WB, Ma XX, Rothman DL, Hyder F. Neurodevelopment of C57B/L6 mouse brain assessed by in vivo diffusion tensor imaging. NMR Biomed. 2007;20:375–382. doi: 10.1002/nbm.1130. [DOI] [PubMed] [Google Scholar]
- Chen BT, Brau AC, Johnson GA. Measurement of regional lung function in rats using hyperpolarized 3helium dynamic MRI. Magn Reson Med. 2003;49:78–88. doi: 10.1002/mrm.10336. [DOI] [PubMed] [Google Scholar]
- Costa DL, Lehmann JR, Harold WM, Drew RT. Transoral tracheal intubation of rodents using a fiberoptic laryngoscope. Lab Animal Sci. 1986;36:256–261. [PubMed] [Google Scholar]
- Darrasse L, Ginefri JC. Perspectives with cryogenic RF probes in biomedical MRI. Biochimie. 2003;85:915–937. doi: 10.1016/j.biochi.2003.09.016. [DOI] [PubMed] [Google Scholar]
- Dazai J, Bock NA, Nieman BJ, Davidson LM, Henkelman RM, Chen XJ. Multiple mouse biological loading and monitoring system for MRI. Magn Reson Med. 2004;52:709–715. doi: 10.1002/mrm.20215. [DOI] [PubMed] [Google Scholar]
- Doty FD, Entzminger G, Kulkarni J, Pamarthy K, Staab JP. Radio frequency coil technology for small-animal MRI. NMR Biomed. 2007;20:304–325. doi: 10.1002/nbm.1149. [DOI] [PubMed] [Google Scholar]
- Driehuys B, Cofer GP, Pollaro J, Boslego J, Hedlund LW, Johnson GA. Imaging alveolar capillary gas transfer using hyperpolarized 129Xe MRI. Proc Natl Acad Sci U S A. 2006;103:18278–18283. doi: 10.1073/pnas.0608458103. [DOI] [PMC free article] [PubMed] [Google Scholar]
- Driehuys B, Hedlund LW. Imaging Techniques for Small Animal Models of Pulmonary Disease: MR Microscopy. Toxicol Pathol. 2007;35:49–58. doi: 10.1080/01926230601132048. [DOI] [PMC free article] [PubMed] [Google Scholar]
- Driehuys B, Walker JK, Pollaro J, Cofer GP, Mistry N, Schwartz DA, Johnson GA. Hyperpolarized 3He MR imaging of methacholine challenge in a mouse model of asthma. Magn Reson Med. doi: 10.1002/mrm.21306. In press. [DOI] [PMC free article] [PubMed] [Google Scholar]
- Edelstien WA, Glover GH, Hardy CJ, Redington RW. The Intrinsic Signal-to-Noise Ratio in NMR Imaging. Magn Reson Med. 1986;3:604–618. doi: 10.1002/mrm.1910030413. [DOI] [PubMed] [Google Scholar]
- Epstein FH, Yang ZQ, Gilson WD, Berr SS, Kramer CM, French BA. MR tagging early after myocardial infarction in mice demonstrates contractile dysfunction in adjacent and remote regions. Magn Reson Med. 2002;48:399–403. doi: 10.1002/mrm.10210. [DOI] [PubMed] [Google Scholar]
- Falconer DS. 2 New Mutants, Trembler and Reeler, with Neurological Actions in the House Mouse (Mus-Musculus L) Journal of Genetics. 1951;50:192–201. doi: 10.1007/BF02996215. [DOI] [PubMed] [Google Scholar]
- Fan XB, Markiewicz EJ, Zamora M, Karczmar GS, Roman BB. Comparison and evaluation of mouse cardiac MRI acquired with open birdcage, single loop surface and volume birdcage coils. Phys Med Biol. 2006;51:N451–N459. doi: 10.1088/0031-9155/51/24/N01. [DOI] [PubMed] [Google Scholar]
- Flecknell PA. Laboratory Animal Anesthesia: An introduction for research workers and technicans. San Diego: Academic Press, Ltd.; 1987. [Google Scholar]
- Gareis D, Wichmann T, Lanz T, MeIkus G, Horn M, Jakob PM. Mouse MRI using phased-array coils. NMR Biomed. 2007;20:326–334. doi: 10.1002/nbm.1156. [DOI] [PubMed] [Google Scholar]
- Gewalt SL, Glover GH, MacFall JR, Hedlund LW, Johnson GA. MR microscopy of the rat lung using projection reconstruction. Magn Reson Med. 1993;29:99–106. doi: 10.1002/mrm.1910290117. [DOI] [PubMed] [Google Scholar]
- Ghaghada KB, Bockhorst KHJ, Mukundan S, Annapragada AV, Narayana PA. High-resolution vascular imaging of the rat spine using liposomal blood pool MR agent. American Journal of Neuroradiology. 2007;28:48–53. [PMC free article] [PubMed] [Google Scholar]
- Gonzalez RC, Woods RE. Digital Image Processing. 3rd Edition. Prentice-Hall, Inc.; 2006. [Google Scholar]
- Haacke EM, Brown RW, Thompson MR, Venkatesan R. Magnetic Resonance Imaging Physical Principles and Sequence Design. New York: Wiley-Liss; 1999. [Google Scholar]
- Hayes CE, Edelstein WA, Schenck JF, Mueller OM, Eash M. An efficient, highly homogeneous radiofrequency coil for whole body NMR imaging at 1.5 T. J Magn Reson. 1985;63:622–628. [Google Scholar]
- Hedlund LW, Johnson GA. Mechanical Ventilation for Imaging the Small Animal Lung. ILAR Journal. 2002;43:159–174. doi: 10.1093/ilar.43.3.159. [DOI] [PubMed] [Google Scholar]
- Ho C, Hitchens TK. A non-invasive approach to detecting organ rejection by MRI: Monitoring the accumulation of immune cells at the transplanted organ. Current Pharmaceutical Biotechnology. 2004;5:551–566. doi: 10.2174/1389201043376535. [DOI] [PubMed] [Google Scholar]
- Hornak JP. The Basics of MRI. 2006 [Online] available at http://www.cis.rit.edu/htbooks/mri/.
- Huang W, Palyka I, Li HF, Eisenstein EM, Volkow ND, Springer CS. Magnetic resonance imaging (MRI) detection of the murine brain response to light: Temporal differentiation and negative functional MRI changes. Proc Natl Acad Sci U S A. 1996;93:6037–6042. doi: 10.1073/pnas.93.12.6037. [DOI] [PMC free article] [PubMed] [Google Scholar]
- Hurlston SE, Brey WW, Suddarth SA, Johnson GA. A high-temperature superconducting Helmholtz probe for microscopy at 9.4 T. Magn Reson Med. 1999;41:1032–1038. doi: 10.1002/(sici)1522-2594(199905)41:5<1032::aid-mrm23>3.0.co;2-x. [DOI] [PubMed] [Google Scholar]
- Johnson GA, Ali-Sharief A, Badea A, Brandenburg J, Cofer GP, Fubara B, Gewalt SL, Hedlund LW, Upchurch L. High-throughput morphologic phenotyping of the mouse brain with magnetic resonance histology. Neuroimage. 2007;37:82–89. doi: 10.1016/j.neuroimage.2007.05.013. [DOI] [PMC free article] [PubMed] [Google Scholar]
- Johnson GA, Cofer GP, Fubara B, Gewalt SL, Hedlund LW, Maronpot RR. Magnetic resonance histology for morphologic phenotyping. J Magn Reson Imaging. 2002a;16:423–429. doi: 10.1002/jmri.10175. [DOI] [PubMed] [Google Scholar]
- Johnson GA, Cofer GP, Gewalt SL, Hedlund LW. Morphologic phenotyping with MR microscopy: The visible mouse. Radiology. 2002b;222:789–793. doi: 10.1148/radiol.2223010531. [DOI] [PubMed] [Google Scholar]
- Johnson JT, Hansen MS, Wu I, Healy LJ, Johnson CR, Jones GM, Capecchi MR, Keller C. Virtual histology of transgenic mouse embryos for high-throughput phenotyping. Plos Genetics. 2006;2:471–477. doi: 10.1371/journal.pgen.0020061. [DOI] [PMC free article] [PubMed] [Google Scholar]
- Kovacevic N, Henderson JT, Chan E, Lifshitz N, Bishop J, Evans AC, Henkelman RM, Chen XJ. A three-dimensional MRI atlas of the mouse brain with estimates of the average and variability. Cereb Cortex. 2005;15:639–645. doi: 10.1093/cercor/bhh165. [DOI] [PubMed] [Google Scholar]
- Kuethe DO, Caprihan A, Fukushima E, Waggoner RA. Imaging lungs using inert fluorinated gases. Magn Reson Med. 1998;39:85–88. doi: 10.1002/mrm.1910390114. [DOI] [PubMed] [Google Scholar]
- Leawoods JC, Yablonskiy DA, Saam B, Gierada DS, Conradi MS. Hyperpolarized He-3 gas production and MR imaging of the lung. Conc Magn Reson. 2001;13:277–293. [Google Scholar]
- Louie AY, Huber MM, Ahrens ET, Rothbacher U, Moats R, Jacobs RE, Fraser SE, Meade TJ. In vivo visualization of gene expression using magnetic resonance imaging. Nat Biotechnol. 2000;18:321–325. doi: 10.1038/73780. [DOI] [PubMed] [Google Scholar]
- Lowe MP. Activated MR contrast agents. Current Pharmaceutical Biotechnology. 2004;5:519–528. doi: 10.2174/1389201043376562. [DOI] [PubMed] [Google Scholar]
- Lowe MP, Parker D, Reany O, Aime S, Botta M, Castellano G, Gianolio E, Pagliarin R. pH-dependent modulation of relaxivity and luminescence in macrocyclic gadolinium and europium complexes based on reversible intramolecular sulfonamide ligation. J Am Chem Soc. 2001;123:7601–7609. doi: 10.1021/ja0103647. [DOI] [PubMed] [Google Scholar]
- Lu HB, Xi ZX, Gitajn L, Rea W, Yang YH, Stein EA. Cocaine-induced brain activation detected by dynamic manganese-enhanced magnetic resonance imaging (MEMRI) Proc Natl Acad Sci U S A. 2007;104:2489–2494. doi: 10.1073/pnas.0606983104. [DOI] [PMC free article] [PubMed] [Google Scholar]
- Ma Y, Hof PR, Grant SC, Blackband SJ, Bennett R, Slatest L, McGuigan MD, Benveniste H. A three-dimensional digital atlas database of the adult C57BL/6J mouse brain by magnetic resonance microscopy. Neuroscience. 2005;135:1203–1215. doi: 10.1016/j.neuroscience.2005.07.014. [DOI] [PubMed] [Google Scholar]
- Maronpot RR, Sills RC, Johnson GA. Applications of magnetic resonance microscopy. Toxicol Pathol. 2004;32:42–48. doi: 10.1080/01926230490451707. [DOI] [PubMed] [Google Scholar]
- Miller JR, Hurlston SE, Ma QY, Face DW, Kountz DJ, MacFall JR, Hedlund LW, Johnson GA. Performance of a high-temperature superconducting probe for in vivo microscopy at 2.0 T. Magn Reson Med. 1999;41:72–79. doi: 10.1002/(sici)1522-2594(199901)41:1<72::aid-mrm11>3.0.co;2-a. [DOI] [PubMed] [Google Scholar]
- Moller HE, Chen XJ, Saam B, Hagspiel KD, Johnson GA, Altes TA, de Lange EE, Kauczor HU. MRI of the lungs using hyperpolarized noble gases. Magn Reson Med. 2002;47:1029–1051. doi: 10.1002/mrm.10173. [DOI] [PubMed] [Google Scholar]
- Mori S, Zhang JY. Principles of diffusion tensor imaging and its applications to basic neuroscience research. Neuron. 2006;51:527–539. doi: 10.1016/j.neuron.2006.08.012. [DOI] [PubMed] [Google Scholar]
- Nahrendorf M, Streif JU, Hiller KH, Hu K, Nordbeck P, Ritter O, Sosnovik D, Bauer L, Neubauer S, Jakob PM, Ertl G, Spindler M, Bauer WR. Multimodal functional cardiac MRI in creatine kinase-deficient mice reveals subtle abnormalities in myocardial perfusion and mechanics. American Journal of Physiology-Heart and Circulatory Physiology. 2006;290:H2516–H2521. doi: 10.1152/ajpheart.01038.2005. [DOI] [PubMed] [Google Scholar]
- Nieman BJ, Bock NA, Bishop J, Sled JG, Chen XJ, Henkelman RM. Fast spin-echo for multiple mouse magnetic resonance phenotyping. Magn Reson Med. 2005;54:532–537. doi: 10.1002/mrm.20590. [DOI] [PubMed] [Google Scholar]
- Nouls J, Izenson M, Bagley M, Greeley H, Rozzi J, Johnson GA. A superconducting volume coil for MR microscopy at 9.4 T. 14th Annual Meeting, ISMRM; 2006. p. 221. [Google Scholar]
- Oros A, Shah NJ. Hyperpolarized xenon in NMR and MRI. Phys Med Biol. 2004;49:R105–R153. doi: 10.1088/0031-9155/49/20/r01. [DOI] [PubMed] [Google Scholar]
- Petiet A, Hedlund L, Johnson GA. Staining methods for magnetic resonance microscopy of the rat fetus. J Magn Reson Imaging. 2007;25:1192–1198. doi: 10.1002/jmri.20932. [DOI] [PMC free article] [PubMed] [Google Scholar]
- Plumb DC. Plumb's Veterinary Drug Handbook. 5th edition. Ames, IA: Blackwell Publishing; 2005. [Google Scholar]
- Qiu HH, Cofer GP, Hedlund LW, Johnson GA. Automated feedback control of body temperature for small animal studies with MR microscopy. IEEE Trans Biomed Eng. 1997;44:1107–1113. doi: 10.1109/10.641338. [DOI] [PubMed] [Google Scholar]
- Querol M, Bogdanov A. Amplification strategies in MR imaging: Activation and accumulation of sensing contrast agents (SCAs) J Magn Reson Imaging. 2006;24:971–982. doi: 10.1002/jmri.20724. [DOI] [PubMed] [Google Scholar]
- Ruff J, Wiesmann F, Hiller KH, Voll S, von Kienlin M, Bauer WR, Rommel E, Neubauer S, Haase A. Magnetic resonance microimaging for noninvasive quantification of myocardial function and mass in the mouse. Magn Reson Med. 1998;40:43–48. doi: 10.1002/mrm.1910400106. [DOI] [PubMed] [Google Scholar]
- Salerno M, Altes TA, Mugler JP, Nakatsu M, Hatabu H, DeLange EE. Hyperpolarized Noble Gas MR Imaging of the Lung: Potential Clinical Applications. Eur. J. Radiology. 2001;40:33–44. doi: 10.1016/s0720-048x(01)00347-3. [DOI] [PubMed] [Google Scholar]
- Samee S, Altes T, Powers P, de Lange EE, Knight-Scott J, Rakes G, Mugler JP, Ciambotti JM, Alford BA, Brookeman JR, Platts-Mills TAE. Imaging the lungs in asthmatic patients by using hyperpolarized helium-3 magnetic resonance: Assessment of response to methacholine and exercise challenge. J Allergy Clin Immunol. 2003;111:1205–1211. doi: 10.1067/mai.2003.1544. [DOI] [PubMed] [Google Scholar]
- Schneider JE, Bamforth SD, Farthing CR, Clarke K, Neubauer S, Bhattacharya S. Rapid identification and 3D reconstruction of complex cardiac malformations in transgenic mouse embryos using fast gradient echo sequence magnetic resonance imaging. J Mol Cell Cardiol. 2003;35:217–222. doi: 10.1016/s0022-2828(02)00291-2. [DOI] [PubMed] [Google Scholar]
- Shapiro EM, Gonzalez-Perez O, Garcia-Verdugo JM, Alvarez-Buylla A, Koretsky AP. Magnetic resonance imaging of the migration of neuronal precursors generated in the adult rodent brain. Neuroimage. 2006;32:1150–1157. doi: 10.1016/j.neuroimage.2006.04.219. [DOI] [PMC free article] [PubMed] [Google Scholar]
- Sharief AA, Johnson GA. Enhanced T-2 contrast for MR histology of the mouse brain. Magn Reson Med. 2006;56:717–725. doi: 10.1002/mrm.21026. [DOI] [PubMed] [Google Scholar]
- Shattuck MD, Gewalt SL, Glover GH, Hedlund LW, Johnson GA. MR microimaging of the lung using volume projection encoding. Magn Reson Med. 1997;38:938–942. doi: 10.1002/mrm.1910380613. [DOI] [PubMed] [Google Scholar]
- Sipkins DA, Cheresh DA, Kazemi MR, Nevin LM, Bednarski MD, Li KCP. Detection of tumor angiogenesis in vivo by alpha(v)beta(3)-targeted magnetic resonance imaging. Nat Med. 1998;4:623–626. doi: 10.1038/nm0598-623. [DOI] [PubMed] [Google Scholar]
- Sosnovik DE, Weissleder R. Emerging concepts in molecular MRI. Curr Opin Biotechnol. 2007;18:4–10. doi: 10.1016/j.copbio.2006.11.001. [DOI] [PubMed] [Google Scholar]
- Spector ZZ, Emami K, Fischer MC, Zhu J, Ishii M, Vahdat V, Yu J, Kadlecek S, Driehuys B, Lipson DA, Gefter W, Shrager J, Rizi RR. Quantitative assessment of emphysema using hyperpolarized He-3 magnetic resonance imaging. Magn Reson Med. 2005;53:1341–1346. doi: 10.1002/mrm.20514. [DOI] [PubMed] [Google Scholar]
- Summers RM, Hedlund LW, Cofer GP, Gottsman MB, Manibo JF, Johnson GA. Mr Microscopy of the Rat Carotid-Artery after Balloon Injury by Using an Implanted Imaging Coil. Magn Reson Med. 1995;33:785–789. doi: 10.1002/mrm.1910330607. [DOI] [PubMed] [Google Scholar]
- Thet LA. A simple method of intubating rats under direct vision. Lab Anim. Sci. 1983;33:368–369. [PubMed] [Google Scholar]
- van Beek EJR, Schmiedeskamp J, Wild JM, Paley MNJ, Filbir F, Fichele S, Knitz F, Mills GH, Woodhouse N, Swift A, Heil W, Wolf M, Otten E. Hyperpolarized 3-helium MR imaging of the lungs: testing the concept of a central production facility. Eur Radiol. 2003;13:2583–2586. doi: 10.1007/s00330-003-2094-2. [DOI] [PubMed] [Google Scholar]
- Weissleder R, Mahmood U. Molecular imaging. Radiology. 2001;219:316–333. doi: 10.1148/radiology.219.2.r01ma19316. [DOI] [PubMed] [Google Scholar]
- Winter PM, Morawski AM, Caruthers SD, Fuhrhop RW, Zhang HY, Williams TA, Allen JS, Lacy EK, Robertson JD, Lanza GM, Wickline SA. Molecular imaging of angiogenesis in early-stage atherosclerosis with alpha(v)beta(3)-Integrin-targeted nanoparticles. Circulation. 2003;108:2270–2274. doi: 10.1161/01.CIR.0000093185.16083.95. [DOI] [PubMed] [Google Scholar]
- Wixson SK, Smiler KL. Chapter 9: Anesthesia and analgesia in rodents. In: Kohn DF, editor. Anesthesia and Analgesia in Laboratory Animals. American College of Laboratory Animal Medicine. San Diego, CA: Academic Press; 1997. p. 426. [Google Scholar]
- Zhao M, Beauregard DA, Loizou L, Davletov B, Brindle KM. Non-invasive detection of apoptosis using magnetic resonance imaging and a targeted contrast agent. Nat Med. 2001;7:1241–1244. doi: 10.1038/nm1101-1241. [DOI] [PubMed] [Google Scholar]
- Zhou YQ, Davidson L, Henkelman RM, Nieman BJ, Foster FS, Yu LX, Chen XJ. Ultrasound-guided left-ventricular catheterization: a novel method of whole mouse perfusion for microimaging. Lab Invest. 2004;84:385–389. doi: 10.1038/labinvest.3700038. [DOI] [PubMed] [Google Scholar]


