Abstract
Almost all cellular functions are results of well-coordinated interactions between various proteins. A more connected hub or motif in the interaction network is expected to be more important and any perturbation in this motif would be more damaging to the smooth performance of the related functions. Thus, some coherent robustness of these hubs has to be derived. Here we provide the global evidence that interaction hubs obtain their robustness against uneven protein concentrations through co-expression of the constituents and the degree of co-expression correlates strongly with the complexity of the embedded motif. We calculate the gene expression correlations between the proteins embedded in 3-, 4-, 5- and 6-node interaction motifs of increasing complexities and compared them to those between proteins from random motifs of similar complexities. We find that as the connectedness of these motifs increase, there is a higher co-expression between the constituent proteins. For example, when the expression correlation is 0.7, the kernel density of the correlation increases from 0.152 for 4-node motifs with 3 edges to 0.403 for 4-node cliques. This implies that the robustness of the interaction system emerges from a proportionate synchronicity among the constituents of the motif via co-expression. We further show that such biological coherence via co-expression of component proteins can be reinforced by integrating conservation data in the analysis. For example, on addition of evolutionary information from other genomes, the ratio of kernel density for interaction and random data in the case of 5- and 6-node cliques in yeast increases from 37.8 to 123 and 98.4 to 1300, respectively, when their expression correlation is 0.8. Our results show that genes whose products are involved in motifs have transcription and translation properties that that minimize the noise in final protein concentrations, compared to random sets of genes.
Keywords: Interaction motif, co-expression, orthologs, robustness, protein interaction network, microarray
1. Introduction
A cellular function can rarely be attributed to a single protein, gene, metabolite or enzyme, but originates from well-coordinated and integrated activities of several such components1-3. For a smooth carrying out of these functions, the interactions between different proteins play prominent roles in almost all cellular functions 4. Recent breakthroughs in experimental high-throughput techniques have added significantly to the number of protein-protein interactions. These techniques include yeast two-hybrid (Y2H) assays 5-9, phage-display assays 10, tandem affinity purifications (TAP) 11,12, co-immunoprecipitation, and affinity chromatography 8,13,14.
A protein-protein interaction (PPI) network represents a highly complex and very vital topology that is best explained by an inherently uniform exponential architecture 15. These networks display some interesting statistical characteristics such as power law distribution (P(k) ∼ k−γ) 1,16, the small world property 1,17,18, anticorrelation in the node degree of connected nodes 19 and hierarchical modularity 20. Analysis of multibody structures embedded in PPI also reveals two kinds of molecular modules: protein complexes and dynamic functional units 21. Evolutionary analysis of these network demonstrates that interactive proteins evolve more slowly 22 although there have been some results to show otherwise 23,24. Such properties of these networks have been used to various purposes such as identification of functional clusters and novel protein-protein interactions 25, deduction of local network structure 26 and modeling of protein interactomes 27. Characterization of these networks using 3-dimensional structures provides insight into their evolutionary rate and mechanisms of growth 28.
Building blocks of this network are smaller sub-networks that are generally referred to as motifs 29,30 that are compact topologically distinct patterns within the larger network. Network motifs are usually described as patterns of interconnections occurring in complex networks at numbers that are significantly higher than those in randomized networks29. Complexity of an interaction motif can be gauged by the number of interaction amongst its constituents. There is now accumulating evidence that the connectivity of proteins and hence complexity of the motifs they are embedded in correlates well with their functional essentiality 16,31-35. Proteins embedded in more topologically complex motifs interact with a larger number of other proteins and hence are expected to be involved in a greater number of functions. The most highly-connected proteins in a cell are the most important for its survival, and the likelihood that removal of a protein will prove lethal correlates with the number of interactions it has 16. Therefore, a certain way of maintaining the robustness of these topological components is desired as any perturbation in these hubs will be deleterious. Earlier, it has also been shown that conservation of motifs correlates well with the interconnectedness of the constituent proteins 31. These studies provide ample evidence that there is a selective pressure on the organism to conserve the highly-connected proteins.
Protein-protein interaction data has been integrated with other kinds of data such as transcriptome, phenome and gene expression data 17,36,37. Integration of PPI with gene expression showed that protein pairs encoded by co-expressed genes interact with each other more frequently than random pairs 38. Based on the co-expression levels among their constituents, Jansen et al classified yeast protein complexes as either permanent or transient, with permanent ones being maintained through most cellular conditions 39. Previously, we have also shown that there is a strong relationship between PPI and gene expression for E. coli and it can be further strengthened, for some other species, by integration of evolutionary information 40. However, all these cross-correlating studies focused on two-body interactions. While the results in these studies gave useful insights into how one data is reflected in another, studying multi-body interactions augments our understanding of the underlying interactome-transcriptome relationship. Here, we extend the analysis to multi-body interaction to investigate the relationship between the structure of the motif the proteins are embedded in and the co-expression patterns of the parent genes. It should be noted here that in this study we refer to motifs as distinct topological cohesive patterns of interactions. This definition of motifs which relates more to their specific organization in the network than their frequencies has been used in other previous contexts and studies31. We choose Saccharomyces cerevisiae (Baker's yeast) as the model species for this analysis because the interaction and the expression data for this species are plentifully available. This combination is conducive to statistically significant conclusions. We analyze several distinct topological motifs of increasing complexity, both in terms of the number of nodes and the number of edges, and find that as complexity of an interaction motif increases, there is a higher level of co-expression amongst its constituent proteins as compared to similar motifs from a random network with the same topology. Since the complexity of a motif reflects its essentiality, our findings show that for more important motifs, there is an increasing congeniality between their components as compared to random motifs. Taken together with the fact that co-expression patterns of genes indicate congruent protein concentrations, the results here suggest that there is a strong accord between the placement of the proteins in these networks and their amounts. This kind of association may be another way of deriving robustness by these networks in addition to the previously illustrated retention of such highly connected motifs through synergistic selection 31.
We have earlier shown that co-expression of the genes encoding for two proteins that interact is conserved across species and integration of evolutionary information strengthens the correlation between gene expression and protein interactions 40. Here, in a similar way, extending the concept from pair-wise interactions to multi-body interactions, we include evolutionary information across three other species: E. coli, mouse and human. The correlation coefficient for each edge of a motif in yeast is enriched by averaging it over the ‘orthologous edges’ between the orthologous pairs in the other three species. We find that such integration further augments the mean correlation for a motif. Interestingly, we also find that the degree of this enrichment is correlated with the complexity of the motif; a more complex motif witnesses a much higher increase in its mean correlation amongst its constituents. Our results suggest that this kind of essential modularity may be an embedded feature of interaction networks in other organisms.
2. Materials and Methods
2.1. Databases
For a list of experimentally-detected protein-protein interactions in yeast, we used the information contained in the DIP database (28, http://dip.doe-mbi.ucla.edu) (as of Oct 2007). This database has 4958 proteins with 17,525 interactions. Although yeast two-hybrid experiments that are the source of the data are criticized based on the accuracy of their results, 6,28,41 the database currently stands as our current best approximation. Further, due to a large volume of the information in the data, any statistically sound observation will be very likely to reveal the skeletal topology of the network. Orthologs datasets between the species were obtained from the InParanoid database of orthologs (42, http://inparanoid.cgb.ki.se). For this study, we chose only the core orthologous pair providing a bootstrap value of 100% to eliminate one-to-many or many-to-many orthology. Gene expression data for all species were obtained from the publicly available Stanford Microarray database (43, http://genome-www5.stanford.edu). The expression set ranged over different experiments in various biological conditions and was several microarrays in length. The data were normalized against the different conditions used in these experiments by setting the mean of the profile in each experiment to 0 in the z-score fashion 44.
2.2. Motif extraction
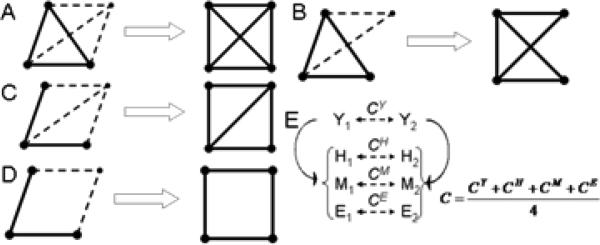
Graphically, a motif is represented as an undirected sub-graph where each node represents a protein and an edge indicates an interaction between them. We used a progressive search procedure to identify 3-, 4-, 5- and 6-node motifs of various complexities (Table 1). Progressive search procedure is a simple motif extraction procedure where more complex motifs are obtained from the less complex ones generated earlier. For example, 4-node cliques are obtained by recursively searching for a protein that interacts with all the three proteins in a 3-node clique (Figure 1A). On the other hand if this protein interacts with two of the three proteins, the resulting motifs is a 4-node motif with one diagonal (Figure 1B).Similarly, beginning with a 3-node motif with two edges we look for a protein that interacts with all three nodes to obtain a 4-node motif with one diagonal (Figure 1C). If this new protein interacts with only two proteins out of the three (that don't have an edge between them), we obtain a 4-node motif without any diagonal (Figure 1D). Of course, at the end of search procedure, we may obtain multiple copies of the same motif, thus we remove the duplicates.
Table 1.
Various types of motifs extracted for Yeast.
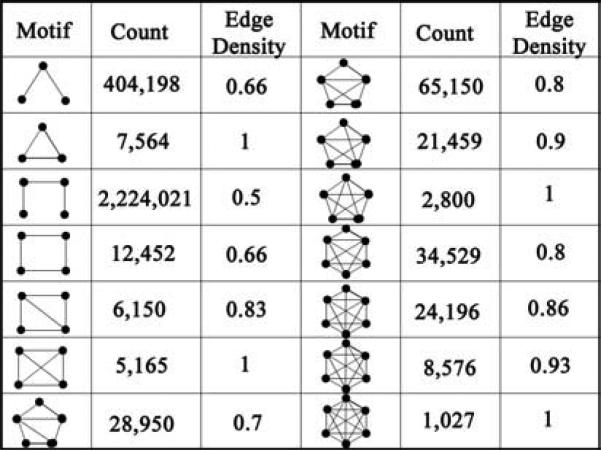 |
Fig. 1.
Extraction of more complex clique motifs using a progressive algorithm and enrichment of an edge (A-D, see text for explanation). (E) Enrichment of an edge in the yeast interaction network by integration of multiple species in the analysis. Solid arrows indicate orthology between proteins from yeast (Y) and other three species: human (H), mouse (M) and E. coli (E). Dashed arrows indicate the correlation coefficient between the proteins from the same species.
2.3. Edge density
Complexity of a motif was quantified in terms of the edge density defined as 2k/(n*(n-1)) where k is the number of existing edges and n is the number of nodes. This definition is similar to clustering coefficient which is a measure of near-neighbors connectivity and, here, is applied to measure the connectivity of constituents of a motif as in previous studies45. This quantity ranges from 0 (for no edges between the nodes) to 1 (for all possible edges existing). For example, complexity of a 4-node motif with 5 edges would be 2*5/(4*(3)) = 10/12 = 0.83 and that for a 5-node motif with 9 edges would be 2*9/(5*(4)) = 18/20 = 0.9.
2.4. Generation of random motifs
To examine the statistical significance of the interaction motif data we compared it to a control set. Since this study mainly relates to the complexity of the motifs, a property based on the topology of the network, we chose to generate a null model with the same topology and degree distribution as used previously 17. This was done by shuffling the node labels while keeping the interaction edges constant. This method has been used in previous studies as well. Since the overall topology of the network is preserved, exactly same number of random motifs was generated as the interaction motifs for each kind of motif.
2.5. Correlation with co-expression
For each motif we calculated the level of co-expression between all the pairs if there existed an edge between them. The Pearson correlation coefficient (PCC) was employed as the measure of correlation between the expression profiles of the constituents. Mean correlation coefficient for a motif was obtained by taking the average of PCC over all the edges and it was used to represent the overall co-expression for this motif. Any consistent trend in the distribution of this coefficient for motifs of different complexities reflects a correlation between their topological compactness and expression profiling among their constituent proteins.
We performed similar computations for random sets of motifs to judge the statistical significance of this correlation. For comparisons of the distributions of PCC for motifs in interaction and random network, we used the kernel density function (described in the supplementary materials). Briefly, for a random variable X, let x be the observed value of X, then
| (1) |
where fX(x) is an associated density function. One of the types of fX is the Kernel density function which is of the form:
| (2) |
where K is the kernel function, h is the bandwidth and n is the number of equally spaced points around which the density is to be estimated. Here, h acts a smoothing parameter: it smoothens out the contribution of each observed data point over a local neighborhood of that data point. The contribution of data point x(i) to the estimate at some point x* depends on how apart x(i) and x* are. The extent of this contribution is dependent upon the shape of the kernel function adopted and the bandwidth h accorded to it. It is important to choose an appropriate value as small values of h lead to very spiky estimates (under-smoothing) while larger h values lead to oversmoothing. We chose Gaussian kernel function, which is of the form:
| (3) |
Quantitatively, a higher value of kernel density at any abscissa reflects a higher probability of the variable falling around that abscissa.
2.6. Integration of evolutionary information
Orthologous interaction pairs in the other three species were generated from the list of orthologs for each interacting pair in yeast (Figure 1E). PCC was calculated for each of these three orthologous pairs. Final correlation for the original pair in yeast was obtained by averaging the PCC over all the four pairs (one for yeast and three for orthologous pairs). For those pairs in yeast that had no known orthologous pairs in one or more of the three species, average correlation was obtained by averaging only over the species that had orthologous pairs present.
3. Results
The number of each type of motif extracted from the interaction network in yeast is indicated in Table 1 along with its edge density. To correlate gene expression with protein interaction, we used the Pearson correlation coefficient (PCC) calculated between the expression profiles of the genes whose protein products interact. Mean correlation for an interaction motif was obtained by averaging it over all the constituent proteins that interact. To appraise the statistical significance of the correlation distribution for the interaction data, we compared it to the distribution for a random network with a similar topology.
3.1 Correlation in Yeast
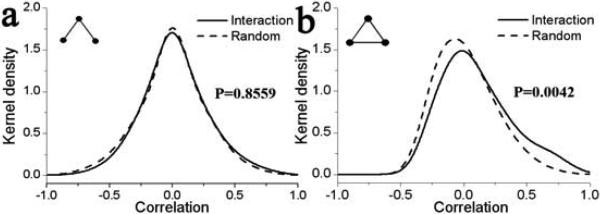
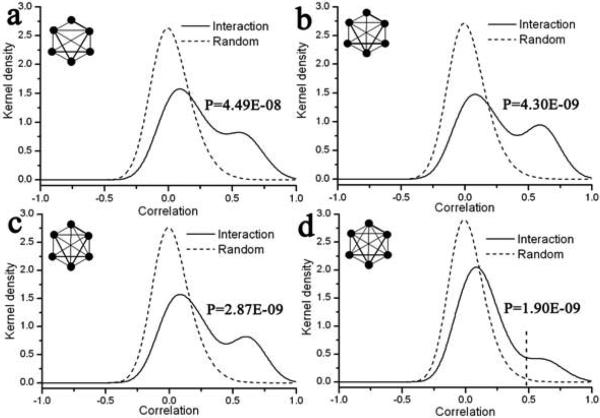
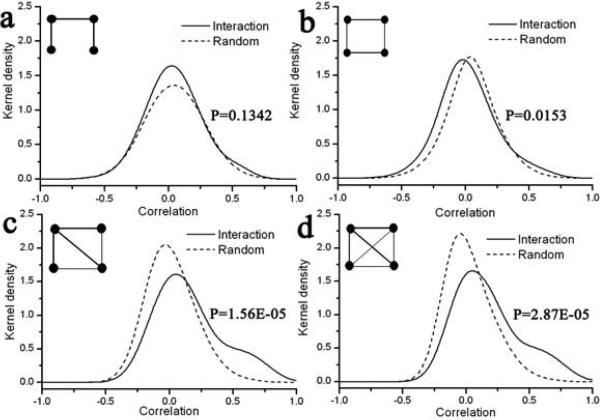
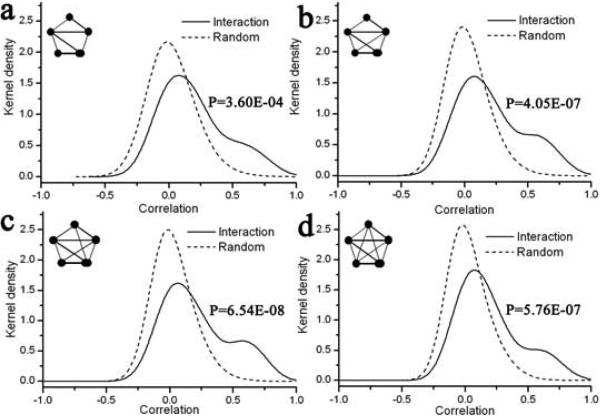
We find that there is a well-defined correlation between topological complexity of an interaction motif and co-expression amongst its constituent proteins (Figure 2-5). This correlation is depicted in two parallel ways. First, as the complexity in terms of number of edges increases, the density distribution of correlation coefficient for interaction motifs deviates more from randomness implying a higher level of co-expression between the constituents of a motif with more complex architecture. For example, distribution for a 4-node motif with all 6 edges (Figure 3d) is more dissimilar to that for a random network than the one for 4-node motif with 3 or 4 edges (Figure 3a and 3b). Second, the extent of deviation from randomness is higher also with the number of nodes. As an example, the dissimilarity between the interaction and random data is more for a 6-node clique than a 3- or 4-node clique. The above observation emphasizes a well-defined coordination between proteins placed in a compact interaction motif and suggests that a dense motif displays a more co-expression amongst its components.
Fig. 2.
Kernel density function of expression correlation for interaction and random motifs with 3 nodes. The different motifs are shown in the left inset. P-values are indicated on the right inset for the KS-test with the null-hypothesis that the interaction and the random data come from the same underlying distributions.
Figure 5.
Kernel density function of expression correlation for interaction and random motifs with 6 nodes. See figure 2 for legend.
Fig.3.
Kernel density functions of expression correlation for interaction and random motifs with 4 nodes. See figure 2 for legend.
We also report the P-value computed by the non-parametric Kolmogorov-Smirnov (KS) test (right inset in figures 2-5). P-value indicates the probability that the two distributions are coming from the same parent distribution, so a lower value would reflect a larger dissimilarity of the two datasets. From the trend in P-values for different motifs with the same number of nodes, it can be seen that more compact motifs have lower P-values, indicating that the distribution of their correlation values is more departed from random distribution. For example, the P-value for motifs with four nodes decreases as 0.1342, 0.0153, 1.56×10⁻⁵ and 2.87×10⁻⁵ as the number of edges between the participating proteins increases (Fig. 3).
A distinctive feature of the distribution of the correlation values is the diminishing width of the random distribution as the complexities of the motifs increase. As shown in the supplementary figure 1, the variance of the correlation values for random motifs decreases with the edge density of the motifs. This is a logical consequence of the fact that it is less probable for a random motif of higher complexity to show a larger correlation amongst its components. In order to obtain a high correlation value for a more complex motif, a co-expression between all the constituents is required, which is less probable for a random motif.
Another striking observation from the density function of the interaction motifs is the bimodal nature of the distribution in case of motifs with more than 5-nodes. This observation has been reported previously in Han et al 17 where the average PCCs of ‘hubs’, defined as proteins with degree k more than 5, follow a bimodal distribution. Interestingly, we also found that the bimodal nature starts to appear for 5-node motifs and is more pronounced in case of 6-node motifs. Based on the bimodal nature, in that study, hubs were split into two populations based on a cutoff: one with high average PCC and the other with relatively lower PCC. The former kinds of hubs were called ‘party’ hubs that interact with their partner at the same place and time and hence have high higher correlation across different conditions. The latter kind, on the other hand, called the ‘date’ hubs, interact with their partners at different time and/or space and so do not have as high correlation. In a parallel way, we investigated the spatial distribution of these motifs in various subcellular locations. We chose 6-node cliques as our example set and based on their distribution, we set up a correlation cutoff of 0.48 (the dashed vertical line in figure 5d). Analogous to previous definition, for a motif to be called a ‘party motif’, all its constituents have to be in the same subcellular location. If any two of its constituents are from two different locations (such as nucleus and cytoplasm), it would not be possible for the motif to exist at the same place/time and so it would be a ‘date motif’. Interestingly, with this criteria, we found that 86% of the motifs having mean correlation above the aforementioned cutoff qualified to be ‘party motifs’ i.e., they had all their constituents from the same subcellular location. Moreover, 89% of motifs with mean correlation below the cutoff had at least one protein from a different location from the rest of the constituents. This observation, while giving useful insight into the spatial dynamics of these motifs, demonstrates that the expression patterns of a protein are correlated not only with its interaction partner, but also its placement in the network and its subcellular location.
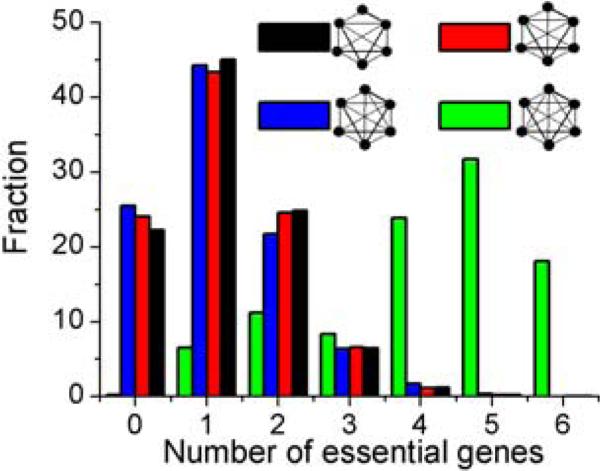
It has earlier been shown that in PPI network, hubs tend to be essential genes that are indispensable to the survival or reproduction of an organism16. To see how our results align with this previous observation, we focused on those proteins that are embedded in dense motifs such as the cliques or motifs with higher number of proteins as these proteins correspond to hubs in our framework. We examined all kinds of 6-node motifs of increasing complexity for the number of constituent proteins that correspond to essential genes. The list of essential genes in yeast was obtained from a previous study46 that annotated these genes based on experimental validation carried out by the Saccharomyces Genome Deletion Consortium47. We observed that as the edge density of the 6-node motifs increases, the number of proteins corresponding to essential genes increases (figure 6). This observation is parallel to the observation of Jeong et al16 suggesting that more essential proteins are involved in more interactions and are embedded in denser motifs.
Figure 6.
Fraction of different kinds of 6-node motifs with the number of essential genes present in the motif.
It has been shown with conclusive evidence that interacting proteins are more likely to be involved in similar function and hence protein function can efficiently assigned using the protein-protein interaction information48,49. We believe that extending the prediction from that based on pairwise interaction information to multi-body interactions (between highly co-expressed proteins) will lend higher confidence to the predicted function. For this purpose, we examined some case-studies by focusing on those 6-node clique motifs that had co-expression coefficient > 0.9 amongst their constituents and had atleast one protein without any GO process term associated with it so that predictions could be made about this protein. With these filters, we found 3 such cases (Table 2). As evident from Table 2, proteins embedded in these three motifs are all involved in a broader category of metabolic processes so we believe that there is a high probability that the protein(s) with unknown GO process is (are) also involved in some kind of metabolic processes. In fact, for one of the proteins (P39542), this process assignment is obtained all three independent motifs thus giving high confidence to this assignment.
Table 2.
Predictions about the GO process terms for some proteins based on the multibody interactions between the partners of the motifs they are embedded in.
| Proteins with known GO processes | GO Processes | Protein(s) with unknown GO processes |
|---|---|---|
| P38287, P38993, P46962, P49089, P38843 | lipid metabolic process, RNA metabolic process, amino acid and derivative metabolic process, carbohydrate metabolic process | P39542 |
| P38843, P38993, P49089, P46962 | carbohydrate metabolic process, amino acid and derivative metabolic process, RNA metabolic process | P36058, P39542 |
| P04819,, P35207, P38287, P38843, P46962 | DNA metabolic process, RNA metabolic process, lipid metabolic process, carbohydrate metabolic process | P39542 |
3.2 Enrichment of the correlation by inclusion of multiple species
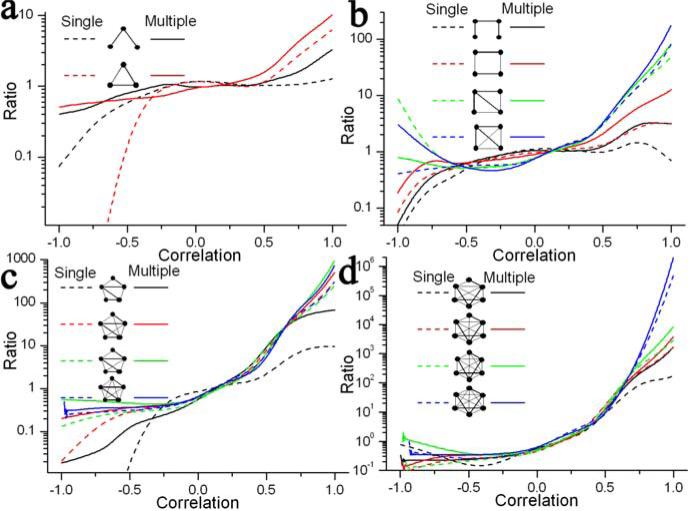
Previously we had demonstrated that co-expression of the genes whose protein products interact is preferentially conserved across genomes 40. We thus integrated evolution information to strengthen the correlation between gene expression and protein-protein interactions. Here we extend this idea to multi-body interactions among different motifs. We enriched the correlation for an edge in a motif by merging information from three other species: human, mouse and E. coli. For each pair in yeast sharing an edge, orthologous pairs were generated in these three species and a correlation was computed for these pairs. Mean correlation for the original pair was obtained by averaging it over all the four species. Similar realizations were generated for random motifs from the null network. Kernel density distributions for interaction and random pairs were computed after the enrichment. We plot the ratio of kernel density for interaction and random motifs after enrichment and compare it to a similar ratio before the integration of multiple species.
We find that the addition of multiple species augments the co-expression coherence amongst the constituent proteins in an interaction motif by several folds. This is evident from the ratio of kernel density before and after the inclusion of multiple species for different kinds of motifs (Figure 7). For example, the ratio for 6-node cliques increases from ∼8073 to 15311 when the expression correlation is 0.85. Analogous to the observation for yeast, we perceive that the extent of improvement in the correlation due to co-expression is correlated with the complexity of a motif; a more complex motif experiences a much higher improvement than a less complex one. For example, when the expression correlation is 0.9, the ratio for 6-node cliques increases 1.9-fold, as compared to 1.7-fold increase for 6-node motifs with one edge missing or 1.8-fold increase for 5-node cliques with the same expression correlation. Overall, the above observations demonstrate that evolutionary information can be integrated purposefully to further boost multi-body correlations amongst the component proteins of an interaction motif.
Figure 7.
Ratio of kernel density for interaction and random data for 3-node (A), 4-node (B), 5-node (C) and 6-node motifs (D). Different curves correspond to different motifs before (single) and after the addition of multiple species (multiple). Y-axis is drawn on logarithmic scale
4. Discussion
A protein interaction motif is a type of molecular machine that consists of proteins carrying out similar vital functions. When two proteins interact, they are more likely to be involved in the same function or pathway. For smooth running of the pathway or function, the participating proteins are required to be in the right amounts; scarcity or overabundance of one relative to the other will be a hindrance. A balanced amount of each of them necessitates co-expression of the encoding genes. In spirit with this argument, we have shown that as the connectivity and indispensability of a motif increases, there is higher coherence amongst the constituents through transcriptome co-expression.
We have analyzed distinct topological motifs from the protein-protein interaction network of yeast, a species for which the data are plentifully available. We have calculated the gene-expression correlations between the genes encoding for proteins embedded in 3-, 4-, 5- and 6-node motifs with increasing complexities, and then compared them to random motifs of similar complexities from a null model of same topology and degree distribution. Our genome-wide analysis shows that the expression among the constituents of interaction motifs is much more correlated than that amongst random motifs and this level of co-expression increases as the complexity of the motifs increases. This kind of cohesive pattern in the architecture of protein-protein interactions suggest that there is a synchronicity among proteins embedded in topologically complex motif derived through their co-expression. The underpinning idea of this study is in consistence with earlier observations which showed that more-connected proteins are more vital to the mechanics of the cell 16,32. Thus, a higher selective pressure is required to retain these proteins and render robustness against random mutations. The results above also prove that topological and contextual placement of a protein in the cellular network may impose a stoichiometric influence on the expression of the gene that encodes for it. We have also shown that this kind of coherent patterns in interactome-transcriptome maps is further amplified by purposeful articulation of distant genotypes. This is expected in light of the recent demonstration that integration of conservation information by inclusion of multiple species increases the correlation between gene expression profiles and pair-wise interactions indicating that the co-expression of an interaction pair is more conserved than random pairs 22,40. The presence of such underlying cohesive patterns in the interaction network topology is a meaningful implication of the fact that co-expression of genes whose protein products interact is evolutionarily coupled.
Beyond unraveling the relation between an interaction motif's importance and its underlying coherence through co-expression of the constituents, this cross-correlation study may also find application in the prediction of protein-protein interaction. To begin with, if a protein observes a very high co-expression with all the other proteins in an interaction motif, it is more likely to interact with all or some of them. This kind of multi-body predictions will be more refined and reliable in comparison to prediction based on a simple pair-wise correlation (as studied with an example above). More broadly, such types of cross-reference studies will aim to provide a platform for meaningful juxtaposition of various datasets and approaches to provide meaningful insights into underlying patterns in the immense amount of data being generated presently.
Supplementary Material
Figure 4.
Kernel density function of expression correlation for interaction and random motifs with 5 nodes. See figure 2 for legend.
Acknowledgments
This work is partially supported by NIH grant P01 AI69015 to H.L. N.B. gratefully acknowledges the support from FMC Technologies, Inc., Fellowship. The authors also wish to thank the anonymous reviewers for their useful suggestions that helped improve the quality of this work.
Contributor Information
NITIN BHARDWAJ, Bioinformatics Program, University of Illinois at Chicago 820, S. Woods Street, Room 103, Chicago, Illinois, USA 60607 nbhard2@uic.edu.
HUI LU, Bioinformatics Program, University of Illinois at Chicago 820, S. Woods Street, Room 103, Chicago, Illinois, USA 60607 huilu@uic.edu.
References
- 1.Fell DA, Wagner A. The small world of metabolism. Nat Biotechnol. 2000;18(11):1121–1122. doi: 10.1038/81025. [DOI] [PubMed] [Google Scholar]
- 2.Guelzim N, Bottani S, Bourgine P, et al. Topological and causal structure of the yeast transcriptional regulatory network. Nat Genet. 2002;31(1):60–63. doi: 10.1038/ng873. [DOI] [PubMed] [Google Scholar]
- 3.Thieffry D, Huerta AM, Perez-Rueda E, et al. From specific gene regulation to genomic networks: a global analysis of transcriptional regulation in Escherichia coli. Bioessays. 1998;20(5):433–440. doi: 10.1002/(SICI)1521-1878(199805)20:5<433::AID-BIES10>3.0.CO;2-2. [DOI] [PubMed] [Google Scholar]
- 4.Barabasi AL, Oltvai ZN. Network biology: understanding the cell's functional organization. Nat Rev Genet. 2004;5(2):101–113. doi: 10.1038/nrg1272. [DOI] [PubMed] [Google Scholar]
- 5.Fields S, Song O. A novel genetic system to detect protein-protein interactions. Nature. 1989;340(6230):245–246. doi: 10.1038/340245a0. [DOI] [PubMed] [Google Scholar]
- 6.Ito T, Chiba T, Ozawa R, et al. A comprehensive two-hybrid analysis to explore the yeast protein interactome. Proc Natl Acad Sci U S A. 2001;98(8):4569–4574. doi: 10.1073/pnas.061034498. [DOI] [PMC free article] [PubMed] [Google Scholar]
- 7.Uetz P, Giot L, Cagney G, et al. A comprehensive analysis of protein-protein interactions in Saccharomyces cerevisiae. Nature. 2000;403(6770):623–627. doi: 10.1038/35001009. [DOI] [PubMed] [Google Scholar]
- 8.Causier B. Studying the interactome with the yeast two-hybrid system and mass spectrometry. Mass Spectrom Rev. 2004;23(5):350–367. doi: 10.1002/mas.10080. [DOI] [PubMed] [Google Scholar]
- 9.Legrain P, Wojcik J, Gauthier JM. Protein--protein interaction maps: a lead towards cellular functions. Trends Genet. 2001;17(6):346–352. doi: 10.1016/s0168-9525(01)02323-x. [DOI] [PubMed] [Google Scholar]
- 10.Willats WG. Phage display: practicalities and prospects. Plant Mol Biol. 2002;50(6):837–854. doi: 10.1023/a:1021215516430. [DOI] [PubMed] [Google Scholar]
- 11.Puig O, Caspary F, Rigaut G, et al. The tandem affinity purification (TAP) method: a general procedure of protein complex purification. Methods. 2001;24(3):218–229. doi: 10.1006/meth.2001.1183. [DOI] [PubMed] [Google Scholar]
- 12.Rigaut G, Shevchenko A, Rutz B, et al. A generic protein purification method for protein complex characterization and proteome exploration. Nat Biotechnol. 1999;17(10):1030–1032. doi: 10.1038/13732. [DOI] [PubMed] [Google Scholar]
- 13.Aebersold R, Mann M. Mass spectrometry-based proteomics. Nature. 2003;422(6928):198–207. doi: 10.1038/nature01511. [DOI] [PubMed] [Google Scholar]
- 14.Bauer A, Kuster B. Affinity purification-mass spectrometry. Powerful tools for the characterization of protein complexes. Eur J Biochem. 2003;270(4):570–578. doi: 10.1046/j.1432-1033.2003.03428.x. [DOI] [PubMed] [Google Scholar]
- 15.Yook SH, Oltvai ZN, Barabasi AL. Functional and topological characterization of protein interaction networks. Proteomics. 2004;4(4):928–942. doi: 10.1002/pmic.200300636. [DOI] [PubMed] [Google Scholar]
- 16.Jeong H, Mason SP, Barabasi AL, et al. Lethality and centrality in protein networks. Nature. 2001;411(6833):41–42. doi: 10.1038/35075138. [DOI] [PubMed] [Google Scholar]
- 17.Han JD, Bertin N, Hao T, et al. Evidence for dynamically organized modularity in the yeast protein-protein interaction network. Nature. 2004;430(6995):88–93. doi: 10.1038/nature02555. [DOI] [PubMed] [Google Scholar]
- 18.Ravasz E, Somera AL, Mongru DA, et al. Hierarchical organization of modularity in metabolic networks. Science (New York, N.Y. 2002;297(5586):1551–1555. doi: 10.1126/science.1073374. [DOI] [PubMed] [Google Scholar]
- 19.Maslov S, Sneppen K. Specificity and stability in topology of protein networks. Science. 2002;296(5569):910–913. doi: 10.1126/science.1065103. [DOI] [PubMed] [Google Scholar]
- 20.Hartwell LH, Hopfield JJ, Leibler S, et al. From molecular to modular cell biology. Nature. 1999;402(6761 Suppl):C47–52. doi: 10.1038/35011540. [DOI] [PubMed] [Google Scholar]
- 21.Spirin V, Mirny LA. Protein complexes and functional modules in molecular networks. Proceedings of the National Academy of Sciences of the United States of America. 2003;100(21):12123–12128. doi: 10.1073/pnas.2032324100. [DOI] [PMC free article] [PubMed] [Google Scholar]
- 22.Fraser HB, Hirsh AE, Wall DP, et al. Coevolution of gene expression among interacting proteins. Proc Natl Acad Sci U S A. 2004;101(24):9033–9038. doi: 10.1073/pnas.0402591101. [DOI] [PMC free article] [PubMed] [Google Scholar]
- 23.Bloom JD, Adami C. Apparent dependence of protein evolutionary rate on number of interactions is linked to biases in protein-protein interactions data sets. BMC evolutionary biology. 2003;3:21. doi: 10.1186/1471-2148-3-21. [DOI] [PMC free article] [PubMed] [Google Scholar]
- 24.Jordan IK, Wolf YI, Koonin EV. No simple dependence between protein evolution rate and the number of protein-protein interactions: only the most prolific interactors tend to evolve slowly. BMC evolutionary biology. 2003;3:1. doi: 10.1186/1471-2148-3-1. [DOI] [PMC free article] [PubMed] [Google Scholar]
- 25.Sen TZ, Kloczkowski A, Jernigan RL. Functional clustering of yeast proteins from the protein-protein interaction network. BMC Bioinformatics. 2006;7:355. doi: 10.1186/1471-2105-7-355. [DOI] [PMC free article] [PubMed] [Google Scholar]
- 26.Wuchty S, Barabasi AL, Ferdig MT. Stable evolutionary signal in a Yeast protein interaction network. BMC Evol Biol. 2006;6:8. doi: 10.1186/1471-2148-6-8. [DOI] [PMC free article] [PubMed] [Google Scholar]
- 27.Bork P, Jensen LJ, von Mering C, et al. Protein interaction networks from yeast to human. Current opinion in structural biology. 2004;14(3):292–299. doi: 10.1016/j.sbi.2004.05.003. [DOI] [PubMed] [Google Scholar]
- 28.Xenarios I, Salwinski L, Duan XJ, et al. DIP, the Database of Interacting Proteins: a research tool for studying cellular networks of protein interactions. Nucleic Acids Res. 2002;30(1):303–305. doi: 10.1093/nar/30.1.303. [DOI] [PMC free article] [PubMed] [Google Scholar]
- 29.Milo R, Shen-Orr S, Itzkovitz S, et al. Network motifs: simple building blocks of complex networks. Science. 2002;298(5594):824–827. doi: 10.1126/science.298.5594.824. [DOI] [PubMed] [Google Scholar]
- 30.Shen-Orr SS, Milo R, Mangan S, et al. Network motifs in the transcriptional regulation network of Escherichia coli. Nat Genet. 2002;31(1):64–68. doi: 10.1038/ng881. [DOI] [PubMed] [Google Scholar]
- 31.Wuchty S, Oltvai ZN, Barabasi AL. Evolutionary conservation of motif constituents in the yeast protein interaction network. Nat Genet. 2003;35(2):176–179. doi: 10.1038/ng1242. [DOI] [PubMed] [Google Scholar]
- 32.Wuchty S. Evolution and topology in the yeast protein interaction network. Genome Res. 2004;14(7):1310–1314. doi: 10.1101/gr.2300204. [DOI] [PMC free article] [PubMed] [Google Scholar]
- 33.Tirosh I, Barkai N. Computational verification of protein-protein interactions by orthologous co-expression. BMC Bioinformatics. 2005;6:40. doi: 10.1186/1471-2105-6-40. [DOI] [PMC free article] [PubMed] [Google Scholar]
- 34.Lehner B, Fraser AG. A first-draft human protein-interaction map. Genome Biol. 2004;5(9):R63. doi: 10.1186/gb-2004-5-9-r63. [DOI] [PMC free article] [PubMed] [Google Scholar]
- 35.Yu H, Greenbaum D, Xin Lu H, et al. Genomic analysis of essentiality within protein networks. Trends Genet. 2004;20(6):227–231. doi: 10.1016/j.tig.2004.04.008. [DOI] [PubMed] [Google Scholar]
- 36.Simon I, Barnett J, Hannett N, et al. Serial regulation of transcriptional regulators in the yeast cell cycle. Cell. 2001;106(6):697–708. doi: 10.1016/s0092-8674(01)00494-9. [DOI] [PubMed] [Google Scholar]
- 37.Wachi S, Yoneda K, Wu R. Interactome-transcriptome analysis reveals the high centrality of genes differentially expressed in lung cancer tissues. Bioinformatics (Oxford, England) 2005;21(23):4205–4208. doi: 10.1093/bioinformatics/bti688. [DOI] [PMC free article] [PubMed] [Google Scholar]
- 38.Grigoriev A. A relationship between gene expression and protein interactions on the proteome scale: analysis of the bacteriophage T7 and the yeast Saccharomyces cerevisiae. Nucleic acids research. 2001;29(17):3513–3519. doi: 10.1093/nar/29.17.3513. [DOI] [PMC free article] [PubMed] [Google Scholar]
- 39.Jansen R, Greenbaum D, Gerstein M. Relating whole-genome expression data with protein-protein interactions. Genome research. 2002;12(1):37–46. doi: 10.1101/gr.205602. [DOI] [PMC free article] [PubMed] [Google Scholar]
- 40.Bhardwaj N, Lu H. Correlation between gene expression profiles and protein-protein interactions within and across genomes. Bioinformatics. 2005;21(11):2730–2738. doi: 10.1093/bioinformatics/bti398. [DOI] [PubMed] [Google Scholar]
- 41.Enright AJ, Iliopoulos I, Kyrpides NC, et al. Protein interaction maps for complete genomes based on gene fusion events. Nature. 1999;402(6757):86–90. doi: 10.1038/47056. [DOI] [PubMed] [Google Scholar]
- 42.Remm M, Storm CE, Sonnhammer EL. Automatic clustering of orthologs and in-paralogs from pairwise species comparisons. J Mol Biol. 2001;314(5):1041–1052. doi: 10.1006/jmbi.2000.5197. [DOI] [PubMed] [Google Scholar]
- 43.Gollub J, Ball CA, Binkley G, et al. The Stanford Microarray Database: data access and quality assessment tools. Nucleic Acids Res. 2003;31(1):94–96. doi: 10.1093/nar/gkg078. [DOI] [PMC free article] [PubMed] [Google Scholar]
- 44.Cheadle C, Cho-Chung YS, Becker KG, et al. Application of z-score transformation to Affymetrix data. Appl Bioinformatics. 2003;2(4):209–217. [PubMed] [Google Scholar]
- 45.Itzkovitz S, Milo R, Kashtan N, et al. Subgraphs in random networks. Phys Rev E Stat Nonlin Soft Matter Phys. 2003;68(2 Pt 2):026127. doi: 10.1103/PhysRevE.68.026127. [DOI] [PubMed] [Google Scholar]
- 46.Seringhaus M, Paccanaro A, Borneman A, et al. Predicting essential genes in fungal genomes. Genome Res. 2006;16(9):1126–1135. doi: 10.1101/gr.5144106. [DOI] [PMC free article] [PubMed] [Google Scholar]
- 47.Giaever G, Chu AM, Ni L, et al. Functional profiling of the Saccharomyces cerevisiae genome. Nature. 2002;418(6896):387–391. doi: 10.1038/nature00935. [DOI] [PubMed] [Google Scholar]
- 48.Chen Y, Xu D. Computational analyses of high-throughput protein-protein interaction data. Curr Protein Pept Sci. 2003;4(3):159–181. doi: 10.2174/1389203033487225. [DOI] [PubMed] [Google Scholar]
- 49.Letovsky S, Kasif S. Predicting protein function from protein/protein interaction data: a probabilistic approach. Bioinformatics. 2003;19(Suppl 1):i197–204. doi: 10.1093/bioinformatics/btg1026. [DOI] [PubMed] [Google Scholar]
Associated Data
This section collects any data citations, data availability statements, or supplementary materials included in this article.


