

Abstract
The purpose of this computational study was to investigate the possible role of voltage-gated Ca2+ channels in spontaneous Ca2+ oscillations of astrocytes. By incorporating different types of voltage-gated Ca2+ channels and a previous model, this study reproduced typical Ca2+ oscillations in silico. Our model could mimic the oscillatory phenomenon under a wide range of experimental conditions, including resting membrane potential (−75 to −60 mV), extracellular Ca2+ concentration (0.1 to 1500 μM), temperature (20 to 37°C), and blocking specific Ca2+ channels. By varying the experimental conditions, the amplitude and duration of Ca2+ oscillations changed slightly (both <25%), while the frequency changed significantly (∼400%). This indicates that spontaneous Ca2+ oscillations in astrocytes might be an all-or-none process, which might be frequency-encoded in signaling. Moreover, the properties of Ca2+ oscillations were found to be related to the dynamics of Ca2+ influx, and not only to a constant influx. Therefore, calcium channels dynamics should be used in studying Ca2+ oscillations. This work provides a platform to explore the still unclear mechanism of spontaneous Ca2+ oscillations in astrocytes.
Introduction
Astrocytes are probably the most diverse population of glial cells (1). Twenty years ago, astrocytes were merely thought to function as passive histological support elements in the nervous system (2). Recent groundbreaking studies of astrocytes have suggested that these cells have a more active and direct role in the dynamic regulation of cerebral microcirculation (3–5), neuronal production (6–8), synaptic transmission (9,10), neuronal activation (11), and specific neurological diseases (12–15). Spontaneous astrocytic Ca2+ oscillations have been observed and implicated in important functions of the brain (11,16–18). However, the mechanism of spontaneous Ca2+ oscillations is still unclear. Therefore, it is critical to understand how the Ca2+ oscillations are generated and modulated.
Many experimental results suggested that an inositol 1,4,5-triphosphate (IP3) dependent calcium-induced calcium release (CICR) mechanism is involved in Ca2+ oscillations (16,18,19). This was central to the process in the intracellular space (ICS). In fact, the Ca2+ oscillations needed both extracellular and intracellular Ca2+ contribution (17). Voltage-gated calcium channels (VGCCs) were found to be involved in Ca2+ oscillations in pharmacological trials (11,16,17,20). The putative notion of Ca2+ oscillations in astrocytes was that a small influx of Ca2+ into the cytoplasm via VGCCs induces CICR activated by IP3 (21–23). Several models have been previously developed to describe Ca2+ oscillations in the cytoplasm (24–27). In Lavrentovich and Hemkin's (LH) work, a mathematical model was successfully employed to simulate the IP3-dependent CICR process (26). The initiation of Ca2+ oscillations was hypothesized to be due to a small and constant influx of calcium ions through the membrane. The model showed qualitative consistency with experiments (11,16,17). However, the pathway of Ca2+ influx was not clarified. To the best of our knowledge, no model has taken VGCCs into account during the spontaneous Ca2+ oscillations in astrocytes. Here we expand the LH model by combining it with different types of VGCCs. The electrophysiological properties of these VGCCs were described by the Hodgkin-Huxley (HH) equations (28). Since the Ca2+ influx would be mediated by physiologically relevant conditions (membrane potential, extracellular Ca2+ concentration, temperature, and blocking of specific channels), in this study, a variable but tractable Ca2+ influx replaced a constant flow. The Ca2+ oscillations dynamics (including the onset, frequency, half-maximal duration, and amplitude) in the physiologically relevant range were analyzed. The simulation results reasonably mimicked the experimental observations of spontaneous Ca2+ oscillations in astrocytes.
Methods
The HH equation and the LH model were combined: Ca2+ influx via VGCCs induces IP3-activated CICR and cytosol Ca2+ oscillations. Three compartments were considered, including the extracellular space (ECS), intracellular space (ICS), and the intraspace of endoplasmic reticulum (ER). Three variables (Ca2+ concentration in ICS and ER, and IP3 concentration in ICS) were mainly modeled in this study.
Voltage-gated calcium channels
The astrocyte is separated from the ECS by the membrane, with two compartments representing ECS and ICS. The different types of VGCCs are distributed in the cellular membrane and form the pathway of calcium ions influx (Fig. 1). According to physiological and pharmacological properties, VGCCs are classified as low-voltage-activated channels (T-type) and several types of high-voltage-activated channels (L-, N-, P-, Q-, and R-types) (1,29). Previous studies showed that the electrophysiological properties in astrocytes resemble those of corresponding VGCCs in neurons (1,29,30). For simplicity, in this model, the P-, Q-, and R-types were grouped together as one type represented by the R-type. Thus, four HH equations were used to model the VGCCs with the same formula, but with modified conductance parameters from the work of Amini et al. (31). The four new parameters (Table 1) were smaller than those in Amini et al. (31) and were determined by the method of trial-and-error. Based on electrophysiological data (30), in this work, the T-type conductance was the smallest.
Figure 1.
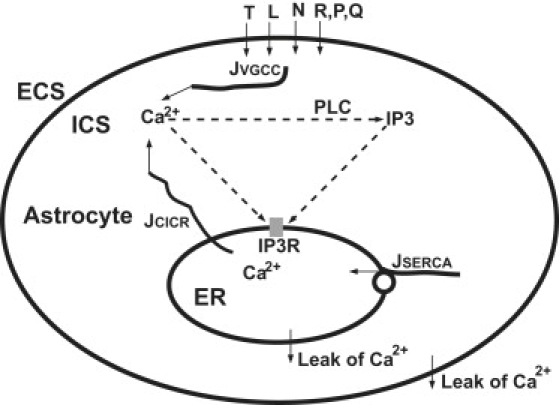
Schematic drawing of voltage-gated calcium channels (VGCCs) mediating Ca2+ oscillations. The main features within the astrocyte were referred to in Lavrentovich and Hemkin's model (26). Different VGCCs (T, L, N, R, P, and Q) form Ca2+ influx JVGCC from the extracellular space (ECS) to the intracellular space (ICS). Cytoplasmic Ca2+ enhances the production of inositol 1,4,5-triphosphate (IP3) catalyzed by phospholipase C (PLC). Cytoplasmic Ca2+ and IP3 mediate IP3 receptors (IP3R), inducing Ca2+ flow JCICR out of the endoplasmic reticulum (ER). JSERCA represents ER Ca2+ filling by the sarcoplasmic/endoplasmic reticulum calcium ATPase (SERCA). Two “leak” arrows indicate the leak flux due to the concentration gradient.
Table 1.
Variables and parameters used in the model
| Symbol | Equation∗ | Description | Value (unit) | |
|---|---|---|---|---|
| I | Eq. 1 | Ionic current | fA | |
| g | Eq. 1 | Membrane conductance | μS | |
| m | Eq. 1 | Channel activation variable | — | |
| h | Eq. 1 | Channel inactivation variable | — | |
| V | Eq. 1 | Membrane potential | mV | |
| ECa | Eq. 1 | Nernst potential of Ca2+ | mV | |
| p | Eq. 1 | Integer for activation variable | 1 | |
| q | Eq. 1 | Integer for inactivation variable | 1 | |
| t | Eq. 2 | Time | s | |
| z | Eq. 3 | Valence of Ca2+ ion | 2 | |
| T | Eq. 3 | Temperature | 300 K | |
| R | Eq. 3 | Ideal gas constant | 8.31 J/(mole·K) | |
| F | Eq. 3 | Faraday's constant | 96,485 Coul/mole | |
| Table 2 | Steady conductance of T-type channel | 0.0600 pS | ||
| Table 2 | Steady conductance of L-type channel | 3.5000 pS | ||
| Table 2 | Steady conductance of N-type channel | 0.3900 pS | ||
| Table 2 | Steady conductance of R-type channel | 0.2225 pS | ||
| IVGCC | Eq. 4 | Total Ca2+ current through all VGCCs | fA | |
| Vast | Eq. 5 | Volume of an astrocyte | 5.233 × 10⁻¹³ l | |
| JVGCC | Eq. 5 | Influx of extracellular Ca2+ into cytosol via VGCCs | 0 μM/s (t = 0) | |
| CaCyt | Eq. 6 | Ca2+ concentration in cytosol | 0.1 μM (t = 0) | |
| JCICR | Eq. 6 | IP3-mediated CICR flux to the cytosol from the ER | 0 μM/s (t = 0) | |
| JSERCA | Eq. 6 | The filling with Ca2+ from the cytosol to ER | 0 μM/s (t = 0) | |
| Pout | Eq. 6 | Rate of calcium efflux from the cytosol into ECS | 0.5 s−1 | |
| Pf | Eq. 6 | Rate of leak flux from the ER into the cytosol | 0.5 s−1 | |
| CaER | Eq. 6 | Ca2+ concentration in ER | 1.5 μM (t = 0) | |
| IPCyt | Eq. 8 | IP3 concentration in cytosol | 0.1 μM (t = 0) | |
| JPLC | Eq. 8 | Production of IP3 | 0 μM/s (t = 0) | |
| Pdeg | Eq. 8 | Rate of IP3 degradation | 0.08 s−1 | |
| MCICR | Eq. 9 | Maximum flux of calcium ions into the cytosol | 40 s−1 | |
| PCaA | Eq. 9 | Activating affinity | 0.15 μM | |
| PCaI | Eq. 9 | Inhibiting affinity | 0.15 μM | |
| n1 | Eq. 9 | Hill coefficient | 2.02 | |
| n2 | Eq. 9 | Hill coefficient | 2.2 | |
| PIP3 | Eq. 9 | Half-saturation constant for IP3 activation of IP3R | 0.1 μM | |
| MSERCA | Eq. 10 | Maximum flux across SERCA | 15.0 μM/s | |
| PSERCA | Eq. 10 | Half-saturation constant for SERCA activation | 0.1 μM | |
| MPLC | Eq. 11 | Maximum production rate of PLC | 0.05 μM/s | |
| PPCa | Eq. 11 | Half-saturation constant for calcium activation of PLC | 0.3 μM |
Equations indicate the variables and parameters that are appearing for the first time.
The four types of currents were presented as the T-type calcium channel current (ICa,T), L-type current (ICa,L), N-type current (ICa,N), and the residual high-voltage-activated calcium channel current (ICa,R), which stands for the current combination of R-, P-, and Q-types. All the four types of Ca2+ ionic currents through VGCCs shared the generalized HH form (28):
| (1) |
Here, g is the membrane conductance. The values m and h represent channel activation and inactivation, and p and q are integers that are prespecified and fixed for each type of channel (both are “1” in our model). The values m and h relax exponentially to their steady-state values and according to
| (2) |
V is the membrane potential, and ECa is the Nernst potential for Ca2+ ion:
| (3) |
In Eq. 3, R is the ideal gas constant, T is the temperature, z is the valence of Ca2+ ion, and F is the Faraday constant. The concrete formula for every type of calcium current is given in detail in Table 2. The steady-state activation fraction of different channels versus membrane potential is shown in Fig. 2. Since the period of spontaneous Ca2+ oscillations in astrocytes was reported to be ∼100 s (11,14), the steady-state current of VGCCs was considered here. The total of calcium current flow through VGCCs in an individual cell can be calculated as
| (4) |
Table 2.
Details of the voltage-gated calcium channels
| Channel type | Equation of channel kinetics | ||||||
|---|---|---|---|---|---|---|---|
| T-type |
|
||||||
| L-type |
|
||||||
| N-type |
|
||||||
| R-type |
|
Figure 2.
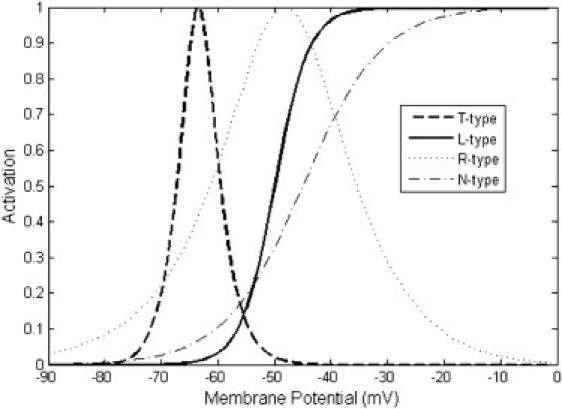
Steady-state activation fraction of different voltage-gated calcium channels. The activation fraction is the normalized product of the activation and inactivation variables m and h from every type of channel. The cytoplasmic Ca2+ concentration was fixed at 0.1 μM for considering the Ca2+ concentration dependence.
In Eq. 4, the entry of calcium current into an astrocyte was defined as negative. To calculate the current contribution to the increase of Ca2+ concentration, the current was converted into the flux as
| (5) |
Vast is the volume of an astrocyte assumed as a spherical soma with a radius of 5 μm, calculated to be 5.233 × 10⁻¹³ l. JVGCC is the change rate of Ca2+ concentration with the unit μM/s. In this way, not only the total Ca2+ flux but also every subpopulation influx via different VGCCs could be recorded.
Calcium-induced calcium release
Some of the previous works showed that astrocytes exhibited Ca2+ oscillations via an IP3-dependent CICR mechanism (16,19,23,25). The recent LH model (26) of this phenomenon was adopted in this study. In the LH model, ER was considered as the calcium store. There were three main variables: Ca2+ concentration in the cytosol (CaCyt); Ca2+ concentration in the ER (CaER); and the IP3 concentration in the cell (IPCyt). Each variable was described by an ordinary differential equation (Eqs. 6–8):
| (6) |
Here JVGCC is the same variable as in Eq. 5. PoutCaCyt represents the rate of calcium efflux from the cytosol into the extracellular space. JCICR represents the IP3-mediated CICR flux to the cytosol from the ER. JSERCA is the flux from the sarcoplasmic/endoplasmic reticulum calcium ATPase (SERCA), which fills the ER with calcium ions from the cytosol. Pf(CaER–CaCyt) describes the leakage flux from the ER into the cytosol along the concentration gradient:
| (7) |
In Eq. 7, all three terms on the right-hand side have the same meaning as in Eq. 6.
| (8) |
In Eq. 8, JPLC denotes IP3 production, and PdegIPCyt represents IP3 degradation. In the above three equations, Pout, Pf, and Pdeg are constants, whereas the other three terms JCICR, JSERCA, and JPLC are determined by the following three equations:
| (9) |
| (10) |
| (11) |
Among them, MCICR, MSERCA, MPLC, PCaA, PCaI, PIP3, PSERCA, PPCa, n1, and n2 are all constants. All the variables and parameters used in the model are listed in Table 1. The majority of the parameters were the same as in the LH model (26). For some variables, the initial values are indicated as t = 0 in Table 1.
Implementation
All the computations and visualizations of the model were implemented in the MATLAB environment (MATLAB7.0,The MathWorks, Natick, MA). The model system was discretized with a temporal precision of 10 ms. The canonical explicit difference method was used to solve the three ordinary differential equations (Eqs. 6–8). All the variables in the model were calculated and recorded with double precision. A specific script for the model was constructed (supplied in the Supporting Material). Five parameters (the onset, frequency, period, half-maximal duration, and amplitude) were used to describe the properties of Ca2+ oscillations. The onset value was calculated as the time from the initiation of simulation to the first peak time-point of Ca2+ oscillations. The other four parameters were routinely defined as the same as in the oscillations phenomena (32), and the half-maximal duration was labeled “duration” in Tables 3 and 4.
Table 3.
Properties of Ca2+ oscillations under different membrane potentials
| Potential (mV) | Amplitude (μM) | Period (s) | Frequency (Hz) | Onset (s) | Duration (s) |
|---|---|---|---|---|---|
| −70 | 0.5276 | 528.1 | 0.0019 | 517.2 | 13.51 |
| −69 | 0.5726 | 301.6 | 0.0033 | 289.5 | 13.87 |
| −68 | 0.5977 | 222.5 | 0.0045 | 209.8 | 14.15 |
| −67 | 0.6211 | 177.5 | 0.0056 | 164.1 | 14.47 |
| −66 | 0.6438 | 150.2 | 0.0067 | 136.1 | 14.84 |
| −65 | 0.6614 | 139.5 | 0.0072 | 125.0 | 15.26 |
Table 4.
Properties of Ca2+ oscillations under different extracellular Ca2+ concentrations
| CaExtra (μM) | Amplitude (μM) | Frequency (Hz) | Onset (s) | Duration (s) | Potential range (mV) |
|---|---|---|---|---|---|
| 0.1 | 0.5594 | 0.0030 | 326.1 | 13.65 | −65.6∼−60.7 |
| 1 | 0.6016 | 0.0048 | 195.6 | 14.15 | −67.1∼−62.2 |
| 10 | 0.6280 | 0.0060 | 152.5 | 14.54 | −68.2∼−63.2 |
| 100 | 0.6475 | 0.0068 | 132.0 | 14.89 | −68.8∼−64.1 |
| 1500 | 0.6614 | 0.0072 | 125.0 | 15.26 | −70.0∼−64.9 |
Results
Typical properties of Ca2+ oscillations
Our model successfully reproduced Ca2+ oscillations in astrocytes. Parameter values were fixed as in Table 1 for all simulations unless otherwise noted. Fig. 3 shows the results with a time duration of 800 s, a membrane potential of −65 mV, and ECS Ca2+ concentration of 1.5 mM. In ICS, five Ca2+ oscillation episodes occurred in a train with the amplitude of 0.66 μM and the period of 139.5 s. In ER, the Ca2+ oscillations showed a much larger amplitude of 4.87 μM, but the same period. Accompanying the Ca2+ oscillations, the concentration of IP3 also oscillated with the same period. In the enlarged plot from the second period of Ca2+ oscillations (Fig. 4), the three variables showed different peak time-points, the ER Ca2+ oscillations preceded cytoplasmic Ca2+ oscillations by 5.8 s, and cytoplasmic Ca2+ oscillations were followed by IP3 oscillations with a time-lag of 12.4 s. The sequential oscillation order of ER Ca2+, cytoplasmic Ca2+, and IP3 was consistent with previous works (21–23,33).
Figure 3.
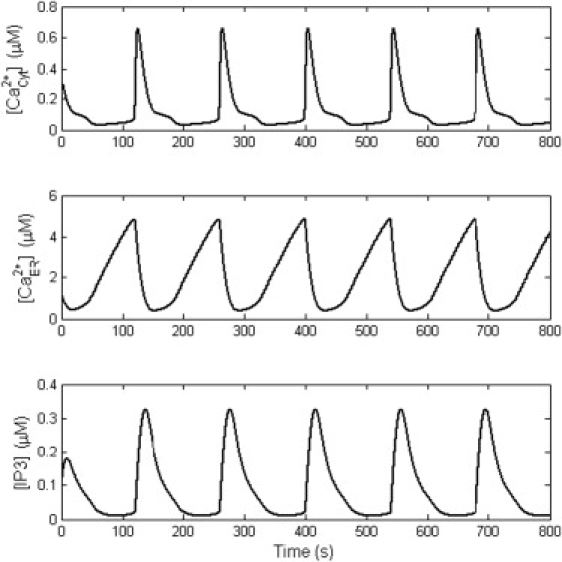
Typical spontaneous Ca2+ oscillations from the computational study. From top to bottom, the three plots correspond to oscillations in cytoplasmic Ca2+, ER Ca2+, and cytoplasmic IP3. All three variables have the same frequency but different peak times (details are shown in Fig. 4).
Figure 4.
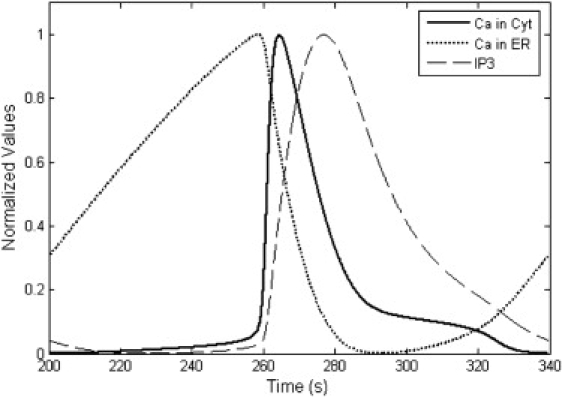
Normalized plot of the three variables in Fig. 3, during one period of Ca2+ oscillations. Their peak time points are ranked as ER Ca2+, cytoplasmic Ca2+, and cytoplasmic IP3. Before the sudden increase in cytoplasmic Ca2+, ER Ca2+ increased slowly.
Dependence of Ca2+ oscillations on membrane potential
Among the resting membrane potentials (−75 to −60 mV) (1), a narrow range of potential (−70.0 to −64.9 mV) was validated with Ca2+ oscillations at ECS Ca2+ concentration of 1.5 mM. Different manifestations of Ca2+ oscillations under different potentials were found (Fig. 5). The frequency of Ca2+ oscillations strongly depended on membrane potential. The bifurcation diagram is shown in Fig. 6 A. When the membrane potential was <−70.0 mV or >−64.9 mV, there was no Ca2+ oscillation. In the oscillatory potential range, the amplitude of Ca2+ oscillations changed slightly, but the frequency varied dramatically (Fig. 6 B). The properties of Ca2+ oscillations under different membrane potentials are summarized in Table 3. The period of Ca2+ oscillation was ∼139.5 to 528.1 s, and the frequency was ∼0.0019 to 0.0072 Hz. The amplitude of Ca2+ oscillation was ∼0.5276 to 0.6614 μM. The half-maximal duration of Ca2+ oscillations was ∼13.51 to 15.26 s.
Figure 5.
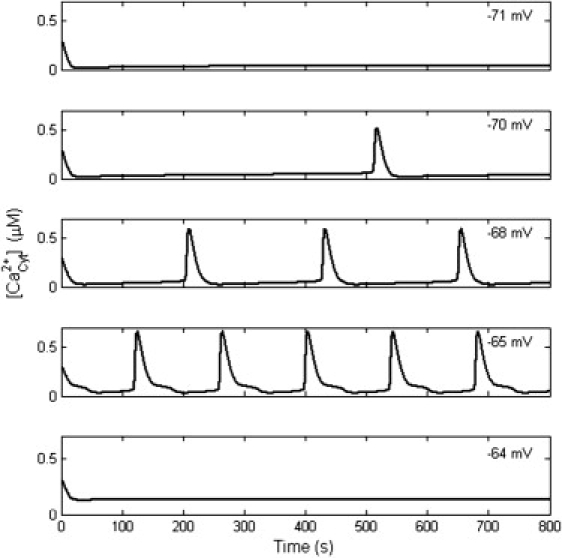
The occurrence of Ca2+ oscillation depends on the membrane potential. When the membrane potential is <−70.0 mV or >−64.9 mV, there is no Ca2+ oscillation. Within −70.0 to −64.9 mV, the frequency and amplitude of Ca2+ oscillations change with the membrane potential.
Figure 6.
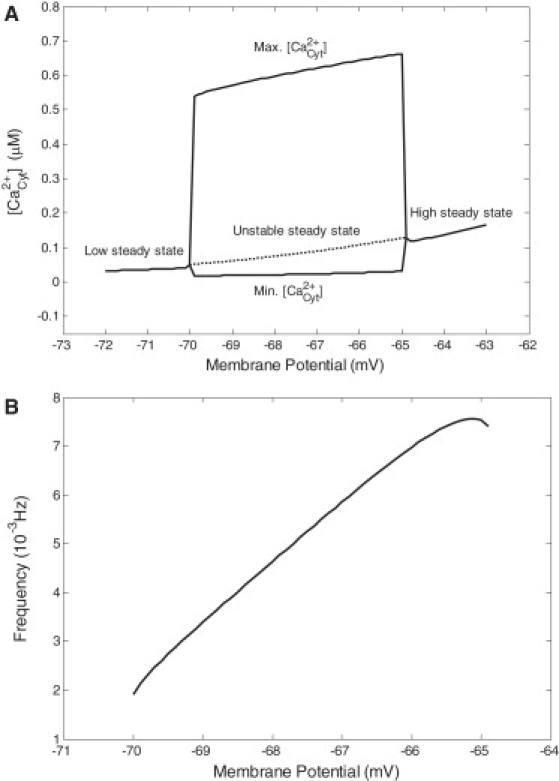
(A) Bifurcation diagram of Ca2+ oscillations as a function of membrane potential. Sustained Ca2+ oscillations occurred in the potential range of −70.0 to −64.9 mV, where the maximum and minimum of Ca2+ oscillations were plotted. The dashed line refers to the unstable steady state. Out of the oscillatory domain, the system evolved into a stable steady state. (B) Frequency of Ca2+ oscillations versus membrane potential.
Dependence of Ca2+ oscillations on extracellular Ca2+ concentration
The spontaneous Ca2+ oscillations were found to be related to extracellular Ca2+ concentration (Fig. 7). During the simulation, the membrane potential was fixed at −65 mV. When the extracellular Ca2+ concentration varied from 0.1 μM to 1.5 mM, the frequency of Ca2+ oscillations markedly increased. If the extracellular Ca2+ concentration was >3.0 mM, the Ca2+ oscillations would disappear. The parameters of Ca2+ oscillations dynamics under different extracellular Ca2+ concentrations are listed in Table 4, and the values are similar to those in Table 3. Even though the extracellular Ca2+ concentration changed by four orders of magnitude, the amplitude and duration changed only slightly, while the frequency changed more than twofold. In fact, at different extracellular Ca2+ concentrations, the range of membrane potentials over which oscillations arose changed little, except for shifting to more negative resting values (Table 4). Correspondingly, the Nernst potential values of Ca2+ were 0 mV, 29.8 mV, 59.5 mV, 89.3 mV, and 124.2 mV. The Nernst potential of Ca2+ was the primary force for Ca2+ influx. Higher ECS Ca2+ concentrations, increasing the number of Ca2+ oscillations, reinforced the influence of extracellular Ca2+ influx (16).
Figure 7.
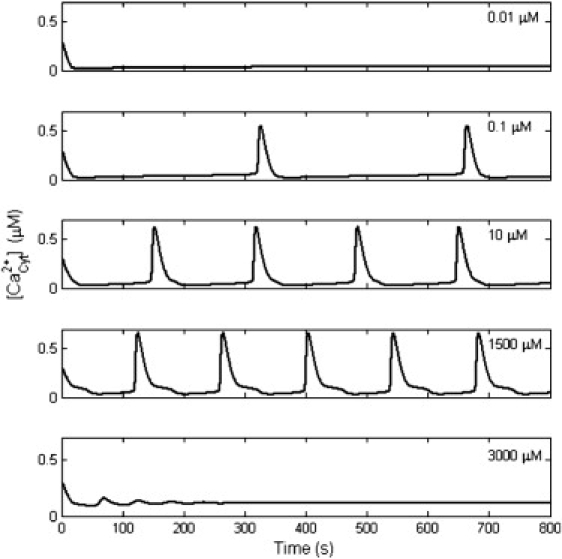
Dependence of Ca2+ oscillations on extracellular Ca2+ concentration. Ca2+ oscillations stopped when the extracellular Ca2+ concentration was too low or too high. From 0.1 to 1500 μM, the frequency of Ca2+ oscillations increased with a rise in extracellular Ca2+ concentration.
Dependence of Ca2+ oscillations on temperature
By changing the temperature of the system, the features of Ca2+ oscillations also changed. The frequency and amplitude of Ca2+ oscillations are presented in Fig. 8. At a temperature between 20 and 37°C, spontaneous Ca2+ oscillations occurred frequently and presented a slightly higher amplitude at a low temperature. Moreover, Ca2+ oscillations had a longer duration at a low temperature (11,34). This point was validated from 20 to 37°C by simulation. The duration values were 15.1 s and 13.8 s at temperature points of 20 and 37°C. The characteristics were consistent with experiments (11,34). According to the Nernst equation, it was easy to establish that the increase of temperature would reduce the membrane potential. This might explain the specific dependence of Ca2+ oscillations on temperature.
Figure 8.
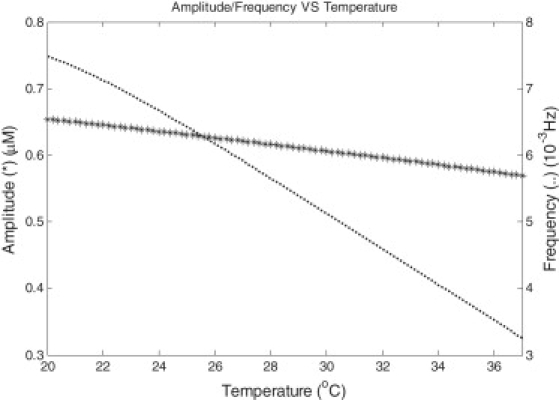
Amplitude and frequency of Ca2+ oscillations versus temperature. In the temperature range of 20–37°C, both the amplitude (indicated as an asterisk) and frequency (dotted line) decreased with temperature.
Contribution of different VGCCs to Ca2+ oscillations
In our model, it was easy to test the influence on Ca2+ oscillations due to different VGCCs. By blocking a specific VGCC, the dependence of Ca2+ oscillations on VGCCs was demonstrated (Fig. 9). T- and R-types of VGCCs showed little effect on Ca2+ oscillations. L- and N-types of VGCCs had an effective influence on Ca2+ oscillations. The blocker of L-type VGCC decreased Ca2+ oscillations to 51.4% of control, while the blocker of N-type decreased Ca2+ oscillations only to 73.6% as was found in experiments (11). The results might relate to the different contribution on Ca2+ influx from different VGCCs (Fig. 10). At −65 mV, the mean influx in one period was 0.0624 μM/s, and the L-, N-, R-, and T-types contributed 59.2%, 37.0%, 2.7%, and 1.2%, respectively.
Figure 9.
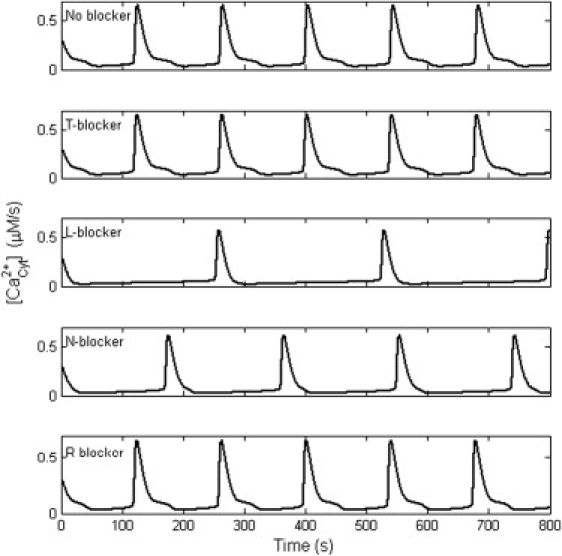
Dependence of Ca2+ oscillations on different VGCCs. T- and R-type of VGCCs showed little effect on Ca2+ oscillations. L- and N-type of VGCCs had effective influence on Ca2+ oscillations. Blocking the L-type VGCC decreased Ca2+ oscillations to 51.4% of control, while blocking the N-type decreased Ca2+ oscillations to 73.6%.
Figure 10.
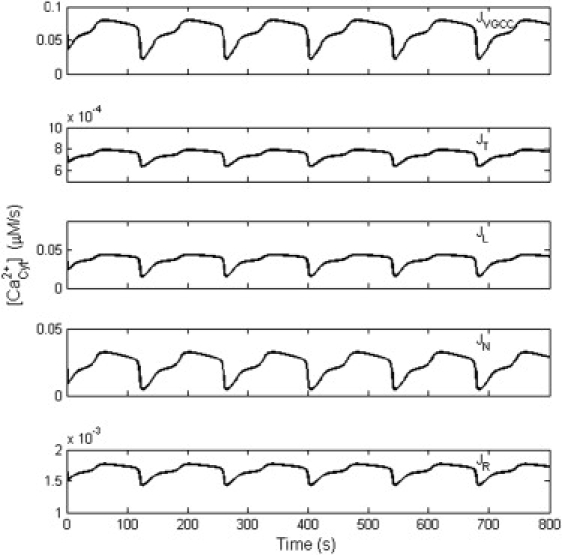
Contribution of Ca2+ entry through different VGCCs. All the results were obtained with the membrane potential of −65 mV. JVGCC was the total flux from all the VGCCs, and JT, JL, JN, and JR indicate the partial flux through the T-, L-, N-, and R-type channel, respectively.
Discussion
Oscillation of cytosol Ca2+ concentration is a ubiquitous phenomenon in a variety of cells (21,23,35). This study focused on modeling spontaneous astrocytic Ca2+ oscillation, which is one of the forms of astrocytic Ca2+ signaling defined as repetitive increases of cytosol Ca2+ concentration within a single cell (7). Independently of neuronal activity, spontaneous astrocytic Ca2+ oscillations were observed in different regions of the brain, such as cortex (14), hippocampus (36), and thalamus (11,16). Some results indicated active and direct signaling from astrocytes to neurons (11,37). Therefore, understanding the mechanisms of spontaneous astrocytic Ca2+ oscillations and signaling is highly important. This study successfully reproduced the oscillatory phenomenon in silico and obtained several new insights into channel dynamics dependence and frequency-encoded signaling.
Firstly, spontaneous Ca2+ oscillations were found to occur at a resting membrane potential (11,16,17,36). We used −75 to −60 mV as the resting potential range for astrocytes, as suggested in the previous comprehensive review (1). Our data showed that spontaneous Ca2+ oscillations occurred in the range of −70.0 to −60.7 mV (see Table 4), which might be the physiological basis for spontaneous Ca2+ oscillations. Recently, the resting potential of individual astrocytes was reported to vary dramatically from −85 to −25 mV (38). Naturally, this would only lead some subpopulations of astrocytes to oscillations (17). Indeed, there was a well-defined regime of membrane potential over which calcium oscillations took place (see the bifurcation diagram in Fig. 6 A). Around the resting potential, the T-type channel is the most reliably activated and the L-type is the least (Fig. 2). However, in this study, the steady-state conductance parameter of the L-type is much larger than that of the T-type. It was thus reasonable to find that the L-type channel contributed 59.2% of the total calcium influx for Ca2+ oscillation at −65 mV. On the other hand, the L-type channel was far from being fully activated, so that the total calcium influx was very small (26,39). There is a technical difficulty in assessing the small Ca2+ entry under the detection limit of ordinary patch systems (<1 pA/pF) (20,40).
Secondly, the dynamics of Ca2+ oscillations were found to relate to membrane potential, Ca2+ concentration in ECS, temperature, and the blocking of different VGCCs. In changing the above conditions, in our study, the frequency was ∼0.0019 to 0.0072 Hz, as compared to the reported frequency between 0.003 and 0.01 Hz (11). The period of spontaneous Ca2+ oscillation was ∼139.5 to 528.1 s, as compared to the experimental period of 98.9 to 333 s (11,14). One review suggested a common feature: spontaneous Ca2+ oscillations in astrocytes have a larger time-period (perhaps greater than 10-fold larger) than induced oscillations (41). The amplitude of Ca2+ oscillation was ∼0.5276 to 0.6614 μM, in good agreement with earlier reports (26,33). The half-maximal duration of Ca2+ oscillations was ∼13.51 to 15.26 s, which was quite similar to the observation of 15 ± 1 s in experiments (11). Generally, the amplitude and half-maximal duration changed slightly, but the frequency varied greatly. The dynamic range of the frequency in our work was ∼4 (0.0072:0.0019). The amplitude change of Ca2+ oscillation was relatively constant (<25%), which was calculated from the values shown in Table 3 ((0.6614–0.5276):0.5276). In addition, the half-maximal duration changed within 13% ((15.26–13.51):13.51). All these properties suggest that the Ca2+ oscillation is likely an all-or-none process. The great change of frequency, depending on the parameters, might be relevant to the frequency-encoded signaling in astrocytes (42,43).
Thirdly, our model provided several new insights by studying the dynamic Ca2+ influx. In the LH model (26), the Ca2+ influx from the ECS to the cytosol was considered as a constant. It was easily manipulated in modeling, but was not closely related to external experimental conditions. By incorporating VGCCs into the LH model, the experimental conditions (11,16) could be easily modeled in this study. At −65 mV, the influx through different types of VGCCs and the total influx were recorded (Fig. 10). During one period, the mean influx of Ca2+ was 0.0624 μM/s, while the maximum and the minimum were 0.0792 and 0.0221 μM/s. All the three values were out of the range of the constant influx for sustained Ca2+ oscillations in the LH model. When several mean influx values in our model were used as constant influx inputs in the LH model, the properties of Ca2+ oscillations from different models were divergent (details not shown). Generally, a delay of onset, a decrease in frequency (i.e., increase in period), and an increase of half-maximal duration and in amplitude were found in the LH model with the same mean influx. This suggests that the mean influx could not entirely account for the spontaneous Ca2+ oscillations. The properties of Ca2+ oscillations should be related to the dynamics of Ca2+ influx. This demonstrates that calcium channels dynamics cannot be disregarded when studying Ca2+ oscillations.
Fourthly, the main criticism of this study might be that we used a deterministic model. It could not reproduce Ca2+ oscillations with random spikes (44,45). As we know, some intrinsic processes during oscillation should be described as stochastic: not only is the calcium channel dynamics a random process, but so is the buffer effect of calcium influx in ICS (32,44–46). The local environmental conditions (including ions concentration, temperature, membrane potential, and pharmacological agents) of individual astrocytes should be fluctuating. In addition, VGCCs in astrocytes vary greatly in different parts of the brain, both in magnitude and type (1,29,47,48). Changing the parameters in our model could partially fill these gaps. For example, the variation of radius was found to change the spontaneous Ca2+ oscillations. If the density of calcium channels was taken to be constant, a smaller radius led to a higher frequency. At the median value of −70.0 to −60.7 mV, Ca2+ oscillations presented in the radius range from 3 to 7.5 μm. It corresponded well with the reported soma radius for astrocytes (11,14,33). Since experiments indicated that extracellular Ca2+ has a role in spontaneous Ca2+ oscillations (16,49), we tested different ECS Ca2+ concentrations within the concentration range of these experiments (Table 4). Neuronal activity might cause local depletion of calcium in the ECS: the change of Ca2+ concentration was relatively small (from 2 mM to >1 mM) and occurred in a short period of time (within 10 s) (50). We revealed that this kind of calcium depletion slightly influenced the spontaneous Ca2+ oscillation (results not shown). Interestingly, the interval distribution from random Ca2+ spikes (i.e., Ca2+ oscillations) in experiments demonstrated robust information transmission (44,45). This suggests the usefulness of the work presented here, in the study of frequency-encoded signaling in astrocytes.
In the future, more-applicable computational models need to be developed and tested. A central role of the IP3-aided CICR was addressed in this study. The activation and inhibition of the IP3 receptor showed a bell-shaped dependence described by Eq. 9 (51). However, CICR via ryanodine receptors was also suggested as a mechanism in cortical astrocytes' Ca2+ oscillations (14). Some experiments revealed that Ca2+ oscillations were independent of VGCCs (49). These studies suggested other possible mechanisms of Ca2+ oscillations, related to ligand-gated channels or store-operated calcium influx (9,40,52). The specific pathway for spontaneous astrocytes' Ca2+ oscillations needs to be clarified. In this study, ER Ca2+, cytoplasmic Ca2+ and IP3 oscillations with the same frequency but different peak time-points were found. This suggests that the detection of ER Ca2+ concentration might predict the cytoplasmic Ca2+ oscillation. Recently, genetically encoded fluorescent IP3 sensors have been used to monitor the dynamics of cytosolic IP3 during Ca2+ oscillation in HeLa cells: IP3 showed a leading edge during induced Ca2+ oscillation (53). In this work, however, IP3 oscillated with a peak lagging after cytoplasmic Ca2+ oscillation (21,22,33). Thus, experimental monitoring of IP3 oscillations might help to elucidate the IP3 pathway in spontaneous Ca2+ oscillation and determine whether the IP3 oscillation lag is a signature of spontaneous oscillation as opposed to induced oscillation. Finally, the generation of spontaneous Ca2+ oscillations in different cells might not be due to one and the same mechanism, thus the complexity of Ca2+ oscillations emphasizes the role of computational modeling (25,26). In summary, this study provides an exploratory paradigm for simulation of spontaneous Ca2+ oscillations in astrocytes.
Acknowledgments
The authors are very grateful to Prof. A. Mayevsky, T. Obrenovitch, J. Ding, and the anonymous reviewers for their valuable comments and suggestions.
This work was supported by the National High Technology Research and Development Program of China (863 Program grant No. 2006AA02Z343), the National Natural Science Foundation of China (grants No. 60828009 and No. 30800313), and the 111 Project.
Supporting Material
References
- 1.Verkhratsky A., Orkand R.K., Kettenmann H. Glial calcium: homeostasis and signaling function. Physiol. Rev. 1998;78:99–141. doi: 10.1152/physrev.1998.78.1.99. [DOI] [PubMed] [Google Scholar]
- 2.Temburni M.K., Jacob M.H. New functions for glia in the brain. Proc. Natl. Acad. Sci. USA. 2001;98:3631–3632. doi: 10.1073/pnas.081073198. [DOI] [PMC free article] [PubMed] [Google Scholar]
- 3.Anderson C.M., Nedergaard M. Astrocyte-mediated control of cerebral microcirculation. Trends Neurosci. 2003;26:340–344. doi: 10.1016/S0166-2236(03)00141-3. author reply 344–345. [DOI] [PubMed] [Google Scholar]
- 4.Takano T., Tian G.F., Peng W., Lou N., Libionka W. Astrocyte-mediated control of cerebral blood flow. Nat. Neurosci. 2006;9:260–267. doi: 10.1038/nn1623. [DOI] [PubMed] [Google Scholar]
- 5.Zonta M., Angulo M.C., Gobbo S., Rosengarten B., Hossmann K.A. Neuron-to-astrocyte signaling is central to the dynamic control of brain microcirculation. Nat. Neurosci. 2003;6:43–50. doi: 10.1038/nn980. [DOI] [PubMed] [Google Scholar]
- 6.Kanemaru K., Okubo Y., Hirose K., Iino M. Regulation of neurite growth by spontaneous Ca2+ oscillations in astrocytes. J. Neurosci. 2007;27:8957–8966. doi: 10.1523/JNEUROSCI.2276-07.2007. [DOI] [PMC free article] [PubMed] [Google Scholar]
- 7.Nedergaard M., Ransom B., Goldman S.A. New roles for astrocytes: redefining the functional architecture of the brain. Trends Neurosci. 2003;26:523–530. doi: 10.1016/j.tins.2003.08.008. [DOI] [PubMed] [Google Scholar]
- 8.Ransom B., Behar T., Nedergaard M. New roles for astrocytes (stars at last) Trends Neurosci. 2003;26:520–522. doi: 10.1016/j.tins.2003.08.006. [DOI] [PubMed] [Google Scholar]
- 9.Liu Q.S., Xu Q., Kang J., Nedergaard M. Astrocyte activation of presynaptic metabotropic glutamate receptors modulates hippocampal inhibitory synaptic transmission. Neuron Glia Biol. 2004;1:307–316. doi: 10.1017/S1740925X05000190. [DOI] [PMC free article] [PubMed] [Google Scholar]
- 10.Nadkarni S., Jung P., Levine H. Astrocytes optimize the synaptic transmission of information. PLOS Comput. Biol. 2008;4:e1000088. doi: 10.1371/journal.pcbi.1000088. [DOI] [PMC free article] [PubMed] [Google Scholar]
- 11.Parri H.R., Gould T.M., Crunelli V. Spontaneous astrocytic Ca2+ oscillations in situ drive NMDAR-mediated neuronal excitation. Nat. Neurosci. 2001;4:803–812. doi: 10.1038/90507. [DOI] [PubMed] [Google Scholar]
- 12.Kang N., Xu J., Xu Q., Nedergaard M., Kang J. Astrocytic glutamate release-induced transient depolarization and epileptiform discharges in hippocampal CA1 pyramidal neurons. J. Neurophysiol. 2005;94:4121–4130. doi: 10.1152/jn.00448.2005. [DOI] [PubMed] [Google Scholar]
- 13.Nadkarni S., Jung P. Spontaneous oscillations of dressed neurons: a new mechanism for epilepsy? Phys. Rev. Lett. 2003;91:268101. doi: 10.1103/PhysRevLett.91.268101. [DOI] [PubMed] [Google Scholar]
- 14.Tashiro A., Goldberg J., Yuste R. Calcium oscillations in neocortical astrocytes under epileptiform conditions. J. Neurobiol. 2002;50:45–55. doi: 10.1002/neu.10019. [DOI] [PubMed] [Google Scholar]
- 15.Tian G.F., Azmi H., Takano T., Xu Q., Peng W. An astrocytic basis of epilepsy. Nat. Med. 2005;11:973–981. doi: 10.1038/nm1277. [DOI] [PMC free article] [PubMed] [Google Scholar]
- 16.Parri H.R., Crunelli V. The role of Ca2+ in the generation of spontaneous astrocytic Ca2+ oscillations. Neuroscience. 2003;120:979–992. doi: 10.1016/s0306-4522(03)00379-8. [DOI] [PubMed] [Google Scholar]
- 17.Aguado F., Espinosa-Parrilla J.F., Carmona M.A., Soriano E. Neuronal activity regulates correlated network properties of spontaneous calcium transients in astrocytes in situ. J. Neurosci. 2002;22:9430–9444. doi: 10.1523/JNEUROSCI.22-21-09430.2002. [DOI] [PMC free article] [PubMed] [Google Scholar]
- 18.Tanaka M., Kawahara K., Kosugi T., Yamada T., Mioka T. Changes in the spontaneous calcium oscillations for the development of the preconditioning-induced ischemic tolerance in neuron/astrocyte co-culture. Neurochem. Res. 2007;32:988–1001. doi: 10.1007/s11064-006-9259-8. [DOI] [PubMed] [Google Scholar]
- 19.Saheki Y., Li S.T., Matsushita M., Wu Y.M., Cai W.H. A new approach to inhibiting astrocytic IP3-induced intracellular calcium increase in an astrocyte-neuron co-culture system. Brain Res. 2005;1055:196–201. doi: 10.1016/j.brainres.2005.06.056. [DOI] [PubMed] [Google Scholar]
- 20.Duffy S., MacVicar B.A. Potassium-dependent calcium influx in acutely isolated hippocampal astrocytes. Neuroscience. 1994;61:51–61. doi: 10.1016/0306-4522(94)90059-0. [DOI] [PubMed] [Google Scholar]
- 21.Goldbeter A., Dupont G., Berridge M.J. Minimal model for signal-induced Ca2+ oscillations and for their frequency encoding through protein phosphorylation. Proc. Natl. Acad. Sci. USA. 1990;87:1461–1465. doi: 10.1073/pnas.87.4.1461. [DOI] [PMC free article] [PubMed] [Google Scholar]
- 22.Young G.W.D., Keizer J. A single-pool inositol 1,4,5-trisphosphate-receptor-based model for agonist-stimulated oscillations in Ca2+ concentration. Proc. Natl. Acad. Sci. USA. 1992;89:9895–9899. doi: 10.1073/pnas.89.20.9895. [DOI] [PMC free article] [PubMed] [Google Scholar]
- 23.Dupont G., Goldbeter A. One-pool model for Ca2+ oscillations involving Ca2+ and inositol 1,4,5-trisphosphate as co-agonists for Ca2+ release. Cell Calcium. 1993;14:311–322. doi: 10.1016/0143-4160(93)90052-8. [DOI] [PubMed] [Google Scholar]
- 24.Chen X.F., Li C.X., Wang P.Y., Li M., Wang W.C. Dynamic simulation of the effect of calcium-release activated calcium channel on cytoplasmic Ca2+ oscillation. Biophys. Chem. 2008;136:87–95. doi: 10.1016/j.bpc.2008.04.010. [DOI] [PubMed] [Google Scholar]
- 25.Schuster S., Marhl M., Hofer T. Modeling of simple and complex calcium oscillations from single-cell responses to intercellular signaling. Eur. J. Biochem. FEBS. 2002;269:1333–1355. doi: 10.1046/j.0014-2956.2001.02720.x. [DOI] [PubMed] [Google Scholar]
- 26.Lavrentovich M., Hemkin S. A mathematical model of spontaneous calcium oscillations in astrocytes. J. Theor. Biol. 2008;251:553–560. doi: 10.1016/j.jtbi.2007.12.011. [DOI] [PubMed] [Google Scholar]
- 27.Rozi A., Jia Y. A theoretical study of effects of cytosolic Ca2+ oscillations on activation of glycogen phosphorylase. Biophys. Chem. 2003;106:193–202. doi: 10.1016/s0301-4622(03)00192-3. [DOI] [PubMed] [Google Scholar]
- 28.Hodgkin A.L., Huxley A.F. A quantitative description of membrane current and its application to conduction and excitation in nerve. J. Physiol. 1952;117:500–544. doi: 10.1113/jphysiol.1952.sp004764. [DOI] [PMC free article] [PubMed] [Google Scholar]
- 29.Verkhratsky A., Steinhauser C. Ion channels in glial cells. Brain Res. Brain Res. Rev. 2000;32:380–412. doi: 10.1016/s0165-0173(99)00093-4. [DOI] [PubMed] [Google Scholar]
- 30.D'Ascenzo M., Vairano M., Andreassi C., Navarra P., Azzena G.B. Electrophysiological and molecular evidence of L-(Cav1), N- (Cav2.2), and R- (Cav2.3) type Ca2+ channels in rat cortical astrocytes. Glia. 2004;45:354–363. doi: 10.1002/glia.10336. [DOI] [PubMed] [Google Scholar]
- 31.Amini B., Clark J.W., Jr., Canavier C.C. Calcium dynamics underlying pacemaker-like and burst firing oscillations in midbrain dopaminergic neurons: a computational study. J. Neurophysiol. 1999;82:2249–2261. doi: 10.1152/jn.1999.82.5.2249. [DOI] [PubMed] [Google Scholar]
- 32.Ullah G., Jung P. Modeling the statistics of elementary calcium release events. Biophys. J. 2006;90:3485–3495. doi: 10.1529/biophysj.105.073460. [DOI] [PMC free article] [PubMed] [Google Scholar]
- 33.Ullah G., Jung P., Cornell-Bell A.H. Anti-phase calcium oscillations in astrocytes via inositol (1, 4, 5)-trisphosphate regeneration. Cell Calcium. 2006;39:197–208. doi: 10.1016/j.ceca.2005.10.009. [DOI] [PubMed] [Google Scholar]
- 34.Schipke C.G., Heidemann A., Skupin A., Peters O., Falcke M. Temperature and nitric oxide control spontaneous calcium transients in astrocytes. Cell Calcium. 2008;43:285–295. doi: 10.1016/j.ceca.2007.06.002. [DOI] [PubMed] [Google Scholar]
- 35.Goldbeter A. Computational approaches to cellular rhythms. Nature. 2002;420:238–245. doi: 10.1038/nature01259. [DOI] [PubMed] [Google Scholar]
- 36.Nett W.J., Oloff S.H., McCarthy K.D. Hippocampal astrocytes in situ exhibit calcium oscillations that occur independent of neuronal activity. J. Neurophysiol. 2002;87:528–537. doi: 10.1152/jn.00268.2001. [DOI] [PubMed] [Google Scholar]
- 37.Nedergaard M. Direct signaling from astrocytes to neurons in cultures of mammalian brain cells. Science. 1994;263:1768–1771. doi: 10.1126/science.8134839. [DOI] [PubMed] [Google Scholar]
- 38.Bolton S., Greenwood K., Hamilton N., Butt A.M. Regulation of the astrocyte resting membrane potential by cyclic AMP and protein kinase A. Glia. 2006;54:316–328. doi: 10.1002/glia.20384. [DOI] [PubMed] [Google Scholar]
- 39.Hofer T., Venance L., Giaume C. Control and plasticity of intercellular calcium waves in astrocytes: a modeling approach. J. Neurosci. 2002;22:4850–4859. doi: 10.1523/JNEUROSCI.22-12-04850.2002. [DOI] [PMC free article] [PubMed] [Google Scholar]
- 40.Putney J.W., Bird G.S. Cytoplasmic calcium oscillations and store-operated calcium influx. J. Physiol. 2008;586:3055–3059. doi: 10.1113/jphysiol.2008.153221. [DOI] [PMC free article] [PubMed] [Google Scholar]
- 41.Montana V., Malarkey E.B., Verderio C., Matteoli M., Parpura V. Vesicular transmitter release from astrocytes. Glia. 2006;54:700–715. doi: 10.1002/glia.20367. [DOI] [PubMed] [Google Scholar]
- 42.Pasti L., Volterra A., Pozzan T., Carmignoto G. Intracellular calcium oscillations in astrocytes: a highly plastic, bidirectional form of communication between neurons and astrocytes in situ. J. Neurosci. 1997;17:7817–7830. doi: 10.1523/JNEUROSCI.17-20-07817.1997. [DOI] [PMC free article] [PubMed] [Google Scholar]
- 43.Pasti L., Zonta M., Pozzan T., Vicini S., Carmignoto G. Cytosolic calcium oscillations in astrocytes may regulate exocytotic release of glutamate. J. Neurosci. 2001;21:477–484. doi: 10.1523/JNEUROSCI.21-02-00477.2001. [DOI] [PMC free article] [PubMed] [Google Scholar]
- 44.Skupin A., Falcke M. Statistical properties and information content of calcium oscillations. Gen. Informat. 2007;18:44–53. [PubMed] [Google Scholar]
- 45.Skupin A., Kettenmann H., Winkler U., Wartenberg M., Sauer H. How does intracellular Ca2+ oscillate: by chance or by the clock? Biophys. J. 2008;94:2404–2411. doi: 10.1529/biophysj.107.119495. [DOI] [PMC free article] [PubMed] [Google Scholar]
- 46.Shuai J.W., Jung P. Stochastic properties of Ca2+ release of inositol 1,4,5-trisphosphate receptor clusters. Biophys. J. 2002;83:87–97. doi: 10.1016/S0006-3495(02)75151-5. [DOI] [PMC free article] [PubMed] [Google Scholar]
- 47.Sontheimer H. Voltage-dependent ion channels in glial cells. Glia. 1994;11:156–172. doi: 10.1002/glia.440110210. [DOI] [PubMed] [Google Scholar]
- 48.Sontheimer H. Astrocytes, as well as neurons, express a diversity of ion channels. Can. J. Physiol. Pharmacol. 1992;70(Suppl.):S223–S238. doi: 10.1139/y92-266. [DOI] [PubMed] [Google Scholar]
- 49.Wang T.F., Zhou C., Tang A.H., Wang S.Q., Chai Z. Cellular mechanism for spontaneous calcium oscillations in astrocytes. Acta Pharmacol. Sin. 2006;27:861–868. doi: 10.1111/j.1745-7254.2006.00397.x. [DOI] [PubMed] [Google Scholar]
- 50.Cohen J.E., Fields R.D. Extracellular calcium depletion in synaptic transmission. Neuroscientist. 2004;10:12–17. doi: 10.1177/1073858403259440. [DOI] [PMC free article] [PubMed] [Google Scholar]
- 51.Falcke M. Reading the patterns in living cells—the physics of Ca2+ signaling. Adv. Phys. 2004;53:255–440. [Google Scholar]
- 52.Liu Q.S., Xu Q., Arcuino G., Kang J., Nedergaard M. Astrocyte-mediated activation of neuronal kainate receptors. Proc. Natl. Acad. Sci. USA. 2004;101:3172–3177. doi: 10.1073/pnas.0306731101. [DOI] [PMC free article] [PubMed] [Google Scholar]
- 53.Matsu-ura T., Michikawa T., Inoue T., Miyawaki A., Yoshida M. Cytosolic inositol 1,4,5-trisphosphate dynamics during intracellular calcium oscillations in living cells. J. Cell Biol. 2006;173:755–765. doi: 10.1083/jcb.200512141. [DOI] [PMC free article] [PubMed] [Google Scholar]
Associated Data
This section collects any data citations, data availability statements, or supplementary materials included in this article.