

Abstract
Force spectroscopy allows testing the free energy landscapes of molecular interactions. Usually, the dependency of the most probable rupture force on the force rate or the shape of the rupture force histogram is fitted with different models that contain approximations and basic assumptions. We present a simple and model free approach to extract the force-dependent dissociation rates directly from the force curve data. Simulations show that the dissociation rates at any force are given directly by the ratio of the number of detected rupture events to the time this force was acting on the bond. To calculate these total times of acting forces, all force curve data points of all curves measured are taken into account, which significantly increases the amount of information which is considered for data analysis compared to other methods. Moreover, by providing force-dependent dissociation rates this method allows direct testing and validating of any energy landscape model.
When the first single molecule force measurements were done, soon a debate came up why different groups got different rupture forces for the same receptor/ligand complex. On the basis of Bells formula (1), Evans et al. described the dependency of the holding force on the loading rate by the change of the interaction potential under a constant applied force (2). Here, the pulling force adds an energy term which is given by the product of the applied force times the distance x the ligand moves in direction of the pulling force, f × x. Thus, the energy barrier of the binding potential is reduced by f × Δx, where Δx is the width of the potential, i.e., the distance between its minimum and the maximum of the energy barrier. Assuming Δx to be independent of the force as a first approximation, the dissociation rate of such a complex under force load is given by
| (1) |
Here ν0 is an attempt frequency and ΔG0 is the height of the free energy barrier at zero force. In single molecule force spectroscopy the length of the molecular system is increased continuously until rupture occurs, detecting the applied force at the time of rupture. As the dissociation of the complex is governed by thermal fluctuations; neither the individual nor the average measured rupture forces are a characteristic parameter of the interaction. Pulling slowly leaves enough time for the system to dissociate at low forces whereas fast pulling increases the applied force to high values before the system had enough time to dissociate. The dependency of the most probable rupture force F on the force rate F∗ by which the force is increased with time is described as (3)
| (2) |
Thus, linear fitting the most probable rupture force versus the logarithm of the force rate reveals the dissociation rate at zero force k0 and the width of the binding potential Δx. Formula 2 assumes that the applied force increases linear with time when pulling with a constant speed. However, this is not valid for anharmonic linkers which are used in single molecule force measurements.
Recently, attempts have been described which take the chain elasticity into account to derive a modified Bell-Evans formula (4,5). There, the elasticity of the polymer linker was taken into account describing them via the wormlike chain and the freely jointed chain models.
A more direct way to measure the force-dependent dissociation rates and to determine the potential width is known as the force-clamp technique. There, the force applied to the molecular system is held at a constant level while measuring the characteristic survival time of the bond. At a given constant force and the force-dependent rate kdiss the measured bond survival times follow an exponential decay. The probability to find the rupture after the time ti is given by
| (3) |
In this kind of constant force experiments i = 1…N marks the ith measurement of the bond survival time.
The right side of Eq. 3 regarded as a function of kdiss for a given ti is the likelihood function L(kdiss|ti). The most likely rate in this case is given by kdiss = 1/ti. The probability to find the N survival times {t1…tN} is given by the product
| (4) |
Here tav = Σti/N is the average measured survival time and N is the number of measured dissociation events at a given constant force f. The value P(tav|kdiss)N again has its maximum likelihood at kdiss = 1/tav. Thus, instead of fitting the obtained survival times by a monoexponential decay, the most likely dissociation rate kdiss may be calculated directly from the average survival time kdiss = N/Σti.
In fact, this can directly be calculated also from force spectroscopy data. When pulling on a molecular bond, each time window Δt having one data point of the pulling force curve may be regarded as an individual force-clamp experiment. As Δt is short compared to the bond survival time, the probability that the bond ruptures within this time window whereas the force f acts on the bond, is given by kdiss(f) × Δt. Each time window in which a force f is applied to the bond under investigation may be regarded as an individual Poisson experiment which may result in either a rupture or no rupture. Since these Poisson experiments are completely independent of each other all data points that were taken at the same force may be merged and described as one Poisson experiment. Thus, the dissociation rate kdiss(f) can be calculated as
| (5) |
Here, M(f) is the number of data points taken at the force f and N(f) is the number of ruptures observed at this force. The product M(f) × Δt represents the total time of the force f acting on the bond. A similar result was obtained by Dudko et al. (6, Eq. 2). However, in contrast to the approach of Dudko et al., our method extracts the force-dependent off rates directly from the measured data and thus also includes the force noise.
To obtain the force-dependent dissociation rates all fluctuations of the applied force have to be taken into account, since the dissociation rates increase exponentially with the applied force. Therefore, it is important to calculate the forces which are truly acting on the molecular bond.
The fluctuations of the cantilever are driven by thermal noise of the whole system and do not reflect active pulling of the stretched polymer spacers due to its own length fluctuations. Assuming the polymer fluctuates much faster than the cantilevers resonance frequency, it may be regarded as being in the equilibrium state all the time and adapting its own length to the varying tip-surface distance, which fluctuates due to the Brownian motion of the cantilever. This prerequisite can be fulfilled by using short polymer spacers and by the fact that the stretched polymer is strongly restricted in its conformational space and slow diffusional components are reduced.
In the force curve displayed in Fig. 1 a, the bending of the cantilever toward the surface, as induced by pulling forces, is displayed as positive values. A bending toward the surface due to thermal fluctuations shows up in the force curve in the same way as a positive pulling force but, in fact, the length of the polymer shortens in accordance with the reduced tip-surface distance. Thus, the stretching force acting on the polymer, which depends only on the polymers end-to-end distance, is reduced. Consequently, the actual force acting on the bond is given by the average force at the actual tip surface distance, i.e., by the vertical projection of each data point in the force curve onto a fit which describes the force derived from the average cantilever deflection (Fig. 1 b). Hence, to obtain the truly acting forces no model describing the polymer is explicitly required. Any curve that describes the average force can be used.
Figure 1.
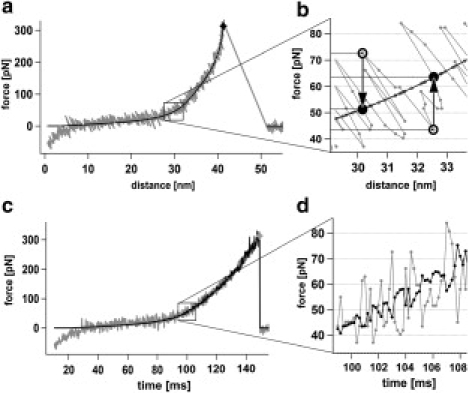
(a) Typical force curve of PEG (gray) fitted with the freely jointed chain plus two states model given in Oesterhelt et al. (7) (black). (b) Calculation of forces truly acting on the bond (black) from the cantilever fluctuations (gray). (c) The same force curve displayed versus time. The black curve shows the increasing noise in the truly acting forces. (d) Thermal fluctuation of the cantilever (gray) toward higher pulling forces corresponds with a reduced tip surface distance and thus a lower truly acting force (black).
Fig. 1, c and d, show the same force curve displayed as force versus time (gray). The black curve shows the truly acting force calculated for each data point. The thermal noise visible in a force curve is high at low forces and decreases with increasing forces due to the stiffening of the stretched polymer. In contrast, the noise of the truly acting force is minimum at low forces increasing significantly with the applied force. This corroborates the importance of taking the true force fluctuations into account.
Thus, taking all data points from all measured force curves into account the force-dependent dissociation rates may directly be obtained from the rupture force distribution histogram and the histogram of durations of acting forces.
To test the method we applied it to simulated force spectroscopy data, which includes poly(ethylene glycol) (PEG) linkers, thermal noise, and a triangular binding potential, which fulfills the conditions of Bell's formula with a constant potential width Δx = 0.3 nm and a force-dependent binding energy ΔG(f) = ΔG0 − F × Δx with ΔG0 = 16 kBT.
To generate the force curves we calculated, the forces according to the PEG fit model from Oesterhelt et al. (7), the cantilever deflection signal- and the force-dependent spring constant (slope) of the PEG polymer kpol using the following parameters: data rate = 33 kHz, pulling speed = 100 nm/s, and contour length = 100 nm. Interestingly, the proposed method is independent of the experimental pulling speed, as long as the interaction is in the quasi-adiabatic state. With the spring constant of the cantilever kcant = 20 pN/nm the spring constant of the combined system ksys = kpol + kcant was obtained and used to determine the root mean-square width x = sqrt(kBT/ksys) for a Gaussian-distributed thermal noise, which then was added to the cantilever deflection. To simulate the rupture forces, we then applied the method described above to derive the truly acting forces from the simulated deflection data. Based on these forces a Monte Carlo approach was used to simulate the rupture point in each force curve based on the force-dependent off rate (Eq. 1) and an attempt frequency ν0 = 106 s−1.
We now applied the proposed analysis procedure to the simulated data. By dividing the number of rupture events counted at each force (Fig. 2 a) with the total time each force was applied for (Fig. 2 b) the force-dependent dissociation rates (Fig. 2 c) were calculated. Only small deviations are observed between the analyzed values (gray histograms) and the simulated data (black cityscape); the deviations result from the force detection limit (below 5 pN) or the fact that the force analysis procedure can detect only average rupture forces whereas the ruptures occur with higher probability at high force peaks (above 90 pN).
Figure 2.
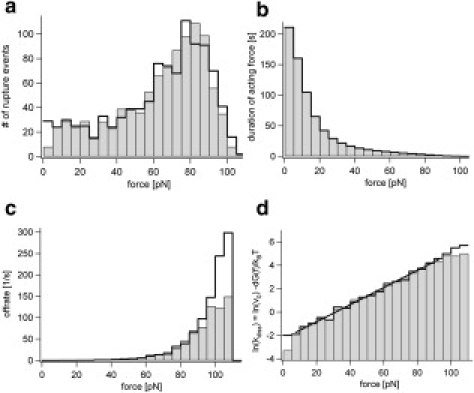
(a) Force histogram of ruptures of the simulated and analyzed data shown as black cityscape and gray histogram, respectively. (b) Total times of acting forces. (c) Calculated dissociation rates. (d) Logarithm of the dissociation rate which is a direct measure of force-dependent dissociation free energy ln(kdiss(f)) = ln(ν0) − ΔG(f)/kBT with a linear fit to the analyzed values.
Interestingly, the force histogram (Fig. 2 a) is much broader than would be expected from a single force rate and reaches even as low as zero rupture forces. This reflects the different rates acting in the strongly nonharmonic PEG force curve (Fig. 1). However, the logarithm of the dissociation rates (Fig. 2 d, line) can be fitted by a straight line. The resulting fit parameters k0 = 0.121 ± 0.01 s−1 and Δx = 0.301 ± 0.006 nm agree well with the parameters used in the simulation k0 = 0.113 s−1 and Δx = 0.3 nm.
In conclusion, we want to point out that the approach presented here for deriving the force-dependent dissociation rates is completely model free. Thus, the shape of the force-dependent dissociation free energy (Fig. 2 d) calculated from the dissociation rates may directly be used for testing different energy landscape models.
Acknowledgments
L.O. is a fellow of the North-Rhine-Westphalia Research School BioStruct. This work was supported by grants from the Ministry of Innovation, Science, Research and Technology of the German Federal State North-Rhine-Westphalia, from the Entrepreneur Foundation at the Heinrich-Heine-University of Düsseldorf, and by the BMBF nanotechnology competition, project No. 03N8714.
References and Footnotes
- 1.Bell G.I. Models for the specific adhesion of cells to cells. Science. 1978;200:618–627. doi: 10.1126/science.347575. [DOI] [PubMed] [Google Scholar]
- 2.Evans E., Ritchie K. Dynamic strength of molecular adhesion bonds. Biophys. J. 1997;72:1541–1555. doi: 10.1016/S0006-3495(97)78802-7. [DOI] [PMC free article] [PubMed] [Google Scholar]
- 3.Izrailev S., Stepaniants S., Balsera M., Oono Y., Schulten K. Molecular dynamics study of unbinding of the Avidin-Biotin complex. Biophys. J. 1997;72:1568–1581. doi: 10.1016/S0006-3495(97)78804-0. [DOI] [PMC free article] [PubMed] [Google Scholar]
- 4.Ray C., Brown J.R., Akhremitchev B.B. Correction of systematic errors in single-molecule force spectroscopy with polymeric tethers by atomic force microscopy. J. Phys. Chem. B. 2007;111:1963–1974. doi: 10.1021/jp065530h. [DOI] [PubMed] [Google Scholar]
- 5.Evans E., Ritchie K. Strength of a weak bond connecting flexible polymer chains. Biophys. J. 1999;76:2439–2447. doi: 10.1016/S0006-3495(99)77399-6. [DOI] [PMC free article] [PubMed] [Google Scholar]
- 6.Dudko O.K., Hummer G., Szabo A. Theory, analysis, and interpretation of single-molecule force spectroscopy experiments. Proc. Natl. Acad. Sci. USA. 2008;105:15755–15760. doi: 10.1073/pnas.0806085105. [DOI] [PMC free article] [PubMed] [Google Scholar]
- 7.Oesterhelt F., Rief M., Gaub H.E. Single molecule force spectroscopy by AFM indicates helical structure of poly(ethylene-glycol) in water. New J. Phys. 1999;1:6.1–6.11. [Google Scholar]