

Abstract
Cell membrane organization is dynamic and is assumed to have different characteristic length scales. These length scales, which are influenced by lipid and protein composition as well as by the cytoskeleton, can range from below the optical resolution limit (as with rafts or microdomains) to far above the resolution limit (as with capping phenomena or the formation of lipid “platforms”). The measurement of these membrane features poses a significant problem because membrane dynamics are on the millisecond timescale and are thus beyond the time resolution of conventional imaging approaches. Fluorescence correlation spectroscopy (FCS), a widely used spectroscopic technique to measure membrane dynamics, has the required time resolution but lacks imaging capabilities. A promising solution is the recently introduced method known as imaging total internal reflection (ITIR)-FCS, which can probe diffusion phenomena in lipid membranes with good temporal and spatial resolution. In this work, we extend ITIR-FCS to perform ITIR fluorescence cross-correlation spectroscopy (ITIR-FCCS) between pixel areas of arbitrary shape and derive a generalized expression that is applicable to active transport and diffusion. ITIR-FCCS is applied to model systems exhibiting diffusion, active transport, or a combination of the two. To demonstrate its applicability to live cells, we observe the diffusion of a marker, the sphingolipid-binding domain (SBD) derived from the amyloid peptide Aβ, on live neuroblastoma cells. We investigate the organization and dynamics of SBD-bound lipid microdomains under the conditions of cholesterol removal and cytoskeleton disruption.
Introduction
Over the last decade, it has become clear that the plasma membrane of cells, far from being uniform, is highly organized yet dynamic, consisting of a multitude of interacting subdomains within the lipid membrane. The length scales of these associations on the membrane span a wide range of magnitudes ranging from small, nanometer-sized cholesterol-rich rafts to large, micron-sized ceramide-rich platforms (1–3). These highly heterogeneous structures exhibit dynamics on the millisecond timescale (4). Hence, the dynamic organization of the cell membrane can be understood only by the application of techniques that incorporate spatial as well as temporal measurements of diffusion, and thus provide a picture of how the membrane works as a system on a larger scale.
Fluorescence correlation spectroscopy (FCS) was developed as a technique to measure the diffusion coefficients of molecules, to understand flow processes, and to analyze the kinetics of reacting chemical systems (5–9). It was quickly realized that FCS could be applied in living cells to measure the diffusion behavior of membrane-associated molecules at the cell surface, and to gain information about segregation of these molecules into liquid-ordered and -disordered states, since they have different characteristic diffusion behaviors (10). Originally conceived as a temporal correlation technique, FCS was modified to perform correlation in the spatial domain under the name of image correlation spectroscopy (ICS) (11) (for review, see Kolin and Wiseman (12)). ICS is useful for estimating the number and size of aggregates, which can also be determined by number and brightness (N&B) analysis (13). Recently, N&B analysis was extended to observe variations in number and brightness as a function of time by means of an electron multiplying charge-coupled device (EMCCD) camera (14). N&B analysis depends on the amplitude fluctuations, whereas ICS relies on the spatial correlation of the fluorescence fluctuations. For example, ICS can be used to study the spatial distribution of receptors on the membrane, but it cannot determine the dynamics of a system, since only spatial correlations are performed.
The introduction of image cross-correlation spectroscopy (ICCS) extended ICS to include temporal correlations (15), and thus allowed the measurement of dynamic behaviors of molecules on the cell surface (16–18). ICCS then underwent a series of further modifications, the first of which was to include vectorial information with the introduction of spatiotemporal ICS (STICS) (19). STICS has been used to measure protein diffusion and protein flow in living cells, but is sensitive to the photophysics of the labeled molecules, such as bleaching. The introduction of k-space ICS (kICS) overcame this problem, as it is not sensitive to bleaching and blinking artifacts (20). The main obstacle of the aforementioned ICS methods is that they are limited by the imaging rate of the microscope. As an alternative, raster ICS (RICS) was developed to take advantage of the pixel/time structure within a raster scanning image, as obtained from confocal microscopy, to compute temporal correlations (21). Although RICS currently offers better temporal resolution than EMCCD-based FCS, it is not isotropic and is limited along a scanning line by the laser beam dwell time per pixel, and between lines by the time it takes for the microscope to scan a whole line. In addition, the technique used to correlate the images depends on the diffusion coefficient or velocity being measured, since each technique has its own characteristic time resolution.
Apart from image-based methods like STICS, temporal FCS methods such as two-beam cross-correlation spectroscopy (CCS) (22) and spatial two-photon CCS (23) have been used to characterize flow processes. Flow velocity and flow directions have been determined in vivo and demonstrated in zebrafish blood vessels (24–26). Recently, spatial CCS was carried out with the use of a spatial light modulator (27).
FCS systems generally use point detectors (e.g., avalanche photodiodes or photomultiplier tubes) as detectors. Multiplexed FCS experiments have been performed using 2 × 2 complementary metal oxide semiconductor array-based detection (28). However, in many cases, investigators need to perform FCS experiments on a large area to get an idea of the membrane dynamics. EMCCD camera-based FCS provides the necessary multiplexing advantage. EMCCD-based FCS was first demonstrated in a confocal mode. In this case, the EMCCD is mounted in an image plane of the microscope and the pinholes are defined by a cluster of pixels of the EMCCD for each laser beam (29,30). Therefore, this method theoretically could be used for up to ∼300 confocal volumes. Sisan et al. (31) extended the method by using a spinning disk microscope to obtain the first FCS images in which each pixel in the image was correlated. This method, however, requires the nontrivial synchronization of the spinning disk with the acquisition for FCS data if molecular processes are to be observed with high temporal resolution. In previous studies, the Wiseman group showed that spatiotemporal image correlation can be achieved in either a confocal mode (19) or a TIR mode using an EMCCD (20). However, the time resolution used in the TIR mode was only 50 ms, which is not sufficient to obtain a temporal correlation function on each pixel. In earlier work, we used imaging total internal reflection (ITIR)-FCS) to study two-dimensional surfaces with a time resolution of 4 ms, which allowed the resolution of lipid and protein dynamics at each pixel of an EMCCD camera (32,33). Here, we used the same instrumental setup to carry out spatiotemporal cross correlations using ITIR fluorescence cross-correlation spectroscopy (ITIR-FCCS). We applied this method to study diffusion and transport processes, and resolve the dynamic heterogeneity in membranes that cannot be addressed easily by other spectroscopic methods.
Several of the above-mentioned techniques have a high temporal resolution but are limited to measurements of a single spot or, at most, a few spots. Alternatively, one could use a variety of image-based spatial correlation techniques, but such methods have poor or anisotropic temporal resolution. ITIR-FCCS bridges these regimes by providing good isotropic spatial and temporal resolution simultaneously. In ITIR-FCCS, the spatial resolution is diffraction-limited, as in other FCS techniques, and the temporal resolution is limited by the frame rate of the imaging device.
In this work, we derive a generalized expression for cross correlation between any two areas of any size and shape on a CCD chip and use the same expression to extract diffusion coefficient and velocity parameters for three different types of transport (diffusion, flow, and diffusion and flow). It was previously suggested that differences in the forward and backward correlations (here termed ΔCCF) can be used to characterize nonequilibrium systems or anisotropic translocation (22,34,35). By using ΔCCF values for neighboring pixels, we investigate anisotropic transport in cell membranes, and relate these differences to the membrane organization of living cells. In particular, we demonstrate that the organization of the liquid-ordered phase (tracked by sphingolipid-binding domain (SBD)), but to a much lesser extent the liquid-disordered phase (represented by DiI, Dialkylindocarbocyanine- C18), is disturbed by cholesterol removal by methyl-β-cyclodextrin (MβCD), and by the disruption of the cytoskeleton by latrunculin A.
Materials and Methods
Detailed descriptions of the instrumentation, theory, newly derived fitting models and their parameters, and data evaluation are given in the Supporting Material.
Results and Discussion
The system and newly derived fitting models for ITIR-FCCS were tested using supported lipid bilayers (SLB) and samples with quantum dots fixed to a coverslide. By moving these samples with an automated microscope stage, we were able to create situations for diffusion, active transport, and a combination of the two.
Overall quality of fitting
The overall quality of fits obtained with the derived fitting models, with four to six parameters, is very good, as shown in Figs. 1 and 2. However, there are two exceptions. The fitted autocorrelation function (ACF) for data from samples that exhibit only flow show deviations from the data (Fig. S5, B and C). There are several reasons for these deviations. First, the data in these cases contain higher harmonics, as evidenced by the regular peaks in the tail of the ACF. We attribute this to the stepping motor of the automated microscope stage, which does not move over the full distance in one linear movement. This is supported by the intensity traces for these measurements and their Fourier transforms and ACFs (Fig. S4 and Fig. S5). Second, since these measurements were conducted on air-dried samples of quantum dots and part of the ACF, they may be related to the photophysical properties of the quantum dots (particularly if obtained on short timescales), which can exhibit blinking behavior on a timescale similar to that of the measurement (i.e., milliseconds) (36). It should be noted that this problem is reduced in the cross-correlations calculated between pixels, where fitting is strongly influenced by the main peak position.
Figure 1.
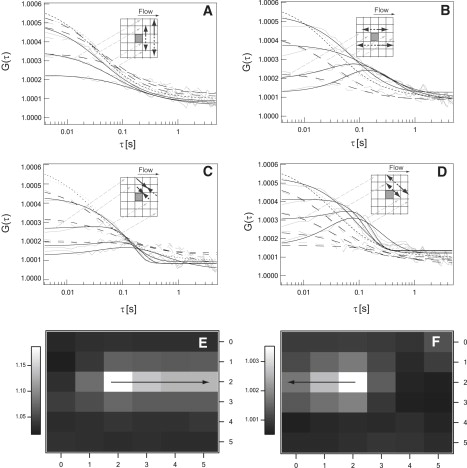
CCFs of 3 × 3 binned regions for a labeled supported lipid bilayer that was moved horizontally by 10 μm/s with the mechanical stage and thus exhibits diffusion and horizontal flow. Graphs A–D show forward (black solid line) and backward (black dashed line) CCFs that are fitted to the data (gray lines). (A) CCF along the vertical direction. (B) CCF along the horizontal direction. (C) CCF along the trailing diagonal. (D) CCF along the leading diagonal. The different solid and dashed black lines are fits to the correlations of the center pixel with different pixels of increasing distances along the indicated directions. The maps in E and F show the values of the maxima of the CCF between the center pixel and the surrounding pixels for flow only. Map E represents the values for flow along the horizontal +x direction. Map F represents the values for flow along the horizontal −x direction.
Figure 2.
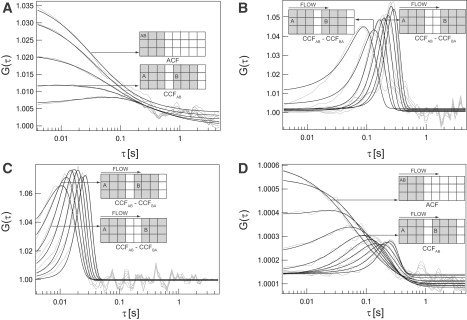
ACFs and CCFs measured for the different systems exhibiting diffusion, flow, or a combination of the two. The black lines are fits to the data (gray lines). The insets are examples explaining the size and displacement of the two areas in the particular correlation functions. All correlations were performed on 3 × 3 binned regions. (A) ACF and CCF along the horizontal direction of lipid diffusing on a supported lipid bilayer (diffusion). (B) Backward correlation subtracted CCF (CCFAB − CCFBA) along the horizontal direction of nonoverlapping regions of immobilized quantum dots moved with a velocity of 10 μm/s (slow flow along the horizontal direction). (C) Backward correlation subtracted CCF (CCFAB − CCFBA) along the horizontal direction of nonoverlapping regions of immobilized quantum dots moved with a velocity of 100 μm/s (fast flow along the horizontal direction). (D) ACF and CCF along the horizontal direction for lipid diffusing on a supported lipid bilayer moved with a velocity of 10 μm/s (diffusion and flow along the horizontal direction).
The point spread function (PSF) of the microscope was approximated by a Gaussian function with the standard deviation (SD, σ) (37–40). The following parameters are retrieved from the fits: diffusion coefficient (D), velocity of flow (v), convergence value of correlation function at longer lag times (G∞), and SD (σ). In the sections below, all of the parameters except σ are discussed. A detailed discussion of σ is provided in Sections 6–8 of the Supporting Material. All fitting parameters and their SDs, which give an estimation of the uncertainties of the method, are given in Table 1.
Table 1.
Diffusion coefficient, velocity, G∞ and σ0 obtained from diffusion, slow flow (v = 10 μm/s), fast flow (v = 100 μm/s), and diffusion and flow (v = 10 μm/s)
| Parameter | Correlation | Fit | Diffusion | Slow flow | Fast flow | Diffusion and flow |
|---|---|---|---|---|---|---|
| D [μm2/s] | ACF | Individual | 6.8 ± 1.5 | – | – | 3.6 ± 1.8 |
| Global | 2.9 ± 4.2 | – | – | 3.9 ± 4.5 | ||
| CCF | Individual | 8.8 ± 5.62.6 ± 0.1∗ | – | – | 1.7 ± 0.81.6 ± 0.9∗ | |
| Global | 4.6 ± 0.2† | – | – | 1.4 ± 0.2∗† | ||
| v [μm/s] | ACF | Individual | – | 9.6 ± 0.8 | 89 ± 10 | 3.4 ± 3.3 |
| Global | – | 10 ± 14† | 97 ± 170† | 9 ± 4.8† | ||
| CCF | Individual | – | 8.9 ± 1.28.9 ± 0.3∗ | 92 ± 7.794 ± 6.9∗ | 7.3 ± 2.28.4 ± 1.5∗ | |
| Global | – | 9 ± 0.05∗† | 96 ± 0.5∗† | 8.9 ± 0.15∗† | ||
| G∞ | ACF | Individual | 1.022 ± 0.001 | 1.0017 ± 0.0003 | 1.015 ± 0.009 | 1.0001 ± 0 |
| Global | 1.002 ± 0.001† | 1.002 ± 0.0005† | 1.017 ± 0.0007† | 1.0001 ± 0.00003† | ||
| CCF | Individual | 1.001 ± 0.0031.0005 ± 0.0003∗ | 1.001 ± 0.00061.001 ± 0.0006∗ | 1.001 ± 0.0050.9998 ± 0.0002∗ | 1.0001± 01.0001± 0∗ | |
| Global | 1.002 ± 0.001† | 1.001 ± 0.001∗† | 0.9998 ± 0.0003∗† | 1.0001 ± 0.00001∗† | ||
| σ0 | ACF | Individual | 1.00 ± 0.20 | 1.00 ± 0.03 | 1.27 ± 0.18 | 0.70 ± 0.30 |
| Global | 0.20 ± 0.04† | 0.97 ± 1.90† | 1.05 ± 2.50† | 0.88 ± 0.73† | ||
| CCF | Individual | 1.56 ± 0.700.89 ± 0.01∗ | 0.64 ± 0.340.74 ± 0.20∗ | 1.05 ± 0.260.96 ± 0.12∗ | 0.85 ± 0.481.06 ± 0.39∗ | |
| Global | 0.61 ± 0.03† | 0.78 ± 0.02∗† | 0.97 ± 0.02∗† | 1.13 ± 0.05∗† |
Values excluding CCFs of overlapping areas.
Mean ± SD, where the SD is the deviation associated with the global fitting of the data. In all other cases, the SD refers to the deviation from the mean of various trials.
Diffusion coefficient
The values for the diffusion coefficient obtained on SLBs by our measurements are given in Table 1. In general, they are in agreement with values reported in literature. Using z-scan FCS or two-focus (2f) FCS, both of which are calibration-free methods, a diffusion coefficient of 2–5 μm2/s was obtained (32,41–43). Values of diffusion coefficient retrieved by the global fit of ACF are close to the reported value. However, the quality and accuracy of the fit depended on the data evaluation. The most precise values were retrieved by the cross-correlation functions (CCFs) of nonoverlapping areas (2.6 ± 0.1 μm2/s). In contrast, the CCFs of overlapping areas show a large error. This can be attributed to the cross talk between the areas when they overlap. Since we performed the cross correlation with 3 × 3 binning, areas had to be shifted by at least 3 pixels to avoid overlap.
In the case of diffusion and flow, the diffusion coefficients retrieved via both ACFs and CCFs show somewhat lower values than when only diffusion is present, although the values fall into the expected range. This is very likely a problem of distinguishing flow and diffusion by a fit, and depends on which of the two processes dominates. This can be influenced by the length scale of observation, i.e., the size of the correlated area in an ACF. It can also be influenced by the separation between the two cross-correlated areas because of the different time dependence of the displacement of diffusion and flow, as will be discussed further below. The advent of faster cameras and better time resolution may provide a partial solution to this problem (Fig. S7).
It should be noted that the diffusion coefficient as well as the size of the PSF are extracted from the fit directly, and a separate calibration is not needed for ITIR-FCCS. This is an additional advantage compared to single spot FCS measurements, since the measured diffusion coefficients and flow velocities are not dependent on accurate knowledge of the diffusion coefficient of a standard dye.
Velocity (v)
The retrieved speeds obtained from autocorrelation and cross-correlation analyses are close to the expected values of 10 and 100 μm/s for cases of slow and fast flow, respectively, in both the individual and global fits (Table 1). In the case of cross correlation, the error associated with the retrieved velocities is smallest when only CCFs of nonoverlapping regions are considered, for reasons discussed above. In the case of diffusion and flow, the retrieved value for the velocity is not as accurate as the value retrieved for the flow-only case. Again, the most accurate values for the velocity are obtained only when nonoverlapping regions are considered for the CCFs.
G∞
In all cases discussed above, the value of G∞ is close to its theoretical value of one (Table 1). Upon closer examination, it can be seen that there is a bias for values slightly greater than one. This bias can be attributed to the limited number of recorded stacks: 10,000 stacks may not be sufficient to accurately calculate the correlations at long lag times at which convergence is expected. However, this effect is small, and the deviation from one is in the worst case only 2.2% and in general on the order of 0.1%. This bias is not caused by bleaching, a typical cause of deviation of G∞ from one, since the intensity traces observed in our measurements do not show bleaching (Fig. S4).
Comparison of CCF and ACF
In general, diffusion coefficients extracted from CCFs show more precise values compared to values extracted from ACFs. This is underlined by the fact that CCFs become more precise, i.e., have smaller errors, if the two areas for the CCF do not overlap and thus contain minimal autocorrelations. However, both methods provide diffusion coefficients in the expected range. The same holds true for measurements of systems that contain only flow: in general, the CCFs yield better values. When the cross-correlation between two different regions with an overlap is broken down into its constituent auto- and cross-correlations for flow, the values retrieved from CCFs are more accurate than those retrieved from ACFs (Fig. S3 and Table S1). For the case of diffusion and flow, the differences become larger. Although autocorrelation analysis can be used to determine the flow and diffusion parameters, the direction of flow cannot be determined by autocorrelation analysis. Cross-correlations must be performed to determine the direction of flow (Fig. 1, E and F). Hence, it is necessary to resort to cross-correlation analysis to retrieve flow parameters. The discrepancy between ACF and CCF analysis can best be seen in the case of diffusion and flow. The value of speed retrieved by the autocorrelation analysis is only 35% of the expected value. The error associated with velocity in the case of cross-correlation analysis is <20%, whereas the error associated with autocorrelation analysis can reach 100%. Hence, the cross-correlation analysis is the preferred method in the presence of both diffusion and flow.
Comparison of global fit and individual fit
The values returned by the global fit are close to the values returned by the individual fit. The global fit retrieves better values than the individual fit in two cases. The values retrieved by the global fit are closer to the reported value than the individual fit in the case of autocorrelation of diffusion data. In the case of autocorrelation of diffusion and flow, the value of velocity retrieved by a global fitting of autocorrelation data is very close to the expected value of 10 μm/s, whereas the individual fitting of autocorrelation does not retrieve the expected value.
Optimal parameters to compute and fit correlation data
To carry out a cross-correlation with 3 × 3 pixel areas and retrieve accurate diffusion and velocity parameters, the following distances are recommended: For all cases, the CCF should be measured between areas that are ≥3 pixels apart (i.e., for areas without overlap), to avoid pseudo-autocorrelations. In the case of diffusion, the cross-correlation is best performed between areas that are 3–4 pixels apart, since for increasing distance, the amplitude decreases in the case of diffusion, which in turn affects the quality of the fits. In the case of flow, the cross-correlation has to be carried out between areas that are >3 pixels apart. In this case, the distance does not have a very strong influence on the amplitude, particularly when the CCF is calculated along the flow direction. In the case of diffusion and flow, the cross correlation has to be carried out between areas that are 3–7 pixels apart. For areas with a larger pixel distance, the amplitude due to the diffusion term drops and is difficult to distinguish from the flow term.
Concerning the influence of the PSF (i.e., the parameter σ in our case), the following method is recommended to carry out the fitting of the autocorrelation data: In the case of diffusion, for 1 × 1 and 2 × 2 binning, the size of the pixels is comparable to the resolution limit. Therefore, σ must be used as a fitting parameter. However, in 3 × 3 binning, which in our case corresponds to the binned area being larger than the PSF, the effect of the PSF becomes negligible and an approximate function neglecting σ gives acceptable fits (32) (Table S3 and Fig. S11). In the case of cross-correlation, for any binning, σ can be used as a fitting parameter because it converges to a fixed value irrespective of the binning, as shown above. In the case of systems subjected to flow, as described above, the particle moves a finite distance from the initial point. This movement causes a blurring in the image, and hence for systems subjected to flow, the auto- and cross-correlations must be computed with σ as a fitting parameter irrespective of the binning. As an extension to the above, for systems undergoing diffusion and flow, σ must be used as a fitting parameter irrespective of the binning.
Anisotropic translocation
In the case of systems exhibiting isotropic diffusion, the forward and backward correlations are identical because particles are free to diffuse randomly and follow no particular direction. In such a case, when the forward correlation is subtracted from the backward correlation, a flat profile is obtained. Instead, when the translocation is direction-dependent (e.g., as in anisotropic diffusion, flow, and active transport), the subtracted correlation profiles are not flat. Hence, in principle this approach can be used to map membrane dynamics. To test this idea, we performed several measurements. We found that on flattened giant unilamellar vesicles, the most prominent boundary is the boundary of the vesicle and the solution phase, and the ΔCCF images clearly show these boundaries and possibly other boundaries on the vesicles (Fig. S12). Furthermore, mixed lipid bilayers consisting of a liquid-ordered and a liquid-disordered phase show phase boundaries that can be detected by ΔCCF images (Fig. S13). We also performed measurements on live cells under different conditions as described in the Supporting Material. A comparison of the ΔCCF distributions for noise, lipid bilayers (diffusion only), translocated lipid bilayers (diffusion and transport/flow), and cell membranes is given in Fig. S14. A representative set of cross correlations of SBD-TMR(tetramethylrhodamine)-labeled SHSY5Y cells is given in Fig. S15.
Comparison of ITIR-FCCS with other approaches
As mentioned in the Introduction, FCS and ICS were developed in parallel as temporal and spatial, or imaging, correlation techniques. With the advent of new instrumentation, the two fields began to converge as temporal resolution for ICS increased and spatial multiplexing for FCS became possible. With the advent of STICS (19), kICS (20), and ITIR-FCS (33), the gap between the two fields has been closed. Although STICS and kICS already used the principles of spatiotemporal correlation, they had two disadvantages: 1), the mode of data collection for STICS is based on confocal scanning, which does not allow all pixels in an image to be recorded at the same time (this can be problematic if the time required to scan an image is much longer than the time required for particles to move from pixel to pixel); and 2), both techniques lack the necessary time resolution to measure temporal correlations on the single-pixel level. This problem has been addressed by ITIR-FCS, which to date has a time resolution as low as 0.5 ms (Fig. S8 D) and collects sufficient data (>10,000 frames) to allow pixelwise temporal correlation. Therefore, we based all our investigations of temporal dynamics on a scale of the resolution limit and added spatial information by the cross-correlation of pixel pairs. This was particularly necessary because we wanted to investigate membrane organization on the smallest accessible level. However, at present, the main disadvantage of ITIR-FCCS remains its limitation to surfaces. It should be noted that the data collected here could also be treated with techniques like STICS, kICS, or spatial pair-correlation function analysis (44) if such methods account for the illumination and detection geometries reported here.
Cell membrane organization
The distributions of the different lipid classes that make up cell membranes, including sphingolipids, cholesterol, and glycerophospholipids, are highly heterogeneous. The membrane exhibits a range of diffusion coefficients due to the presence of regions of lower mobility (called “lipid rafts”) that are embedded in a fluid phase of higher mobility. Lipid rafts have been reviewed in recent literature (2), and the 2006 Keystone Symposium on Lipid Rafts and Cell Function defined them as “small (10–200 nm), heterogeneous, highly dynamic, sterol- and sphingolipid-enriched domains that compartmentalize cellular processes” (1). MβCD is commonly used to disrupt rafts as it extracts cholesterol from membranes. Reducing cholesterol content in cell membranes leads to a mislocalization of raft-associated proteins and the loss of raft-like diffusion behavior (45–47). In addition, there is evidence that some raft-related components are linked to the cytoskeleton (10,48–50). Latrunculin A, an agent that disrupts the actin cytoskeleton, has been shown to change the diffusive behavior of rafts and raft-associated proteins such as CTxB (10,51). To investigate the cell membrane organization, we used SHSY5Y neuroblastoma cells labeled with the SBD of the amyloid peptide Aβ. On cell membranes, SBD exhibits diffusion behavior similar to that of CTxB, and thus it functions as a good raft marker (45).
The diffusion coefficient can be used as a measure of the fluidity of the membrane. Upon addition of MβCD, the average diffusion coefficient of membrane-bound SBD-TMR (0.7 ± 1.1 μm2/s) increases over a time interval of 30 min by a factor of ∼2–3 (1.7 ± 1.1 μm2/s; Table S4). Accordingly, the diffusion coefficient histograms show a progressive shift toward higher diffusion coefficients (Fig. 3 C). This is consistent with the expectation that there is an increase in lateral mobility of raft-related lipids and proteins on the cell membrane after cholesterol removal. An even stronger effect can be seen after latrunculin A treatment. The diffusion coefficient of membrane-bound SBD-TMR changes by a factor of ∼4 to 2.9 ± 2.2 μm2/s (Table S4). A similar effect can be seen when both MβCD and latrunculin A are used simultaneously and the diffusion coefficient increases to 2.8 ± 2.0 μm2/s (Table S4). In the control using DiI, a marker that reports diffusion of the liquid-disordered phase, only a small increase of the diffusion coefficient (<20%) can be seen. As shown by the histograms (Fig. 3, A and B), it is mainly the abolishment of the very slow diffusive fraction of DiI with D < 0.8 μm2/s that results in a change of the diffusion coefficient from 2.5 ± 2.0 μm2/s to 3.0 ± 2.0 μm2/s and 2.8 ± 1.8 μm2/s for MβCD and latrunculin A treatment, respectively. In all cases, the large SD of the diffusion coefficients indicates strong variations in the diffusion coefficients on the cell membrane, in agreement with the partitioning of SBD and DiI into different lipid regions (45). This interpretation is consistent with the dynamic partitioning raft model proposed earlier (52–54). These experiments show that both the cholesterol content and the integrity of the cytoskeleton are important for the raft-like behavior of SBD, but they have a much lower influence on DiI, a marker for the liquid-disordered, nonraft-related membrane fraction.
Figure 3.
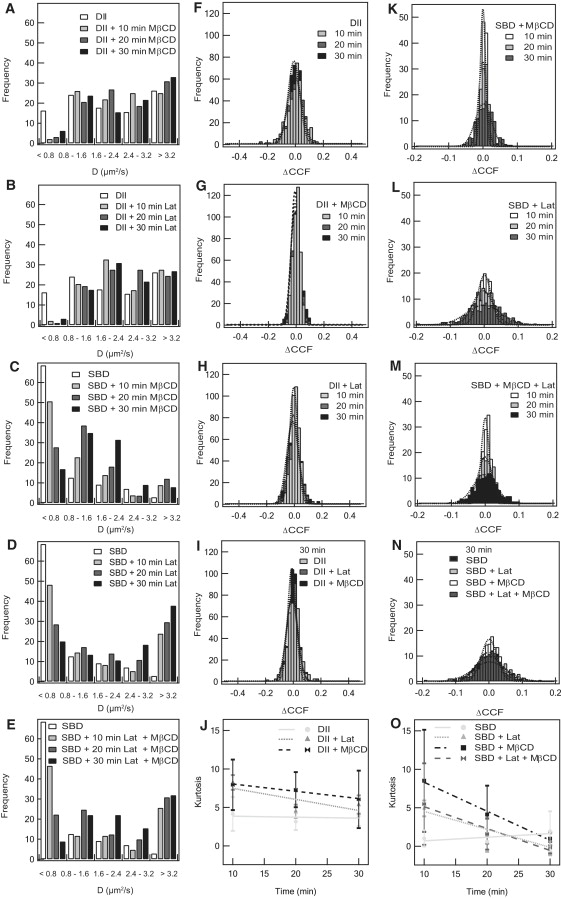
Effect of MβCD and latrunculin A treatment on the diffusion coefficient D and ΔCCF distributions of SBD- and DiI-labeled cells. (A–E) Histograms of D at various times of incubation with MβCD, latrunculin A, or both for SBD-TMR- or DiI-labeled cells. (F–H) ΔCCF histograms at different incubation times for cells labeled with DiI after different drug treatments. (I) ΔCCF histograms after 30 min incubation for cells labeled with DiI before and after treatment with MβCD or latrunculin A. Gaussian fits to the distribution are indicated by dotted lines. (J) Development of the kurtosis of the ΔCCF distributions shown in F–H. (K–M) ΔCCF histograms at different incubation times for cells labeled with SBD upon different drug treatments. (N) ΔCCF histograms after 30 min incubation for cells labeled with SBD-TMR before and after treatment with MβCD, latrunculin A, or both drugs. Gaussian fits to the distribution are indicated by dotted lines. (O) Development of the kurtosis of the ΔCCF distributions shown in K–M.
Possible changes in the larger-scale organization of the membrane after cholesterol extraction and cytoskeleton disruption were investigated by means of the ΔCCF images and their frequency histograms (Figs. 3 and 4). To compare the different histograms, we calculated the kurtosis (the fourth central moment of the histogram values) for each one. The kurtosis is a measure of the difference of a distribution from a Gaussian distribution. A positive kurtosis indicates a distribution with a higher peak around the mean but more values at the extremes compared to a Gaussian distribution. A negative kurtosis characterizes a distribution with a wider and flatter peak around the mean and fewer values at the extremes. Without MβCD addition, the ΔCCF images of SBD-TMR-labeled cells are characterized by a low kurtosis (close to zero; Fig. 3 O). There is a sudden increase in kurtosis values to ∼10 for ΔCCF distributions after the cells are incubated with MβCD for 10 min. The kurtosis then gradually decreases with time until, after 30 min of incubation, it reaches a range similar to that of nontreated cells (Fig. 3 O). Therefore, although the fluidity of the membrane, as characterized by the diffusion coefficient, increases within 30 min of MβCD addition due to cholesterol removal, the membrane reorganizes and reaches a similar state as nontreated cells during the same time period, as shown by the ΔCCF distribution.
Figure 4.
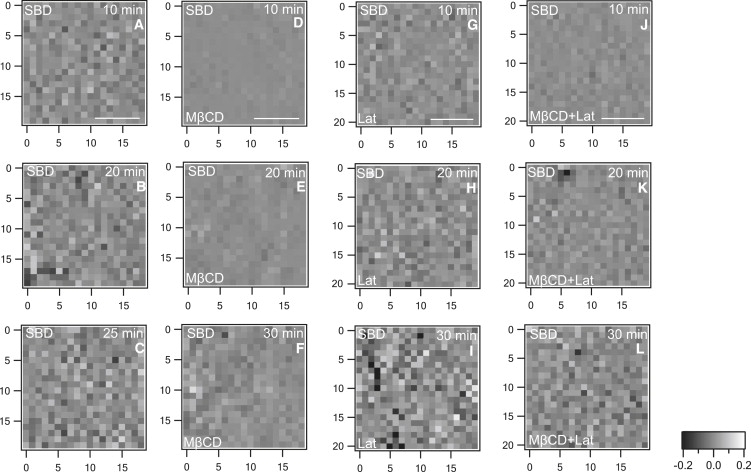
ΔCCF images of cells labeled with SBD-TMR. (A–C) Images of nontreated control cells. Panels D–F, G–I, and J–L show the ΔCCF images for cells treated with MβCD, latrunculin A, or both, respectively, after various times of incubation. Images in A–C are very heterogeneous. Upon addition of drugs, the images become less granular and the heterogeneity is restored to various degrees after increased incubation of the drug, as shown in F, I, and L. The heterogeneity in these images is comparable to that seen in images A–C.
A possible explanation for the change in ΔCCF distributions upon drug treatment is that the membrane equilibrium changes during the drug action. It has been shown that SBD is internalized by SHSY5Y cells, and MβCD treatment disturbs SBD internalization (45). The normally wide ΔCCF distribution may arise from the restriction or direction of SBD diffusion due to cytoskeletal confinements (55); alternatively, internalization may act as a sink for SBD, leading to wider, nonisotropic values of ΔCCF. Internalization inhibition, as seen in MβCD-treated cells, may result in a disruption of this flux and thus narrower distributions. In both normal and inhibited cases, however, the average of the ΔCCF distribution is zero because there is no macroscopic flux in the system. Therefore, changes in internalization would result in an altered membrane organization and transport patterns at least on the timescales of the drug action until a new membrane equilibrium is reached.
No further changes in ΔCCF distribution are observed for cells incubated with MβCD for times longer than 30 min (Fig. S16). This is consistent with earlier findings that MβCD treatment leads to an overall loss of cholesterol-dependent membrane lipid domains, and to a reorganization of the remaining nonextracted lipids, but does not change the original properties of the membrane (56). It should be noted that other reports found an indirect release of glycerophospholipids as a result of the disorganization in the membrane upon cholesterol removal (57), and it has been hypothesized that some compensatory changes in membrane lipid composition could occur after cholesterol depletion (58), which could explain our findings.
Treatment of SBD-TMR-labeled cells with latrunculin A also initially leads to an increased kurtosis, but at somewhat lower values (∼4) and with a less pronounced central peak. Within 30 min the kurtosis reaches values somewhat below zero, and the distribution of ΔCCF values achieves a slightly broader distribution than in the untreated cells (Fig. 3 L). Treatment of the cells with both MβCD and latrunculin A leads to a similar behavior as treatment with only latrunculin A. In the control with DiI, only small changes in the kurtosis can be seen in the cases of MβCD or latrunculin A.
Overall, our findings indicate that DiI, a marker for the liquid-disordered lipid phase on cell membranes, is not influenced by cholesterol or the cytoskeleton, and little change in the diffusion coefficient or ΔCCF distribution can be seen during treatment with MβCD or latrunculin A, respectively. However, SBD, a marker associated with ordered lipid domains or rafts, is influenced by both cholesterol and the cytoskeleton (10). When the cytoskeleton is disrupted, the diffusion coefficients of SBD are similar to those of DiI (52). Removal of cholesterol increases the diffusion coefficient, but to a lesser extent. Therefore, we suggest that the cytoskeleton is the main barrier to diffusion of SBD, and that the coupling of SBD to the cytoskeleton is mediated by cholesterol. Our findings are consistent with the proposal that the cell membrane is organized on different length scales (51), i.e., below the resolution limit in nanodomains (59,60) by the cholesterol content and on larger scales by the cytoskeleton. Furthermore, in agreement with earlier investigations, SBD partitions into cholesterol-dependent microdomains (45) that are connected to the cytoskeleton (10). Future studies comparing different lipid markers and the effects of removal of different lipids and the disruption of the cytoskeleton will have to be conducted to further elucidate the dynamic organization of cell membranes and the nature of the linkage between SBD and cholesterol and the cytoskeleton.
Conclusions
In this work, we introduce ITIR-FCCS as an extension of ITIR-FCS for the investigation of transport and diffusion processes in cell membranes. An expression for auto- and cross-correlations for areas of any arbitrary shape and size on an EMCCD chip was derived, and the resulting ITIR-FCCS calculations were applied to molecular systems exhibiting different combinations of flow and diffusion. The diffusion coefficients extracted are in good agreement with other reported measurements, and the measured flow velocities are close to the expected values. We studied anisotropic translocation in giant unilamellar vesicles and mixed lipid bilayers to demonstrate that membrane organization can in principle be studied by determining the difference of the forward and backward correlations in so-called ΔCCF images. Furthermore, using the ΔCCF approach, we demonstrated that cell membrane organization and heterogeneity can be observed by using markers for the liquid-disordered phase and lipid microdomains, and for their observation under the different conditions of cholesterol removal or cytoskeleton depolymerization. ITIR-FCCS provides adequate spatial and temporal resolution to measure membrane dynamics in a calibration-free manner, and thus is a powerful biophysical tool to gain novel insights into transport phenomena and membrane organization.
Acknowledgments
This work was supported by a grant from the Singapore Ministry of Education to T.W. (R-143-000-358-112). Funding was provided in part by the Institute of Bioengineering and Nanotechnology, A-STAR, Singapore, and the Biomedical Research Council, Singapore. J.S. is supported by a scholarship from the Singapore-MIT alliance, and L.G. and M.M. are research scholars of the National University of Singapore.
Footnotes
Jagadish Sankaran and Manoj Manna contributed equally to this work.
Supporting Material
References
- 1.Pike L.J. Rafts defined: a report on the Keystone Symposium on Lipid Rafts and Cell Function. J. Lipid Res. 2006;47:1597–1598. doi: 10.1194/jlr.E600002-JLR200. [DOI] [PubMed] [Google Scholar]
- 2.Pike L.J. The challenge of lipid rafts. J. Lipid Res. 2009;50:S323–S328. doi: 10.1194/jlr.R800040-JLR200. [DOI] [PMC free article] [PubMed] [Google Scholar]
- 3.Zhang Y., Li X., Becker K.A., Gulbins E. Ceramide-enriched membrane domains—structure and function. Biochim. Biophys. 2009;1788:178–183. doi: 10.1016/j.bbamem.2008.07.030. [DOI] [PubMed] [Google Scholar]
- 4.Garcia-Saez A.J., Schwille P. Fluorescence correlation spectroscopy for the study of membrane dynamics and protein/lipid interactions. Methods. 2008;46:116–122. doi: 10.1016/j.ymeth.2008.06.011. [DOI] [PubMed] [Google Scholar]
- 5.Magde D., Elson E.L., Webb W.W. Fluorescence correlation spectroscopy. II. An experimental realization. Biopolymers. 1974;13:29–61. doi: 10.1002/bip.1974.360130103. [DOI] [PubMed] [Google Scholar]
- 6.Magde D., Webb W.W., Elson E.L. Fluorescence correlation spectroscopy. III. Uniform translation and laminar flow. Biopolymers. 1978;17:361–376. [Google Scholar]
- 7.Elson E.L., Magde D. Fluorescence correlation spectroscopy. I. Conceptual basis and theory. Biopolymers. 1974;13:1–27. doi: 10.1002/bip.1974.360130103. [DOI] [PubMed] [Google Scholar]
- 8.Haustein E., Schwille P. Fluorescence correlation spectroscopy: novel variations of an established technique. Annu. Rev. Biophys. Biomol. Struct. 2007;36:151–169. doi: 10.1146/annurev.biophys.36.040306.132612. [DOI] [PubMed] [Google Scholar]
- 9.Krichevsky O., Bonnet G. Fluorescence correlation spectroscopy: the technique and its applications. Rep. Prog. Phys. 2002;65:251–297. [Google Scholar]
- 10.Bacia K., Scherfeld D., Kahya N., Schwille P. Fluorescence correlation spectroscopy relates rafts in model and native membranes. Biophys. J. 2004;87:1034–1043. doi: 10.1529/biophysj.104.040519. [DOI] [PMC free article] [PubMed] [Google Scholar]
- 11.Petersen N.O., Hoddelius P.L., Wiseman P.W., Seger O., Magnusson K.E. Quantitation of membrane receptor distributions by image correlation spectroscopy: concept and application. Biophys. J. 1993;65:1135–1146. doi: 10.1016/S0006-3495(93)81173-1. [DOI] [PMC free article] [PubMed] [Google Scholar]
- 12.Kolin D.L., Wiseman P.W. Advances in image correlation spectroscopy: measuring number densities, aggregation states, and dynamics of fluorescently labeled macromolecules in cells. Cell Biochem. Biophys. 2007;49:141–164. doi: 10.1007/s12013-007-9000-5. [DOI] [PubMed] [Google Scholar]
- 13.Digman M.A., Dalal R., Horwitz A.F., Gratton E. Mapping the number of molecules and brightness in the laser scanning microscope. Biophys. J. 2008;94:2320–2332. doi: 10.1529/biophysj.107.114645. [DOI] [PMC free article] [PubMed] [Google Scholar]
- 14.Unruh J.R., Gratton E. Analysis of molecular concentration and brightness from fluorescence fluctuation data with an electron multiplied CCD camera. Biophys. J. 2008;95:5385–5398. doi: 10.1529/biophysj.108.130310. [DOI] [PMC free article] [PubMed] [Google Scholar]
- 15.Srivastava M., Petersen N.O. Image cross-correlation spectroscopy: a new experimental biophysical approach to measurement of slow diffusion of fluorescent molecules. Methods Cell Sci. 1996;18:47–54. [Google Scholar]
- 16.Nohe A., Keating E., Fivaz M., van der Goot F.G., Petersen N.O. Dynamics of GPI-anchored proteins on the surface of living cells. Nanomedicine. 2006;2:1–7. doi: 10.1016/j.nano.2005.10.013. [DOI] [PubMed] [Google Scholar]
- 17.Nohe A., Keating E., Loh C., Underhill M.T., Petersen N.O. Caveolin-1 isoform reorganization studied by image correlation spectroscopy. Faraday Discuss. 2004;126:185–195. doi: 10.1039/b304943d. [DOI] [PubMed] [Google Scholar]
- 18.Srivastava M., Petersen N.O. Diffusion of transferrin receptor clusters. Biophys. Chem. 1998;75:201–211. doi: 10.1016/s0301-4622(98)00206-3. [DOI] [PubMed] [Google Scholar]
- 19.Hebert B., Costantino S., Wiseman P.W. Spatiotemporal image correlation spectroscopy (STICS) theory, verification, and application to protein velocity mapping in living CHO cells. Biophys. J. 2005;88:3601–3614. doi: 10.1529/biophysj.104.054874. [DOI] [PMC free article] [PubMed] [Google Scholar]
- 20.Kolin D.L., Ronis D., Wiseman P.W. k-Space image correlation spectroscopy: a method for accurate transport measurements independent of fluorophore photophysics. Biophys. J. 2006;91:3061–3075. doi: 10.1529/biophysj.106.082768. [DOI] [PMC free article] [PubMed] [Google Scholar]
- 21.Digman M.A., Sengupta P., Wiseman P.W., Brown C.M., Horwitz A.R. Fluctuation correlation spectroscopy with a laser-scanning microscope: exploiting the hidden time structure. Biophys. J. 2005;88:L33–L36. doi: 10.1529/biophysj.105.061788. [DOI] [PMC free article] [PubMed] [Google Scholar]
- 22.Brinkmeier M., Dorre K., Stephan J., Eigen M. Two beam cross correlation: a method to characterize transport phenomena in micrometer-sized structures. Anal. Chem. 1999;71:609–616. doi: 10.1021/ac980820i. [DOI] [PubMed] [Google Scholar]
- 23.Dittrich P.S., Schwille P. Spatial two-photon fluorescence cross-correlation spectroscopy for controlling molecular transport in microfluidic structures. Anal. Chem. 2002;74:4472–4479. doi: 10.1021/ac025625p. [DOI] [PubMed] [Google Scholar]
- 24.Pan X., Yu H., Shi X., Korzh V., Wohland T. Characterization of flow direction in microchannels and zebrafish blood vessels by scanning fluorescence correlation spectroscopy. J. Biomed. Opt. 2007;12:14034. doi: 10.1117/1.2435173. [DOI] [PubMed] [Google Scholar]
- 25.Korzh S., Pan X.F., Garcia-Lecea M., Winata C.L., Pan X.T. Requirement of vasculogenesis and blood circulation in late stages of liver growth in zebrafish. BMC Dev. Biol. 2008;8:84. doi: 10.1186/1471-213X-8-84. [DOI] [PMC free article] [PubMed] [Google Scholar]
- 26.Pan X., Shi X., Korzh V., Yu H., Wohland T. Line scan fluorescence correlation spectroscopy for three-dimensional microfluidic flow velocity measurements. J. Biomed. Opt. 2009;14:024049. doi: 10.1117/1.3094947. [DOI] [PubMed] [Google Scholar]
- 27.Blancquaert Y., Gao J., Derouard J., Delon A. Spatial fluorescence cross-correlation spectroscopy by means of a spatial light modulator. J. Biophotonics. 2008;1:408–418. doi: 10.1002/jbio.200810007. [DOI] [PubMed] [Google Scholar]
- 28.Gosch M., Serov A., Anhut T., Lasser T., Rochas A. Parallel single molecule detection with a fully integrated single-photon 2X2 CMOS detector array. J. Biomed. Opt. 2004;9:913–921. doi: 10.1117/1.1781668. [DOI] [PubMed] [Google Scholar]
- 29.Kannan B., Har J.Y., Liu P., Maruyama I., Ding J.L. Electron multiplying charge-coupled device camera based fluorescence correlation spectroscopy. Anal. Chem. 2006;78:3444–3451. doi: 10.1021/ac0600959. [DOI] [PubMed] [Google Scholar]
- 30.Burkhardt M., Schwille P. Electron multiplying CCD based detection for spatially resolved fluorescence correlation spectroscopy. Opt. Express. 2006;14:5013–5020. doi: 10.1364/oe.14.005013. [DOI] [PubMed] [Google Scholar]
- 31.Sisan D.R., Arevalo R., Graves C., McAllister R., Urbach J.S. Spatially resolved fluorescence correlation spectroscopy using a spinning disk confocal microscope. Biophys. J. 2006;91:4241–4252. doi: 10.1529/biophysj.106.084251. [DOI] [PMC free article] [PubMed] [Google Scholar]
- 32.Guo L., Har J.Y., Sankaran J., Hong Y.M., Kannan B. Molecular diffusion measurement in lipid Bilayers over wide concentration ranges: a comparative study. ChemPhysChem. 2008;9:721–728. doi: 10.1002/cphc.200700611. [DOI] [PubMed] [Google Scholar]
- 33.Kannan B., Guo L., Sudhaharan T., Ahmed S., Maruyama I. Spatially resolved total internal reflection fluorescence correlation microscopy using an electron multiplying charge-coupled device camera. Anal. Chem. 2007;79:4463–4470. doi: 10.1021/ac0624546. [DOI] [PubMed] [Google Scholar]
- 34.Qian H., Elson E.L. Fluorescence correlation spectroscopy with high-order and dual-color correlation to probe nonequilibrium steady states. Proc. Natl. Acad. Sci. USA. 2004;101:2828–2833. doi: 10.1073/pnas.0305962101. [DOI] [PMC free article] [PubMed] [Google Scholar]
- 35.Qian H., Saffarian S., Elson E.L. Concentration fluctuations in a mesoscopic oscillating chemical reaction system. Proc. Natl. Acad. Sci. USA. 2002;99:10376–10381. doi: 10.1073/pnas.152007599. [DOI] [PMC free article] [PubMed] [Google Scholar]
- 36.Heuff R.F., Swift J.L., Cramb D.T. Fluorescence correlation spectroscopy using quantum dots: advances, challenges and opportunities. Phys. Chem. Chem. Phys. 2007;9:1870–1880. doi: 10.1039/b617115j. [DOI] [PubMed] [Google Scholar]
- 37.Ries J., Petrov E.P., Schwille P. Total internal reflection fluorescence correlation spectroscopy: effects of lateral diffusion and surface-generated fluorescence. Biophys. J. 2008;95:390–399. doi: 10.1529/biophysj.107.126193. [DOI] [PMC free article] [PubMed] [Google Scholar]
- 38.Thomann D., Rines D.R., Sorger P.K., Danuser G. Automatic fluorescent tag detection in 3D with super-resolution: application to the analysis of chromosome movement. J. Microsc. Oxf. 2002;208:49–64. doi: 10.1046/j.1365-2818.2002.01066.x. [DOI] [PubMed] [Google Scholar]
- 39.Zhang B., Zerubia J., Olivo-Marin J.-C. Gaussian approximations of fluorescence microscope point-spread function models. Appl. Opt. 2007;46:1819–1829. doi: 10.1364/ao.46.001819. [DOI] [PubMed] [Google Scholar]
- 40.Zhang, B., J. Zerubia, and J. C. Olivo-Marin. 2006. A study of Gaussian approximations of fluorescence microscopy PSF models. In Conference on Three-Dimensional and Multidimensional Microscopy—Image Acquisition and Processing XIII. J. A. Conchello, C. J. Cogswell, and T. Wilson, editors. SPIE-International Society for Optical Engineering, San Jose, CA. K900–K900.
- 41.Benda A., Benes M., Marecek V., Lhotsky A., Hermens W.T. How to determine diffusion coefficients in planar phospholipid systems by confocal fluorescence correlation spectroscopy. Langmuir. 2003;19:4120–4126. [Google Scholar]
- 42.Przybylo M., Sykora J., Humpolickova J., Benda A., Zan A. Lipid diffusion in giant unilamellar vesicles is more than 2 times faster than in supported phospholipid bilayers under identical conditions. Langmuir. 2006;22:9096–9099. doi: 10.1021/la061934p. [DOI] [PubMed] [Google Scholar]
- 43.Dertinger T., von der Hocht I., Benda A., Hof M., Enderlein J. Surface sticking and lateral diffusion of lipids in supported bilayers. Langmuir. 2006;22:9339–9344. doi: 10.1021/la061389s. [DOI] [PubMed] [Google Scholar]
- 44.Digman M.A., Gratton E. Imaging barriers to diffusion by pair correlation functions. Biophys. J. 2009;97:665–673. doi: 10.1016/j.bpj.2009.04.048. [DOI] [PMC free article] [PubMed] [Google Scholar]
- 45.Hebbar S., Lee E., Manna M., Steinert S., Kumar G.S. A fluorescent sphingolipid binding domain peptide probe interacts with sphingolipids and cholesterol-dependent raft domains. J. Lipid Res. 2008;49:1077–1089. doi: 10.1194/jlr.M700543-JLR200. [DOI] [PubMed] [Google Scholar]
- 46.Lasserre R., Guo X.J., Conchonaud F., Hamon Y., Hawchar O. Raft nanodomains contribute to Akt/PKB plasma membrane recruitment and activation. Nat. Chem. Biol. 2008;4:538–547. doi: 10.1038/nchembio.103. [DOI] [PubMed] [Google Scholar]
- 47.Mukherjee S., Maxfield F.R. Membrane domains. Annu. Rev. Cell Dev. Biol. 2004;20:839–866. doi: 10.1146/annurev.cellbio.20.010403.095451. [DOI] [PubMed] [Google Scholar]
- 48.Caroni P. Actin cytoskeleton regulation through modulation of PI(4,5)P-2 rafts. EMBO J. 2001;20:4332–4336. doi: 10.1093/emboj/20.16.4332. [DOI] [PMC free article] [PubMed] [Google Scholar]
- 49.Seveau S., Eddy R.J., Maxfield F.R., Pierini L.M. Cytoskeleton-dependent membrane domain segregation during neutrophil polarization. Mol. Biol. Cell. 2001;12:3550–3562. doi: 10.1091/mbc.12.11.3550. [DOI] [PMC free article] [PubMed] [Google Scholar]
- 50.Yoon S.S., Jung K.I., Choi Y.L., Choi E.Y., Lee L.S. Engagement of CD99 triggers the exocytic transport of ganglioside GM1 and the reorganization of actin cytoskeleton. FEBS Lett. 2003;540:217–222. doi: 10.1016/s0014-5793(03)00268-0. [DOI] [PubMed] [Google Scholar]
- 51.Goswami D., Gowrishankar K., Bilgrami S., Ghosh S., Raghupathy R. Nanoclusters of GPI-anchored proteins are formed by cortical actin-driven activity. Cell. 2008;135:1085–1097. doi: 10.1016/j.cell.2008.11.032. [DOI] [PMC free article] [PubMed] [Google Scholar]
- 52.Pinaud F., Michalet X., Iyer G., Margeat E., Moore H.P. Dynamic partitioning of a glycosyl-phosphatidylinositol-anchored protein in glycosphingolipid-rich microdomains imaged by single-quantum dot tracking. Traffic. 2009;10:691–712. doi: 10.1111/j.1600-0854.2009.00902.x. [DOI] [PMC free article] [PubMed] [Google Scholar]
- 53.Kenworthy A.K., Nichols B.J., Remmert C.L., Hendrix G.M., Kumar M. Dynamics of putative raft-associated proteins at the cell surface. J. Cell Biol. 2004;165:735–746. doi: 10.1083/jcb.200312170. [DOI] [PMC free article] [PubMed] [Google Scholar]
- 54.Sheets E.D., Lee G.M., Simson R., Jacobson K. Transient confinement of a glycosylphosphatidylinositol-anchored protein in the plasma membrane. Biochemistry. 1997;36:12449–12458. doi: 10.1021/bi9710939. [DOI] [PubMed] [Google Scholar]
- 55.Kusumi A., Nakada C., Ritchie K., Murase K., Suzuki K. Paradigm shift of the plasma membrane concept from the two-dimensional continuum fluid to the partitioned fluid: high-speed single-molecule tracking of membrane molecules. Annu. Rev. Biophys. Biomol. Struct. 2005;34:351–378. doi: 10.1146/annurev.biophys.34.040204.144637. [DOI] [PubMed] [Google Scholar]
- 56.Ottico E., Prinetti A., Prioni S., Giannotta C., Basso L. Dynamics of membrane lipid domains in neuronal cells differentiated in culture. J. Lipid Res. 2003;44:2142–2151. doi: 10.1194/jlr.M300247-JLR200. [DOI] [PubMed] [Google Scholar]
- 57.Ilangumaran S., Hoessli D.C. Effects of cholesterol depletion by cyclodextrin on the sphingolipid microdomains of the plasma membrane. Biochem. J. 1998;335:433–440. doi: 10.1042/bj3350433. [DOI] [PMC free article] [PubMed] [Google Scholar]
- 58.Goodwin J.S., Drake K.R., Remmert C.L., Kenworthy A.K. Ras diffusion is sensitive to plasma membrane viscosity. Biophys. J. 2005;89:1398–1410. doi: 10.1529/biophysj.104.055640. [DOI] [PMC free article] [PubMed] [Google Scholar]
- 59.Jacobson K., Mouritsen O.G., Anderson R.G.W. Lipid rafts: at a crossroad between cell biology and physics. Nat. Cell Biol. 2007;9:7–14. doi: 10.1038/ncb0107-7. [DOI] [PubMed] [Google Scholar]
- 60.Sharma P., Varma R., Sarasij R.C., Ira, Gousset K. Nanoscale organization of multiple GPI-anchored proteins in living cell membranes. Cell. 2004;116:577–589. doi: 10.1016/s0092-8674(04)00167-9. [DOI] [PubMed] [Google Scholar]
Associated Data
This section collects any data citations, data availability statements, or supplementary materials included in this article.