

Abstract
Kir6.2[AAA] transgenic mouse islets exhibit mosaicism such that ∼70% of the β-cells have nonfunctional ATP-sensitive potassium (KATP) channels, whereas the remainder have normal KATP function. Despite this drastic reduction, the glucose dose-response curve is only shifted by ∼2 mM. We use a previously published mathematical model, in which KATP conductance is increased by rises in cytosolic calcium through indirect effects on metabolism, to investigate how cells could compensate for the loss of KATP conductance. Compensation is favored by the assumption that only a small fraction of KATP channels are open during oscillations, which renders it easy to upregulate the open fraction via a modest elevation of calcium. We show further that strong gap-junctional coupling of both membrane potential and calcium is needed to overcome the stark heterogeneity of cell properties in these mosaic islets.
Introduction
ATP-sensitive potassium channels are key regulators of glucose homeostasis in insulin-secreting β-cells in the pancreatic islets of Langerhans. Their conductance for K+ is affected by changes in nucleotide levels, and these channels can thereby couple plasma membrane electrical activity to cell metabolism (1–7). When blood glucose levels are low, glycolysis in β-cells is limited by the low influx of glucose, and the intracellular ADP/ATP ratio is high. Under these conditions, KATP channels in the membrane of β-cells remain open, holding the membrane potential at ∼−70 mV. The negative membrane potential keeps voltage-dependent Ca2+ channels shut and the intracellular Ca2+ concentration low. With such limited Ca2+ entry, no insulin is released. When blood glucose levels are high, more glucose is taken up, glycolysis is increased, and the intracellular ADP/ATP ratio decreases. The decreased intracellular ADP/ATP ratio closes most of the KATP channels (8–14); >97% of the KATP channels are closed at physiological stimulatory glucose concentrations. This allows the membrane potential to become more positive, opening the voltage-gated Ca2+ channels and raising the intracellular Ca2+ concentration inside the cell. The influx of Ca2+ both contributes to the ensuing oscillations of electrical activity and stimulates the release of insulin from secretory vesicles (15,16).
Thus, closing of the KATP channels represents a crucial step in the complex chain of events that links a rise in blood glucose concentration to insulin release (1,16–20). Various mutations that directly or indirectly affect β-cell KATP channel function decouple insulin release from blood glucose concentration in different ways and degrees. Accumulating evidence (1,5,16,17,19–21) links such mutations to a broad range of diseases from hyperinsulinism to development delay, epilepsy, and neonatal diabetes (DEND) and type 2 diabetes. Therefore, experimental and modeling studies of the behavior of islets of Langerhans taken from animals with genetically modified KATP channel activity can give valuable insight into the mechanisms of regulation of these channels.
The focus of this article is a theoretical investigation of the previously reported behavior of Kir6.2[AAA] transgenic mice, whose islets exhibit mosaicism such that approximately two-thirds of the β-cells have nonfunctional KATP channels (1,2,21). Despite the substantial reduction in the number of functional KATP channels, these studies found nearly normal calcium responses and only a small shift of ∼2–3 mM in the glucose dose-response curve. We show that a previously published model of pancreatic β-cell electrical activity (3) is able to reproduce the experimental findings, and we use bifurcation analysis to interpret the model's behavior.
In Modeling and Methods, we describe the model, modified from one of the models in Bertram and Sherman (3) that produces fast bursting (period < 1 min) involving oscillations in KATP conductance. Although similar results can be obtained with a model in which KATP conductance is constant, we choose this one, since, a priori, it seems more challenging for a model that depends on oscillations in KATP conductance to compensate for the reduced KATP conductance.
In Results, we study the behavior of the model in the cases of normal (WT) islet and mutant (AAA) islets. We consider first a simplified case of perfectly coupled islets, in which membrane potential, calcium, and nucleotide concentrations are uniform and can be represented by a single cell with a reduction of two-thirds of its functional KATP channels. We find that the model can compensate for this reduction by increasing the fraction of open KATP channels, mediated by an increase in intracellular calcium concentration. We then fit experimental data (22,23) relating changes in external glucose concentration to the plateau fraction of bursting to calculate the glucose dose-response curve for the model. The results agree with the observed modest shift of ∼2–3 mM in Kir6.2[AAA] islets (1,2,21). We apply bifurcation analysis of the simplified model to show geometrically how the compensation is achieved. Finally, we study a model islet consisting of 216 coupled β-cells in a cubic lattice, with two-thirds of the cells randomly assumed to lack KATP channels. These simulations confirm that electrical coupling among those drastically heterogeneous β-cells can account for the nearly normal response to glucose stimulation. However, the model indicates that coupling through diffusion of calcium through gap junctions may be needed in addition to coupling via membrane potential to equalize Ca2+ responses in a mosaic islet. We also contrast the AAA islets with islets that are heterozygous for a different mutation (21) in Kir6.2 or in SUR1, another component of the KATP channel, and have a similar reduction in KATP conductance, but uniformly among the cells, rather than in a mosaic pattern.
Modeling and Methods
In the first models for β-cell bursting (24) the slow negative feedback for oscillations was provided by Ca2+-activated K+ channels. KATP current was added later as a modulating current to transduce the effects of glucose metabolism (23). There is, however, more recent experimental evidence (18,25–28) that glucose metabolism results in oscillations in the ADP/ATP ratio, which would in turn lead to oscillations in KATP channel activity and hence membrane potential. KATP channels would then participate in the pacemaking of bursting β-cells electrical activity together with Ca2+-activated K+ channels.
We use a modified version of the bursting model with three slow variables described in Bertram and Sherman (3), which is based on the hypothesis that rises in Ca2+ increase the ADP/ATP ratio. The parameter values are given in Table 1. A few have been changed from Bertram and Sherman (3), mainly an increase in so that it can be interpreted as the total KATP conductance in the cell, rather than the residual conductance at stimulatory glucose; this also entails a change in the range of values of r. The decrease in sa was chosen to limit the shift in the glucose-dose response curve. The equations for membrane potential, V, delayed rectifier activation, n, cytosolic free Ca2+ concentration, c, the concentration of Ca2+ in the endoplasmic reticulum (ER), cer are as follows:
| (1) |
| (2) |
| (3) |
| (4) |
where the superscripts (i) index each variable for cell number for islet calculations. To carry out bifurcation analysis, we also consider a simplified case of perfectly coupled islets that can be represented by a single cell. In all cases, Cm is the membrane capacitance, τn is the activation time constant for the delayed rectifier channel, n(i)∞ is the steady-state function for the activation variable n, and J(i)mem and J(i)er are the Ca2+ fluxes through the plasma membrane and the ER membrane, respectively. The ionic currents in Eq. 1 are
| (5) |
| (6) |
| (7) |
| (8) |
Table 1.
Parameter values for Fig. 1
| Param. | Value | Param. | Value | Param. | Value | |
|---|---|---|---|---|---|---|
| r∗ | 0.2 μM | sa∗ | 0.01 μM | Cm | 5 300 fF | |
| fcyt; fer | 0.01 | τa | 300,000 ms | 300 pS | ||
| Vcyt/Ver | 5 | pleak | 0.0005 ms−1 | νn | −16 mV | |
| KD | 0.3 μM | α | 4.5 × 10⁻⁶ fA−1μM ms−1 | sn | 5 mV | |
| kPMCA | 0.2 ms−1 | kSERCA | 0.4 ms−1 | νm | −20 mV | |
| VK | −75 mV | τn | 16 ms | sm | 12 mV | |
| VCa | 25 mV | gK | 3000 pS | p | 5 | |
|
|
30,000 pS | gCa | 1200 pS |
The main change is an increase in so that it can be interpreted as the total KATP conductance in the cell, rather than the residual conductance at stimulatory glucose; this also entails a change in the range of values of r. The decrease in sa was chosen to limit the shift in the glucose dose response curve (compare Figs. 2 and 4). Figure legends indicate variations from the table.
Values modified from Bertram and Sherman (3).
The steady-state activation functions are
| (9) |
| (10) |
The function ω (c(i)) represents the fraction of Ca2+-sensitive K+ (KCa) channels that are activated by cytosolic Ca2+,
| (11) |
where kD is the dissociation constant for Ca2+ binding to the channel. Ca2+ fluxes across the plasma membrane, , and the ER membrane, , are given by
| (12) |
| (13) |
where α converts current to flux, pleak is the permeability of the ER membrane, and kPMCA and kSERCA are the plasma membrane and ER Ca2+ ATPase pump rates, respectively. Since c and cer represent the free Ca2+ concentration in the cytosol and the ER, respectively, we multiply the corresponding fluxes in Eqs. 3 and 4 by the fraction of free to total cytosolic Ca2+, fcyt, and ER Ca2+, fer. For the ER Ca2+ concentration, the flux J(i)er has also to be scaled by the ratio of the volumes of the cytosolic compartment, Vcyt, and the ER compartment, Ver.
In Eq. 8, the KATP conductance is given by
| (14) |
where is the maximum KATP channel conductance and a is the fraction of open KATP channels. The open fraction depends on the nucleotide concentrations and can be interpreted roughly as the ratio of ADP to ATP in the cell, which is assumed in the model to be regulated dynamically by the Ca2+ concentration. Thus, one more equation is added to Eqs. 1–4:
| (15) |
The time constant τa is large, so a slowly follows the steady-state function , which has an increasing sigmoidal dependence on cytosolic Ca2+ concentration:
| (16) |
This incorporates the effect of increasing glucose concentration through the parameter r and admits a phenomenological interpretation of the hypothesized negative feedback of Ca2+ on the ATP concentration as resulting from either stimulated ATP hydrolysis or inhibited ATP production (18,25–29). In either case, KATP conductance provides slow negative feedback to increases in c, which complements the rapid negative feedback provided by .
The model considered has been incorporated as a subset into a more recent model that includes, in addition, oscillations in glycolysis to produce slow bursting (period up to five minutes) and combined fast and slow oscillations (30). We use the submodel because we only have data on fast oscillations in AAA islets to which to compare.
The homogeneous islet model (representative single cell) is appropriate for studying the effects of KATP mutations on cell dynamics and bifurcation structure, but we are also interested in how much gap junctional coupling is needed to synchronize β-cells with different expression levels of functional KATP channels. To assess this, we incorporate both electrical and calcium coupling by adding the following gap-junctional conductance terms to the equations for V and c, respectively, Eqs. 1 and 3,
| (17) |
| (18) |
where gc,V and gc,Ca are the coupling conductance and the gap-junctional permeability for Ca2+, respectively, and the sum is taken over the set Γi of nearest neighbor cells to which cell (i) is coupled. In addition to the dependent variables and other expressions noted above, is indexed by the cell number (i) to represent mosaicism.
The model Eqs. 1–4 and 15, for the homogeneous islet case, were solved numerically using the software package XPPAUT (31). The bifurcation analysis was performed with AUTO 2000 (32). For the simulations of many coupled cells, we used a fourth-order Runge-Kutta method implemented in Fortran 95. The computer code used in the simulations can be downloaded from http://lbm.niddk.nih.gov/sherman/.
Results
Compensation for reduced KATP conductance in AAA islets
In Fig. 1 we simulate the behavior of WT and AAA (1,2) islets, assuming that they are sufficiently tightly coupled that each β-cell behaves more or less as the rest of the cells, and the islet can be approximated by a single representative β-cell (33). This simplification allows us to use the system of Eqs. 1–4 and 15, with (i) = 1, i.e., in the case of a single cell, to simulate islet behavior.
Figure 1.
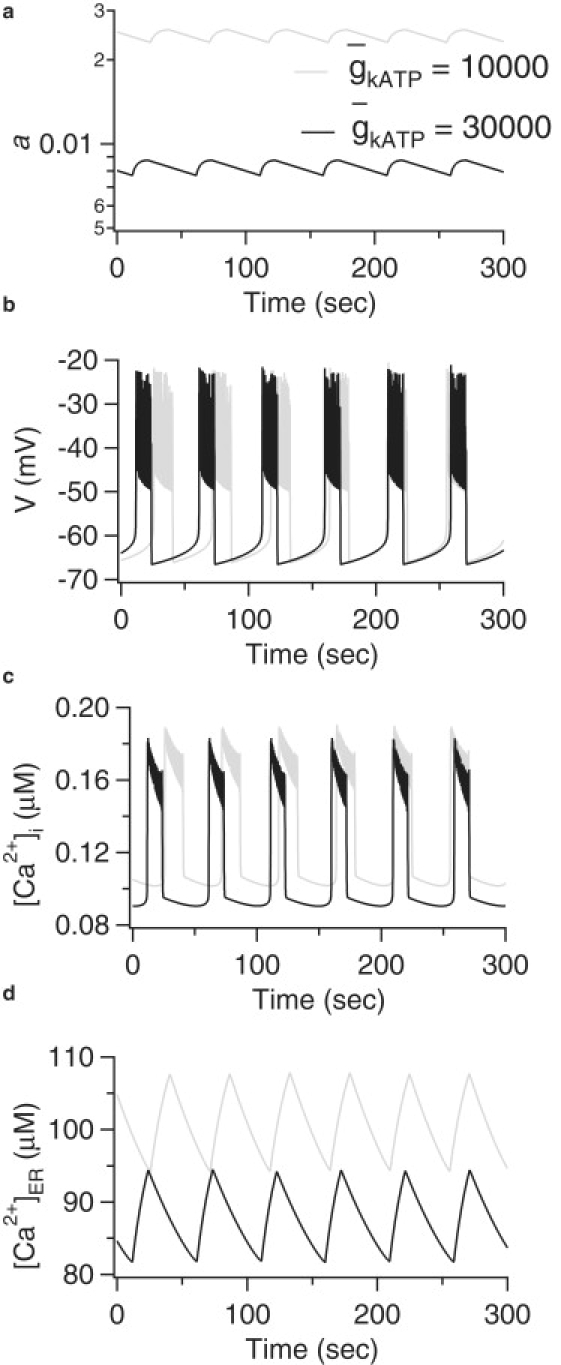
Model simulations of WT and AAA islets. (a) Fraction of open KATP channels, a; (b) membrane potential, V; (c) cytosolic Ca2+ concentration, [Ca2+]i; (d) ER Ca2+ concentration, [Ca2+]ER; and r = 0.2 for both islets.
The parameter represents the maximum nucleotide-sensitive K+ conductance or, in other words, the KATP conductance when all KATP channels are open. Since in AAA islets the KATP channels in ∼70% of the β-cells are nonfunctional whereas the remaining cells have normal KATP function (1,2), we simulate the perfectly coupled AAA islet by reducing the total KATP conductance by two-thirds from pS (WT) to pS (AAA). The simulations in Fig. 1 a indicate that the threefold reduction of the KATP conductance is compensated by an increase in the fraction of open KATP channels. With glucose concentration, represented indirectly by the parameter r, kept fixed here at 0.2 μM, the open fraction is increased a little less than threefold, resulting in a slightly smaller active KATP conductance and bursting with slightly increased plateau fraction (Fig. 1 b). If the value of r is reduced slightly, the open fraction and plateau fraction would be equalized, which can be interpreted as a shift in the glucose dose-response curve, as discussed in the next section. The increase in KATP channel open-fraction is mediated by a small rise in cytosolic Ca2+ (Fig. 1 c), which is sufficient to raise the ADP/ATP ratio via the mechanism represented in Eqs. 15 and 16. The increase in Ca2+ results as well in an increase in cer (Fig. 1 d).
The behavior of the model when the KATP conductance decreases is consistent with the spare-channel hypothesis (11). Since most of the KATP channels are closed under normal physiological stimulation (8–14), there are still plenty of spare channels that can be opened to provide KATP current sufficient to produce bursting electrical activity even in a situation like the AAA islets, in which approximately two-thirds of the KATP channels are not functional (1,2).
Glucose dose-response curve
Having shown that the model can explain the compensation for reduced KATP conductance, we continue by investigating whether the model can reproduce the reported modest shift in the glucose dose response of AAA islets compared to WT (1,2,21). To produce dose-response curves with the model, we need to map glucose concentration to values of r. We do this by mapping burst plateau fraction to r, as done in Himmel and Chay (23), shown in Fig. 2 a, and then mapping glucose concentration to burst plateau fraction (22), shown in Fig. 2 b. The mapping from glucose to r, which is assumed to be the same for both WT and AAA, is shown in Fig. 2 c. Although secretion depends on a metabolic coupling factor or factors and can increase in constant Ca2+ (34–36), plateau fraction is an appropriate surrogate for secretion averaged over the period of 1 h in static incubation. In agreement with experimental results (see Fig. 4 A in (1), Fig. 5 in (21), and Fig. 1 E in (2)), we find only a modest shift of 2–3 mM glucose in the dose-response curve for the AAA islet compared to the WT islet.
Figure 2.
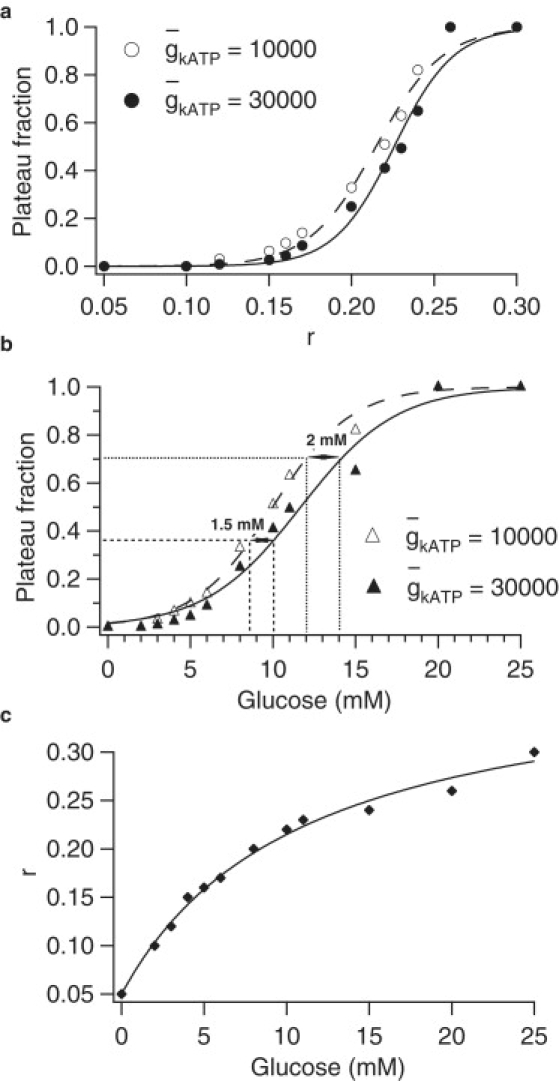
Glucose dose-response curves for simulated of WT and AAA islets. (a) Mapping of parameter r to plateau fraction. (b) Mapping of glucose to plateau fraction via r. (c) Mapping of glucose to r implied by panels a and b.
Whereas Fig. 1 shows that at a given value of r, there is only a small change in plateau fraction as a result of the reduction in , Fig. 2 shows that compensation for the reduction in requires only a small change in r to achieve the same plateau fraction. This small change represents the extent to which the rise in Ca2+ falls short of full compensation and which must be made up by a reduction in glucose concentration. In the next section, we examine the model from a geometrical viewpoint to see how these features come about.
Bifurcation analysis of the single-cell model
To gain a deeper understanding of which properties of the model give it the ability to adapt to a significantly reduced number of functional KATP channels with little change in the calcium dynamics and the glucose dose response curve, we carry out a fast-slow bifurcation analysis of Eqs. 1–4 and 15.
Since this system has more than one slow variable, there are several possible ways to divide it into fast and slow subsystems. We treat the fraction of open KATP channels, a, and the ER calcium concentration, cer, as bifurcation parameters, and, in contrast to the approach in Bertram and Sherman (3), we treat the cytosolic Ca2+ concentration, c, as a fast variable; the fast subsystem then consists of Eqs. 1–3. Fig. 3 a shows the bifurcation diagram with the fraction of open KATP channels, a, as the main bifurcation parameter and c as the output variable for both wild-type ( pS) and mutant ( pS) islets. The slow variation of cer sweeps the z-shaped slow manifold to the right as cer increases during the active phase and back to the left as cer decreases during the silent phase. To indicate this, the z curves are plotted for three different values of cer, corresponding to the minimum, average, and maximum attained during the oscillations. To keep the figure simple, the periodic branches are shown only for the average values of cer. Finally, the Ca2+ versus a trajectories are superimposed and are seen to follow the paths predicted by the locations of the left knee and the terminations of the periodic branches.
Figure 3.
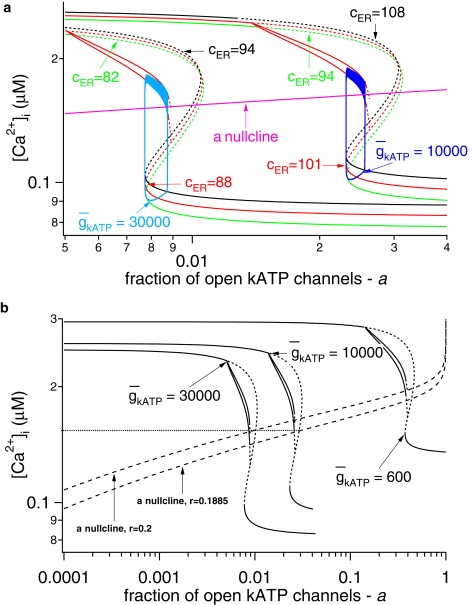
Fast-slow analysis of the model. (a) Bifurcation diagrams for WT and AAA islets, showing the maximum and the minimum of the periodic orbits for [Ca2+]i as a function of a. Superimposed on the bifurcation diagrams are the corresponding trajectories and the a nullclines for r = 0.2 μM and r = 0.1885 μM. (b) Bifurcation diagrams for WT, AAA islets, and an islet where 95% of the β-cells have nonfunctional KATP channels. The broken lines in the z curves denote instability.
The most prominent feature of the diagram is that decreasing shifts the steady-state curves to the right and slightly upward, corresponding to the threefold increase in the fraction of open KATP channels and the small increase in the level of Ca2+ that produces it. The behavior of the system is also determined by the nullcline for a, particularly its intersection with the z curve, which determines the unstable steady state of the full system, Eqs. 1–4 and 15. Bursting oscillations are obtained approximately when the nullcline crosses the z curve along the middle branch of saddle points, the portion that slopes up and to the right. When the nullcline intersects the bottom branch, the solution is a steady state, and, roughly, when it intersects the periodic branch, the solution takes the form of continuous spiking. The a nullcline translates upward as the glucose-sensing parameter r increases, and the steeply rising portion of the plateau fraction versus r curve in Fig. 2 a thus corresponds to the interval of r values for which the intersection of the a nullcline and the z curve traverses the region between the left knee and the periodic branch termination. The plateau fraction increases monotonically as the intersection moves up to the right because the flow becomes slower in the active phase and faster in the silent phase.
Examination of the bifurcation diagram with this in mind suggests that the modest shift in the glucose dose response curve shown in Fig. 2 b is a consequence of the nearly horizontal slope of the a nullcline. That is, for fixed r, the system with reduced has an intersection that lies closer to the periodic branch, and hence exhibits larger plateau fraction, but only a small decrease in r is required to move the intersection back down to a level that corresponds to the same plateau fraction. Fig. 3 b shows that shifting r from 0.2 to 0.1885 μM shifts the a nullcline down so that the it intersects the z curve for = 10,000 pS at the same Ca2+ value as the unshifted nullcline intersects the z curve for = 30,000 pS. This results (not shown) in approximately the same average level of active conductance (≈245 pS) and approximately the same plateau fraction (≈0.25). The small shift in r required to equalize the plateau fraction reflects the small shift in the glucose dose-response curve produced by the model.
Fig. 3 b suggests that at r = 0.2 μM, cytosolic Ca2+ oscillations will still be obtained even when the maximum KATP conductance is reduced by 98% ( = 600 pS). In this case, however, the levels of cytosolic Ca2+ and the plateau fraction would be elevated to a much greater extent. At = 500 pS, bursting is no longer possible for this value of r, because the a nullcline intersects too deeply into the periodic branch, and if is reduced further to 200 pS, only continuous spiking can be obtained, regardless of the value of r. Note, however, that even at = 600 pS, bursting may be prevented by a further, biophysical restriction. This would require a to have an average value of ∼0.38, whereas the experiments in the literature (8,13,25,37) indicate that even in 0 glucose, only ∼20% of the total conductance in the cell would be opened. (Washing out all the cell's ATP can open up the rest.) If this bound is to be respected, then the model predicts bursting only for >∼1200 pS.
If the a nullcline is made less flat by increasing sa from 0.01 to 0.1, similar results are obtained (Fig. 4). Oscillations with little change in Ca2+ levels and plateau fraction can again be obtained when is reduced by two-thirds (not shown), but the shift in the dose response curve is approximately doubled to ∼4 mM.
Figure 4.
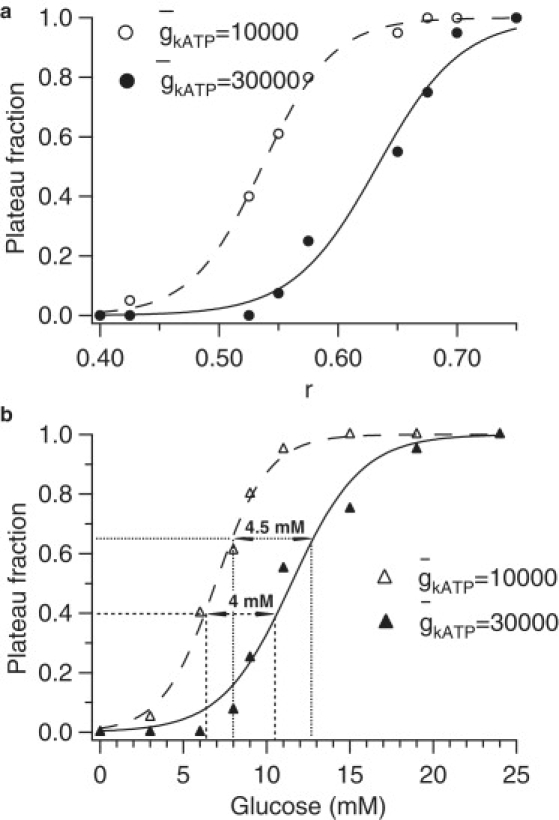
Glucose dose-response curves for simulated WT and AAA islets with sa increased from 0.01 to 0.1 μM (compare Fig. 2). (a) Mapping of r to plateau fraction. (b) Mapping of glucose to plateau fraction via r.
To investigate further the robustness of the small dose response shift, we also considered the possibility that the wild-type value of is four-times smaller (7500 pS) than in Fig. 1, with glucose remapped to r such that the mean KATP open fraction is fourfold higher than in Fig. 1 for the same glucose level. The shift in the dose response curve (not shown) is only slightly larger than in Fig. 2; it shifts ∼2–3 mM in glucose for the AAA case, which now corresponds to = 2500 pS.
Coupled mosaic islets
The preceding sections have shown that a mosaic islet in which one-third of the cells have functional KATP channels can exhibit nearly normal Ca2+ oscillations provided it is very tightly coupled, such that it behaves like a single cell with one-third the normal conductance. It remains to be shown that plausible coupling strength can achieve sufficiently tight coupling. To investigate this, we simulate AAA islets with 216 coupled β-cell that are arranged in a 6 × 6 × 6 cube. Each cell is coupled to its nearest neighbor and has dynamics governed by Eqs. 1–4 and 15. In this cubic islet, the interior cells have six neighbors, whereas the peripheral cells have three, four, or five neighbors depending on their location on the islet surface. To achieve the mosaic expression of β-cells with functional KATP channels as reported in the transgenic Kir6.2[AAA] islet (1,2,21), we assume that two-thirds (a quantity of 144) of the cells in the islet, which are randomly (uniformly) distributed, are lacking functional KATP channels (have = 0 pS). The rest of the β-cells (a quantity of 72) are considered to be WT (have = 30,000 pS). The cells are assumed to be coupled both electrically (38–41) and through diffusion of Ca2+ via gap-junctions (42–44).
In Fig. 5 we present model simulations of such an islet where the traces are taken from a WT β-cell and a β-cell in which there are no functional KATP channels. Two different coupling strengths are represented in Fig. 5. The coupling strength for membrane potential in Fig. 5 b is comparable to the experimentally measured values (45,46), whereas that in Fig. 5 b is increased greater than fourfold. The permeability of the gap junctions for Ca2+ is not known, and has been chosen sufficiently large to synchronize as described below.
Figure 5.
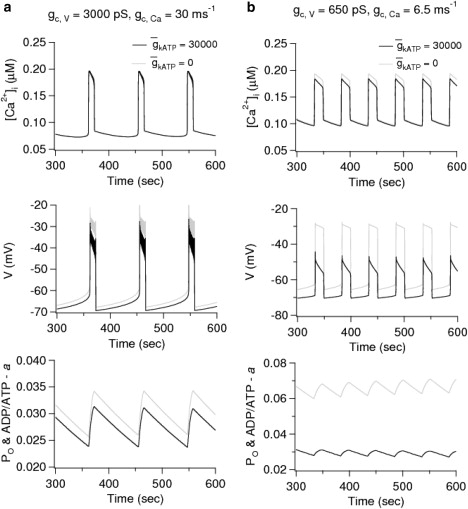
Simulations of a mosaic AAA islet of 216 coupled cells with two-thirds of β-cells having nonfunctional KATP channels, one-third with oscillating KATP conductance. The coupling strength used in the simulations is indicated in the top panels for a and b. The gray curves are for a representative mutant cell, and the black curves are for a representative wild-type cell. In the bottom panels, the nucleotide ratio a is plotted; for the wild-type cell only, this also represents the open probability of the KATP channels.
Consistent with the experiments in Rocheleau et al. (2), Fig. 5 b demonstrates that strong electrical coupling in the physiological range is sufficient to synchronize the responses in the mosaic islet. Furthermore, the top panel of Fig. 5 b shows that the model can reproduce the experimental data showing that Ca2+ levels are equalized between mutant and wild-type cells within the islet (see Fig. 1 C in (2)). This result is not obtained in the absence of diffusion of Ca2+ through the gap junctions, even with exaggerated coupling through membrane potential (not shown). The bottom panels in Fig. 5 show that coupling through Ca2+ is also able to synchronize the nucleotide ratio a and that the stronger value of diffusion of calcium through gap-junctions is able to equalize the nucleotide ratio between the WT and mutant cells in the islet; this is a consequence of the feedback of Ca2+ onto ATP production (Eq. 15), which is assumed to operate whether or not KATP channels are present. In both Fig. 5, a and b, the open fraction of the WT cells agrees with the values found in the perfectly coupled islet (Fig. 1 d).
The most striking finding of our analysis is that although coupling strengths in the physiological range for normal islets (45,46) are sufficient to synchronize the responses in an AAA islet (Fig. 5 b), they are not sufficient to produce normal bursts in the membrane potential (Fig. 5 b, middle panel). In the simulations, the fast spikes within a burst of the membrane potential disappear by oscillator death because of the extreme heterogeneity of the mosaic islets (47). However, if the electrical and Ca2+ coupling are increased further (Fig. 5 a), the spikes in the membrane potential during the active phases of the bursts are restored even when the cells in the mutant islet are so different. In contrast, if is reduced uniformly by two-thirds in all the cells, synchrony, equalized Ca2+, and normal spike amplitude can be achieved with coupling only on membrane potential equal to the weaker value in Fig. 5 (not shown). This case is also of physiological interest as it corresponds to islets from mice that are heterozygous for the Kir6.2 or SUR1 genes (21).
Discussion
In this study we have sought to account for the nearly normal glucose sensitivity observed experimentally (1,2,21) in transgenic Kir6.2[AAA] islets that are characterized by mosaic structure in which ∼70% of their β-cells lack functional KATP channels. We adapted a previously published mathematical model (3) of β-cell electrical activity that incorporates oscillations in the fraction of open KATP channels, which participate in the pacemaking of β-cells electrical activity together with Ca2+-sensitive K+ channels. The oscillations in KATP conductance reflect oscillations in the nucleotide ratio ADP/ATP that are driven by the rise and fall of cytosolic Ca2+. The model is agnostic as to whether this effect is caused by increased ATP consumption (48–50) or decreased ATP production (51) or both, so our results do not depend on the answer to this question. Under this generic assumption, a threefold reduction in KATP conductance in AAA islets leads to a nearly threefold increase in the fraction of open KATP channels, which restores nearly normal oscillations (Fig. 1) as observed experimentally. This result is achieved in the model because elevated Ca2+ persists until the total conductance of open KATP channels rises to the range (≈250 pS) needed to turn the activity off. This range is in agreement with that reported in wild-type (WT) islets (12,18,52,53).
To achieve an exact threefold rise in active KATP conductance, glucose must be lowered in the AAA case compared to WT, that is, the glucose dose response curve shifts to the left. To estimate the size of the shift, we mapped the open fraction obtained in the model as a function of the glucose-sensing parameter, r in Eq. 15. We found (Fig. 2) that the shift was ∼2 mM. We then showed geometrically that this small shift was possible because of the assumed relatively steep increase in steady-state open fraction with Ca2+ (Fig. 3). The result is not excessively sensitive to the slope of this increase, as a 10-fold reduction in the slope results in only a twofold increase in the shift of the glucose dose response curve (Fig. 4). We also found that the modest shift in the dose response curve is not very sensitive to the assumed level of (not shown).
The model predicts that islets can compensate for much larger reductions in . The most fundamental limitation is that the KATP open fraction cannot exceed 1; this would predict a minimum value at which oscillations could ever be obtained of only 100 pS, given the other parameters of the model's fast subsystem. However, long before this limit was reached, bursting would be prevented because the a nullcline would intersect the branch of periodic solutions (Fig. 3); this is predicted to occur at ∼ = 500 pS. Moreover, there is experimental evidence (8,13,25,37) that the fraction of open KATP channels in 0 glucose is ≈0.2. This bound would limit the residual KATP conductance for a mutant to ∼1200 pS. Even so, that represents impressive tolerance to a decrease of 96% from 30,000 pS, or 84% from 7500 pS.
We note that Ca2+ oscillations have been observed in islets from mice in which all KATP channels are lost (54,55). The mechanism described in this article cannot account for such behavior, and instead the existence of an alternative metabolically sensitive K+ channel has been suggested to compensate partially for the loss of KATP channels (54). It is possible that the compensation in AAA mutants is also due to an alternative channel. No such channel has yet been identified, however, and our model shows that it may not be required to account for the partial loss of KATP.
A model with constant fraction of open KATP channels would also be able to compensate for reduction in total KATP conductance. In this case, β-cell electrical activity would be driven by other currents, such as KCa current, and the role of KATP current would be only to trigger the bursts in the membrane potential rather than contribute to pacemaking. In this case, there would be no increase in the fraction of open KATP channels as a result of Ca2+ feedback and all of the burden of compensation would be borne by a reduction in glucose to increase the ratio of ADP/ATP. Thus, other things being equal, one might expect that the shift in the dose response curve when is reduced would be larger than in a model with oscillating . However, our model is very sensitive to the open fraction of KATP channels when that fraction is fixed independent of Ca2+, and we have not found any other satisfactory model with which to test this conjecture quantitatively. We can nonetheless conclude from the findings presented here that the ability of islets to compensate for substantial reductions in KATP conductance is not per se a reason to prefer models with nonoscillating KATP to models with oscillating KATP.
We also examined whether gap-junctional coupling of plausible strength can produce the synchronized response in mosaic islets assumed in the above calculations. We simulated islets in which two-thirds of the cells had no KATP channels while one-third had the normal complement. Although in our simulations we used only 216 cells (arranged in a 6 × 6 × 6 cube), we have obtained qualitatively similar results (not shown) using 1728 cells (arranged in a 12 × 12 × 12 cube). As has been previously shown (56), the gap-junctional conductance required to synchronize an islet scales like the diameter of the islet. Thus, increasing the islet size from 6 × 6 × 6 to 12 × 12 × 12 would increase the conductance needed to synchronize its activity by a factor of approximately two. The simulations (Fig. 5) showed that synchrony and equalized Ca2+ between WT and mutant cells within the islet are possible only if coupling via diffusion of Ca2+ is assumed in addition to the standard coupling via membrane potential. This confirmed the suggestion that gap junctional coupling could account for the nearly normal glucose sensitivity observed experimentally in AAA islets (2). However, to obtain voltage bursts with spikes, rather than plateaus, the coupling for membrane potential had to be at least fourfold greater than that measured physiologically. At this time, membrane potential oscillations in AAA islets have not been studied, so we do not know if the coupling strength is upregulated or if in fact the spikes in the burst are eliminated. On the other hand, it is possible to obtain synchronized voltage bursts without spikes in the active phase as in Fig. 5 b if the coupling conductance is reduced to 0.2 nS because it is much easier to synchronize the slow waves than the spikes. In islets in which coupling is reduced uniformly in every cell, as in Kir6.2 +/− or SUR1 +/− mice (21) or islets with partial but uniform pharmacological blockade of KATP channels, the model indicates that synchrony is not a problem.
We have focused on transgenic Kir6.2[AAA] (1,2,21) islets and showed that reducing results in a left shift of the glucose dose-response curve, which is partly compensated by the rise in Ca2+. Diabetes has been associated in genome scans with reduced KATP channel affinity for ATP. In such a case, one can expect a right shift in the glucose dose-response curve, as has been observed in transgenic mice (57). The extent of the shift as a function of the reduction in ATP sensitivity and whether the shift may be partly compensated by a fall in Ca2+ are interesting questions for future modeling studies.
Conclusions
The results of the study can be summarized in the following predictions about the fraction of open KATP channels in β-cells from WT and AAA islets, and about the effect of electrical gap-junctional coupling and calcium diffusion through gap-junctions on the collective behavior of coupled heterogeneous β-cells. We propose independent of the details of the model for electrical activity:
-
Prediction 1.
The fraction of open K+ channels in transgenic Kir6.2[AAA] islets (1,2,21) is approximately threefold larger than in wild-type islets at equivalent activity (Fig. 1 a).
-
Prediction 2.
Calcium diffusion through gap-junctions among the β-cells is needed to equalize [Ca2+]i levels in the transgenic Kir6.2[AAA] islets (1,2,21) due to widely discrepant K+ conductances (Fig. 5 b).
-
Prediction 3.
In Kir6.2[AAA] islets, either coupling is stronger than in wild-type islets (Fig. 5 a) or spiking is lost (Fig. 5 b). Kir6.2 +/− islets would not require such strong coupling because of lesser heterogeneity.
Acknowledgments
We thank Colin Nichols for discussions that were helpful in formulating the models and interpreting the data.
A.S. was supported by the intramural research program of the National Institute of Diabetes and Digestive and Kidney Diseases, National Institutes of Health, Bethesda, MD.
Footnotes
Krasimira Tsaneva-Atanasova's present address is Department of Engineering Mathematics, University of Bristol, Bristol, United Kingdom.
References
- 1.Koster J.C., Remedi M.S., Flagg T.P., Johnson J.D., Markova K.P. Hyperinsulinism induced by targeted suppression of β-cell KATP channels. Proc. Natl. Acad. Sci. USA. 2002;99:16992–16997. doi: 10.1073/pnas.012479199. [DOI] [PMC free article] [PubMed] [Google Scholar]
- 2.Rocheleau J.V., Remedi M.S., Granada B., Head W.S., Koster J.C. Critical role of gap junction coupled KATP channel activity for regulated insulin secretion. PLoS Biol. 2006;4:e26. doi: 10.1371/journal.pbio.0040026. [DOI] [PMC free article] [PubMed] [Google Scholar]
- 3.Bertram R., Sherman A. A calcium-based phantom bursting model for pancreatic islets. Bull. Math. Biol. 2004;66:1313–1344. doi: 10.1016/j.bulm.2003.12.005. [DOI] [PubMed] [Google Scholar]
- 4.Ashcroft F.M., Kakei M., Kelly R.P., Sutton R. ATP -sensitive K+ channels in human isolated pancreatic β-cells. FEBS Lett. 1987;215:9–12. doi: 10.1016/0014-5793(87)80103-5. [DOI] [PubMed] [Google Scholar]
- 5.Ashcroft F. The Walter B. Cannon Physiology in Perspective Lecture, 2007. ATP -sensitive K+ channels and disease: from molecule to malady. Am. J. Physiol. Endocrinol. Metab. 2007;293:E880–E889. doi: 10.1152/ajpendo.00348.2007. [DOI] [PubMed] [Google Scholar]
- 6.Babenko A.P., Aguilar-Bryan L., Bryan J. A view of SUR/Kir6.X, KATP channels. Annu. Rev. Physiol. 1998;60:667–687. doi: 10.1146/annurev.physiol.60.1.667. [DOI] [PubMed] [Google Scholar]
- 7.Cook D.L., Hales C.N. Intracellular ATP directly blocks K+ channels in pancreatic B-cells. Nature. 1984;311:271–273. doi: 10.1038/311271a0. [DOI] [PubMed] [Google Scholar]
- 8.Ashcroft F.M., Ashcroft S.J., Harrison D.E. Properties of single potassium channels modulated by glucose in rat pancreatic β-cells. J. Physiol. 1988;400:501–527. doi: 10.1113/jphysiol.1988.sp017134. [DOI] [PMC free article] [PubMed] [Google Scholar]
- 9.Ashcroft F.M., Harrison D.E., Ashcroft S.J. Glucose induces closure of single potassium channels in isolated rat pancreatic β-cells. Nature. 1984;312:446–448. doi: 10.1038/312446a0. [DOI] [PubMed] [Google Scholar]
- 10.Cook D.L., Ikeuchi M. Tolbutamide as mimic of glucose on β-cell electrical activity. ATP -sensitive K+ channels as common pathway for both stimuli. Diabetes. 1989;38:416–421. doi: 10.2337/diab.38.4.416. [DOI] [PubMed] [Google Scholar]
- 11.Cook D.L., Satin L.S., Ashford M.L., Hales C.N. ATP-sensitive K+ channels in pancreatic β-cells. Spare-channel hypothesis. Diabetes. 1988;37:495–498. doi: 10.2337/diab.37.5.495. [DOI] [PubMed] [Google Scholar]
- 12.Rorsman P., Trube G. Glucose dependent K+-channels in pancreatic β-cells are regulated by intracellular ATP. Pflugers Arch. 1985;405:305–309. doi: 10.1007/BF00595682. [DOI] [PubMed] [Google Scholar]
- 13.Tarasov A., Girard C., Ashcroft F. ATP sensitivity of the ATP-sensitive K+ channel in intact and permeabilized pancreatic β-cells. Diabetes. 2006;55:2446–2454. doi: 10.2337/db06-0360. [DOI] [PubMed] [Google Scholar]
- 14.Valdeolmillos M., Nadal A., Contreras D., Soria B. The relationship between glucose-induced KATP channel closure and the rise in [Ca2+]i in single mouse pancreatic β-cells. J. Physiol. 1992;455:173–186. doi: 10.1113/jphysiol.1992.sp019295. [DOI] [PMC free article] [PubMed] [Google Scholar]
- 15.Arkhammar P., Nilsson T., Rorsman P., Berggren P.O. Inhibition of ATP-regulated K+ channels precedes depolarization-induced increase in cytoplasmic free Ca2+ concentration in pancreatic β-cells. J. Biol. Chem. 1987;262:5448–5454. [PubMed] [Google Scholar]
- 16.Nichols C.G., Koster J.C. Diabetes and insulin secretion: whither KATP? Am. J. Physiol. Endocrinol. Metab. 2002;283:E403–E412. doi: 10.1152/ajpendo.00168.2002. [DOI] [PubMed] [Google Scholar]
- 17.Ashcroft F.M. ATP-sensitive potassium channelopathies: focus on insulin secretion. J. Clin. Invest. 2005;115:2047–2058. doi: 10.1172/JCI25495. [DOI] [PMC free article] [PubMed] [Google Scholar]
- 18.Larsson O., Kindmark H., Brandstrom R., Fredholm B., Berggren P.O. Oscillations in KATP channel activity promote oscillations in cytoplasmic free Ca2+ concentration in the pancreatic β-cell. Proc. Natl. Acad. Sci. USA. 1996;93:5161–5165. doi: 10.1073/pnas.93.10.5161. [DOI] [PMC free article] [PubMed] [Google Scholar]
- 19.Koster J.C., Permutt M.A., Nichols C.G. Diabetes and insulin secretion: the ATP-sensitive K+ channel (KATP) connection. Diabetes. 2005;54:3065–3072. doi: 10.2337/diabetes.54.11.3065. [DOI] [PubMed] [Google Scholar]
- 20.Nichols C.G. KATP channels as molecular sensors of cellular metabolism. Nature. 2006;440:470–476. doi: 10.1038/nature04711. [DOI] [PubMed] [Google Scholar]
- 21.Remedi M., Rocheleau J., Tong A., Patton B., McDaniel M. Hyperinsulinism in mice with heterozygous loss of KATP channels. Diabetologia. 2006;49:2368–2378. doi: 10.1007/s00125-006-0367-4. [DOI] [PubMed] [Google Scholar]
- 22.Meissner H.P., Schmelz H. Membrane potential of β-cells in pancreatic islets. Pflugers Arch. 1974;351:195–206. doi: 10.1007/BF00586918. [DOI] [PubMed] [Google Scholar]
- 23.Himmel D., Chay T.R. Theoretical studies on the electrical activity of pancreatic β-cell s as a function of glucose. Biophys. J. 1987;51:89–107. doi: 10.1016/S0006-3495(87)83314-3. [DOI] [PMC free article] [PubMed] [Google Scholar]
- 24.Chay T.R., Keizer J. Minimal model for membrane oscillations in the pancreatic β-cell. Biophys. J. 1983;42:181–190. doi: 10.1016/S0006-3495(83)84384-7. [DOI] [PMC free article] [PubMed] [Google Scholar]
- 25.Misler S., Falke L.C., Gillis K., McDaniel M.L. A metabolite-regulated potassium channel in rat pancreatic β-cells. Proc. Natl. Acad. Sci. USA. 1986;83:7119–7123. doi: 10.1073/pnas.83.18.7119. [DOI] [PMC free article] [PubMed] [Google Scholar]
- 26.Rolland J.F., Henquin J.C., Gilon P. Feedback control of the ATP-sensitive K+ current by cytosolic Ca2+ contributes to oscillations of the membrane potential in pancreatic β-cells. Diabetes. 2002;51:376–384. doi: 10.2337/diabetes.51.2.376. [DOI] [PubMed] [Google Scholar]
- 27.Kanno T., Rorsman P., Gopel S.O. Glucose-dependent regulation of rhythmic action potential firing in pancreatic β-cells by KATP-channel modulation. J. Physiol. 2002;545:501–507. doi: 10.1113/jphysiol.2002.031344. [DOI] [PMC free article] [PubMed] [Google Scholar]
- 28.MacDonald P.E., Rorsman P. Oscillations, intercellular coupling, and insulin secretion in pancreatic β-cells. PLoS Biol. 2006;4:e49. doi: 10.1371/journal.pbio.0040049. [DOI] [PMC free article] [PubMed] [Google Scholar]
- 29.Duchen M.R., Smith P.A., Ashcroft F.M. Substrate-dependent changes in mitochondrial function, intracellular free calcium concentration and membrane channels in pancreatic β-cells. Biochem. J. 1993;294:35–42. doi: 10.1042/bj2940035. [DOI] [PMC free article] [PubMed] [Google Scholar]
- 30.Bertram R., Satin L., Zhang M., Smolen P., Sherman A. Calcium and glycolysis mediate multiple bursting modes in pancreatic islets. Biophys. J. 2004;87:3074–3087. doi: 10.1529/biophysj.104.049262. [DOI] [PMC free article] [PubMed] [Google Scholar]
- 31.Ermentrout B. SIAM; Philadelphia, PA: 2002. Simulating, Analyzing and Animating Dynamical Systems: A Guide to XPPAUT for Researchers and Students. [Google Scholar]
- 32.Doedel E., Paffenroth R., Champneys A., Fairgrieve T., Kuznetsov Y. Caltech; Pasadena, CA: 2001. AUTO2000: Continuation and bifurcation software for ordinary differential equations (with HomCont) Technical report. [Google Scholar]
- 33.Sherman A., Rinzel J., Keizer J. Emergence of organized bursting in clusters of pancreatic β-cells by channel sharing. Biophys. J. 1988;54:411–425. doi: 10.1016/S0006-3495(88)82975-8. [DOI] [PMC free article] [PubMed] [Google Scholar]
- 34.Grodsky G. A threshold distribution hypothesis for packet storage of insulin and its mathematical modeling. J. Clin. Invest. 1972;51:2047–2059. doi: 10.1172/JCI107011. [DOI] [PMC free article] [PubMed] [Google Scholar]
- 35.Henquin J.-C. Triggering and amplifying pathways of regulation of insulin secretion by glucose. Diabetes. 2000;49:1751–1760. doi: 10.2337/diabetes.49.11.1751. [DOI] [PubMed] [Google Scholar]
- 36.Chen Y.D., Wang S., Sherman A. Identifying the targets of the amplifying pathway for insulin secretion in pancreatic β-cells by kinetic modeling of granule exocytosis. Biophys. J. 2008;95:2226–2241. doi: 10.1529/biophysj.107.124990. [DOI] [PMC free article] [PubMed] [Google Scholar]
- 37.Enkvetchakul D., Loussouarn G., Makhina E., Shyng S.L., Nichols C.G. The kinetic and physical basis of KATP channel gating: toward a unified molecular understanding. Biophys. J. 2000;78:2334–2348. doi: 10.1016/S0006-3495(00)76779-8. [DOI] [PMC free article] [PubMed] [Google Scholar]
- 38.Valdeolmillos M., Gomis A., Sanchez-Andres J.V. In vivo synchronous membrane potential oscillations in mouse pancreatic β-cells: lack of co-ordination between islets. J. Physiol. 1996;493:9–18. doi: 10.1113/jphysiol.1996.sp021361. [DOI] [PMC free article] [PubMed] [Google Scholar]
- 39.Cao D., Lin G., Westphale E., Beyer E., Steinberg T. Mechanisms for the coordination of intercellular calcium signaling in insulin-secreting cells. J. Cell Sci. 1997;110:497–504. doi: 10.1242/jcs.110.4.497. [DOI] [PubMed] [Google Scholar]
- 40.Quesada I., Fuentes E., Andreu E., Meda P., Nadal A. On-line analysis of gap junctions reveals more efficient electrical than dye coupling between islet cells. Am. J. Physiol. Endocrinol. Metab. 2003;284:E980–E987. doi: 10.1152/ajpendo.00473.2002. [DOI] [PubMed] [Google Scholar]
- 41.Ravier M.A., Guldenagel M., Charollais A., Gjinovci A., Caille D. Loss of Connexin36 channels alters β-cell coupling, islet synchronization of glucose-induced Ca2+ and insulin oscillations, and basal insulin release. Diabetes. 2005;54:1798–1807. doi: 10.2337/diabetes.54.6.1798. [DOI] [PubMed] [Google Scholar]
- 42.Charpantier E., Cancela J., Meda P. Beta-cells preferentially exchange cationic molecules via Connexin 36 gap-junction channels. Diabetologia. 2007;50:2332–2341. doi: 10.1007/s00125-007-0807-9. [DOI] [PubMed] [Google Scholar]
- 43.Harris A. Connexin channel permeability to cytoplasmic molecules. Prog. Biophys. Mol. Biol. 2007;94:120–143. doi: 10.1016/j.pbiomolbio.2007.03.011. [DOI] [PMC free article] [PubMed] [Google Scholar]
- 44.Serre-Beinier V., Bosco D., Zulianello L., Charollais A., Caille D. Cx36 makes channels coupling human pancreatic β-cells, and correlates with insulin expression. Hum. Mol. Genet. 2009;18:428–439. doi: 10.1093/hmg/ddn370. [DOI] [PMC free article] [PubMed] [Google Scholar]
- 45.Mears D., Sheppard N.F., Jr., Atwater I., Rojas E. Magnitude and modulation of pancreatic β-cell gap junction electrical conductance in situ. J. Membr. Biol. 1995;146:163–176. doi: 10.1007/BF00238006. [DOI] [PubMed] [Google Scholar]
- 46.Göpel S., Kanno T., Barg S., Galvanovskis J., Rorsman P. Voltage-gated and resting membrane currents recorded from β-cells in intact mouse pancreatic islets. J. Physiol. 1999;521:717–728. doi: 10.1111/j.1469-7793.1999.00717.x. [DOI] [PMC free article] [PubMed] [Google Scholar]
- 47.De Vries G., Sherman A., Zhu H.R. Diffusively coupled bursters: effects of cell heterogeneity. Bull. Math. Biol. 1998;60:1167–1200. doi: 10.1006/bulm.1998.0057. [DOI] [PubMed] [Google Scholar]
- 48.Fridlyand L.E., Tamarina N., Philipson L.H. Modeling of Ca2+ flux in pancreatic β-cells: role of the plasma membrane and intracellular stores. Am. J. Physiol. Endocrinol. Metab. 2003;285:E138–E154. doi: 10.1152/ajpendo.00194.2002. [DOI] [PubMed] [Google Scholar]
- 49.Fridlyand L.E., Ma L., Philipson L.H. Adenine nucleotide regulation in pancreatic β-cells: modeling of ATP/ADP-Ca2+ interactions. Am. J. Physiol. Endocrinol. Metab. 2005;289:E839–E848. doi: 10.1152/ajpendo.00595.2004. [DOI] [PubMed] [Google Scholar]
- 50.Diederichs F. Mathematical simulation of membrane processes and metabolic fluxes of the pancreatic β-cell. Bull. Math. Biol. 2006;68:1779–1818. doi: 10.1007/s11538-005-9053-9. [DOI] [PubMed] [Google Scholar]
- 51.Magnus G., Keizer J. Minimal model of mitochondrial Ca2+ handling. Am. J. Physiol. 1997;273:C717–C733. doi: 10.1152/ajpcell.1997.273.2.C717. [DOI] [PubMed] [Google Scholar]
- 52.Smith P.A., Ashcroft F.M., Rorsman P. Simultaneous recordings of glucose dependent electrical activity and ATP-regulated K+-currents in isolated mouse pancreatic β-cells. FEBS Lett. 1990;261:187–190. doi: 10.1016/0014-5793(90)80667-8. [DOI] [PubMed] [Google Scholar]
- 53.Kinard T.A., de Vries G., Sherman A., Satin L.S. Modulation of the bursting properties of single mouse pancreatic β-cells by artificial conductances. Biophys. J. 1999;76:1423–1435. doi: 10.1016/S0006-3495(99)77303-0. [DOI] [PMC free article] [PubMed] [Google Scholar]
- 54.Szollosi A., Nenquin M., Aguilar-Bryan L., Bryan J., Henquin J.-C. Glucose stimulates Ca2+ influx and insulin secretion in 2-week-old β-cells lacking ATP-sensitive K+ channels. J. Biol. Chem. 2007;282:1747–1756. doi: 10.1074/jbc.M609875200. [DOI] [PubMed] [Google Scholar]
- 55.Düfer M., Haspel D., Krippeit-Drews P., Aguilar-Bryan L., Bryan J. Oscillations of membrane potential and cytosolic Ca2+ concentration in SUR1−/−β-cells. Diabetologia. 2004;47:488–498. doi: 10.1007/s00125-004-1348-0. [DOI] [PubMed] [Google Scholar]
- 56.De Vries G., Sherman A. Channel sharing in pancreatic β-cells revisited: enhancement of emergent bursting by noise. J. Theor. Biol. 2000;207:513–530. doi: 10.1006/jtbi.2000.2193. [DOI] [PubMed] [Google Scholar]
- 57.Girard C.A., Wunderlich F.T., Shimomura K., Collins S., Kaizik S. Expression of an inactivating mutation in the gene encoding the KATP channel subunit Kir6.2 in mouse pancreatic β-cells recapitulates neonatal diabetes. J. Clin. Invest. 2009;119:80–90. doi: 10.1172/JCI35772. [DOI] [PMC free article] [PubMed] [Google Scholar]