

Abstract
Pentameric ligand-gated ion channels are an important family of membrane proteins and play key roles in physiological processes, including signal transduction at chemical synapses. Here, we study the conformational changes associated with the opening and closing of the channel pore. Based on recent crystal structures of two prokaryotic members of the family in open and closed states, respectively, mixed elastic network models are constructed for the transmembrane domain. To explore the conformational changes in the gating transition, a coarse-grained transition path is computed that smoothly connects the closed and open conformations of the channel. We find that the conformational transition involves no major rotations of the transmembrane helices, and is instead characterized by a concerted tilting of helices M2 and M3. In addition, helix M2 changes its bending state, which results in an early closure of the pore during the open-to-closed transition.
Introduction
Pentameric ligand-gated ion channels (1,2) (pLGICs) are a family of membrane proteins that open or close in response to ligand binding or pH change. They share a common structural scaffold of five subunits, each consisting of an extracellular ligand-binding domain (ECD) and a transmembrane channel domain (TMD). Some notable members of the family, such as the nicotinic acetylcholine receptor, play critical physiological roles in signal transduction at neuromuscular synapses, and are major targets for psychoactive drugs.
Despite significant progress in the structural investigation of pLGICs, the highest resolution structure of a complete eukaryotic pLGIC so far is at ∼4 Å, obtained by electron microscopy (3,4). In contrast, the structures of two prokaryotic pLGICs have recently been determined by x-ray crystal diffraction. The structures of ELIC (5) from bacterium Erwinia chrysanthemi and GLIC (6,7) from Gloeobacter violaceus have both been determined at high resolution by x-ray crystallography, and seem to represent closed and open conformations of the ion channel, respectively. Despite their only moderate sequence similarity, the two proteins have the same overall architecture, with close correspondence on the structural level (6,7), in particular within their TMDs.
The structures of ELIC (5) and GLIC (6,7) in the closed and open states thus provide an opportunity to study the gating transition of pLGICs at an atomic level. The structural changes associated with the opening and closing of ion channels have been studied extensively for a number of channels by a variety of experimental and theoretical methods (4,8–27). Elucidating the motions associated with the channel gating transition, and their coupling to ligand binding, is not only of fundamental interest, but may also aid in the design of ligands that interfere with channel activation in a controlled way.
Here, we explore the structural changes during the open-to-closed transition of the channel with the help of coarse-grained representations. Coarse-grained energy functions offer a powerful tool to study large-scale motions in proteins (28–31). In elastic network models (ENMs) (32–36), proteins are treated as deformable elastic bodies, permitting an almost analytical treatment. ENMs and normal mode analyses have been applied to study motions of the acetylcholine receptors (19,21), ELIC (22), and GLIC (7). However, the harmonic energy surfaces of ENMs may not fully capture large, inherently nonlinear conformational changes. Also, traditional ENMs involve only a single energy minimum, and therefore are not immediately applicable to studies of the transition between multiple states, such as the open and closed states of ion channels. To extend ENMs to proteins with multiple conformations, mixed elastic network models (MENMs) have been developed (37), among other methods (38–41). MENMs can be used to construct a transition path that smoothly connects two conformations of a protein. In this study, we develop an MENM of the conformational transition between the open and closed states of the ELIC and GLIC pentameric ion channels, focusing in particular on the transmembrane domain. By studying a transition path between the open and closed conformations, we can identify details of the possibly nonmonotonic motions and the sequence of events, which cannot be deduced from the static endpoint structures alone.
Methods
In this section, we will give a general introduction to the MENM method, and then describe the specific procedures of modeling the ELIC and GLIC systems using this method.
Mixed elastic network models
In an MENM of a protein, the harmonic energy surfaces of multiple ENMs are combined to construct an overall anharmonic surface with multiple minima corresponding to different metastable states (here “open” and “closed”). In an ENM, a protein is modeled as an elastic solid, described as beads connected by harmonic springs. Each Cα atom in the protein backbone is represented by a bead, and the protein coordinates are collectively represented by a vector in 3N dimensional space, where N is the number of Cα atoms in the protein. ENMs are constructed from a given native protein structure with coordinates . The energy function in an ENM is then given by
| (1) |
where dij is the Euclidian distance between Cα atoms i and j in structure , and is the corresponding distance in the reference structure . According to this definition, if the distance in the native protein structure is within a given cutoff distance RC, the pair i,j of Cα atoms is connected by a harmonic spring with force constant C and equilibrium length .
The energy function in Eq. 1 can be expanded to second order near the minimum :
| (2) |
where H is the Hessian matrix. This expression can be more easily analyzed by linear algebra, and is therefore adopted as the actual energy function here. Although in principle the second-order expansion is only accurate near the minimum , Eq. 2 has been used frequently in ENM and MENM studies of large-amplitude protein motions (32,37) to enable analytical treatments. By construction, Eq. 2 preserves the property that the energy minimum is located at with , as is the case for Eq. 1.
Now we consider a scenario in which a protein has two different conformations (such as open and closed), denoted by and , respectively. Two ENM energy functions can then be constructed for these conformations according to Eq. 2, with i = 1,2. In MENMs, a global energy function combines the two potentials (37) as
| (3) |
where β = 1/kBTm with kB being the Boltzmann constant. This energy function retains and as approximate local minima. The MENM energy function involves free parameters ɛ1 and ɛ2 for energy offsets, and Tm for the mixing temperature (37). The difference in energy offsets ɛ2 − ɛ1 can be considered an energetic driving force for the transition, with ɛ1 an arbitrary constant. Tm determines the height of the barrier between the two states. We note that the Boltzmann-weighted mixing of two structure-based energy surfaces in Eq. 3, introduced by Best et al. (28) for protein conformational changes, is related to the quantum-mechanical mixing in valence bond models, as introduced independently by Maragakis and Karplus (38) in their plastic network model (PNM). The main practical difference between the MENM and PNM approaches is that in the latter the anharmonic surfaces Eq. 1 are used.
Based on the energy function Eq. 3, several methods can be used to determine a transition path between the two conformations (37). In this study, we adopt the definition of a “parameter-independent” transition path (37), , defined as a function of a weighting parameter f ∈ [0,1] and independent of β, ɛ1, and ɛ2, as well as the particular mixing scheme (statistical-mechanical mixing (28), Eq. 3, or valence-bond mixing (38)). At each given f, is determined by
| (4) |
By construction, all minima and saddle points of the MENM energy surface Eq. 3 lie on the path . Moreover, this path is the trace of the saddle points of the energy function in Eq. 3 as the energetic driving force ɛ2 − ɛ1, provided here by ligand binding to the ECD, is varied from −∞ (favoring the open state) to +∞ (favoring the closed state) (37). This parameter-independent transition path has been shown to agree closely with the steepest descent and minimum free energy paths (37).
We note that the transition path defined in Eq. 4 coincides with the minimum of the weighted energy function obtained by linear interpolation,
| (5) |
with being a harmonic function. As f is varied from 0 to 1, gradually changes from to , and its minimum point traces the transition path between and .
System setup
The focus here is primarily on the structural changes in the TMD during the gating transition of the channel. We thus exclude the ECD in the MENM. Our MENM was constructed from the closed and open conformations of pLGICs as defined in the crystal structures of ELIC (Protein Data Bank (PDB) code 2VL0) (5) and GLIC (PDB code 3EHZ) (6), respectively. Despite the relatively small sequence identity, the sequence alignment between ELIC and GLIC is unambiguous in the core of the TMD formed by helices M1, M2, and M3 (see below), without the presence of any gap (5–7). We thus use the TMDs of ELIC and GLIC as reference structures in the MENM. In contrast, gaps are present in the sequence alignment of the two ECDs, which sense different signals (ligand binding in ELIC versus pH change in GLIC). Moreover, the ECDs from the two independently determined GLIC crystal structures (PDB codes 3EHZ and 3EAM) (6,7) in the open state are structurally less consistent than their TMDs, with a backbone Cα root mean-square deviation (RMSD) of ∼1.7 Å for the ECD and ∼0.5 Å for the TMD. In contrast, the conformational difference between the ECDs in the ELIC and GLIC structures is small compared to that between their TMDs (6). Nevertheless, we caution that the removal of the ECD may alter the collective motions of the protein, and the MENM with only the TMD may not fully capture the transition path of the intact channel. Therefore, we will later describe results for an ENM that incorporates the ECD, allowing us to study the coupling between the two domains.
The TMD of each of the five subunits in ELIC or GLIC is composed of four helices, denoted as M1–M4. The last helix, M4, is located at the periphery of the transmembrane pore and only loosely interacts with other helices (5). Moreover, sequence alignment between ELIC and GLIC shows gaps in the loop connecting M3 and M4, and this loop is also highly variable in a sequence comparison of prokaryotic and eukaryotic pLGICs. We therefore exclude the loop and M4 from our model. Consequently, unless explicitly noted otherwise, our system contains residues 200–283 in ELIC (PDB code 2VL0) (5) or equivalently 193–276 in GLIC (PDB code 3EHZ) (6), thus including 84 Cα atoms in each subunit or a total of 420 Cα atoms in the pentameric protein. These residues represent helices M1–M3 and the two connecting loops, defining the “common core” (7) of the TMD. A model with M4 also incorporated will be briefly discussed later.
In both ELIC and GLIC, the five subunits are identical in sequence and highly similar in the resolved crystal structures (5–7). In constructing the MENM, we enforced perfect fivefold symmetry on the Cα backbone of the TMD. First, the symmetry axis was identified by averaging the coordinates over each quintet of corresponding Cα atoms in the subunits and then fitting a line through the averaged points. Next, one of the subunits was set as reference, and the other four were each rotated by a multiple of 72° around the symmetry axis to overlap with the reference. Finally, the coordinates of the five overlapping subunits were averaged and then rotated back to reconstruct the pentamer. The resulting pentameric structure is guaranteed to assume a perfect fivefold symmetry. The RMSD between the symmetrized structure and the original one is 0.14 Å for ELIC (5) and 0.09 Å for GLIC (6). We note that even if the symmetry is present in both native conformations, in principle the transition path could still be asymmetric. For the α7 nicotinic receptor with its homo-pentameric composition, pronounced asymmetry in the apo state, in contrast to a more symmetric ligand-bound state, has been observed in molecular dynamics simulations (20). Both symmetric and asymmetric motions have also been identified among the dominant normal modes for the α7 receptor, depending on the adopted homology model and the degree of symmetry present in the model (21). Here, with the transition endpoints defined by the structures of ELIC and GLIC being symmetric, and under the assumption of a harmonic energy surface (Eq. 2) in the ENMs, all snapshots along the MENM transition path will have the same fivefold symmetry. Asymmetric transition paths with symmetric end conformations can only arise from anharmonic potentials.
An RMSD alignment was first carried out to superimpose the symmetrized structures of ELIC and GLIC. The coordinates of the two aligned structures were then taken as the beginning and end states, and , of the MENM. We consistently used a cutoff of RC = 9 Å, and also confirmed that using RC = 10 Å gives similar results (not shown). To trace the transition path between the open and closed configurations, the weighting parameter f was varied from 0 to 1 with a step size of 0.01, and for each f the coordinates were calculated by solving the linear equations given in Eq. 4. The symmetrization procedure described earlier ensures that , , H1, and H2 all exhibit a perfect fivefold symmetry, and consequently such symmetry is also present in each calculated . We note that although the energy function in Eq. 1 is invariant to rigid-body rotations, the approximate energy in Eq. 2 will change under finite rotations of . As a result, the calculated from Eq. 4 is in general not optimally aligned with the reference conformation at f = 0 or f = 1. A postprocessing step was therefore carried out to align each with the reference.
As f is varied from 0 to 1, the snapshots of each trace the transition path in the multidimensional configuration space. Whereas f is spaced evenly between 0 and 1, the snapshots of are not necessarily distributed evenly along the transition path. Therefore in some of the analyses we adopted a “progression parameter” instead of f to describe the advancement along the path. For a given snapshot on the path, the progression parameter is defined as the curve length between the initial state and the snapshot normalized by the total length of the path. In practice the curve length was approximately calculated by summing up the RMSDs between adjacent snapshots on the curve. The initial (open) and final (closed) states then correspond to progression parameters of 0 and 1, respectively. Moreover, the snapshot corresponding to a progression parameter of 0.5 is defined as the midpoint conformation, with equal curve lengths to the initial and final states.
Results
The conformations of the initial, final and midpoint states in the transition path are shown in Fig. 1, a and b. The ion-conducting pore is located at the symmetry axis of the pentamer. The radii of the pore along its axis were calculated for these three states, as shown in Fig. 1 c, using the program HOLE (42). The radius profiles were calculated based on the coordinates of the Cα atoms only, each being assigned an atomic radius of 3 Å. Nevertheless, the profiles for the closed and open conformations share similar trends with those obtained from all-atom models (5–7). In particular, the open and closed structures exhibit narrow constrictions near the intra- and extracellular entrances of the pore, respectively. However, the narrow region near the intracellular end is formed by polar and charged residues, and is believed not to prevent ion conduction (6,7). In contrast, the constriction region (indicated by the arrows in Fig. 1c) near the extracellular end is formed by bulky hydrophobic residues that may completely block the pore, and therefore is believed to be the actual gate of the channel. We note that the pore radii in the midpoint state (Fig. 1 c) of the transition closely match those in the closed state throughout the constriction region in the extracellular half of the pore, which suggests that the pore is closed halfway through the transition. The evolution of the pore radii during the transition is closely related to the orientation and the bending state of helix M2, as will be discussed later.
Figure 1.
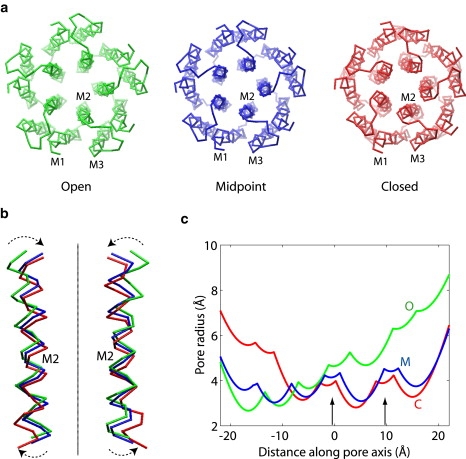
Comparison of the closed, open, and midpoint conformations in the transition path. (a) Top view from the extracellular side. The helices in one of the subunits are labeled. (b) Close-up view of two M2 helices with the extracellular side up. The line represents the symmetry axis (or the pore axis) of the protein. The arrows indicate the tilting motion of M2 during the open-to-closed transition. Molecular images were rendered in VMD (49). (c) Pore radius along its axis, calculated from the Cα coordinates using the program HOLE (42). The pore axis points from the intracellular side on the left to the extracellular side on the right. The two arrows indicate the hydrophobic region of the pore that serves as the gate for ion blockage.
Geometric characteristics of each transmembrane helix (defined in Table 1) were analyzed using the program TRAJELIX (43) in the Simulaid package. The axis of each helix was identified for each snapshot along the transition path. Fig. 2 shows the angles between the helix axes along the transition path and their initial (open) and final (closed) states, respectively. The orientations of helices M2 and M3 undergo a larger change (∼12°) in comparison to M1 (∼5°). Remarkably, the curves for M2 and M3 closely match each other, indicating that the axes of these two helices move in a highly concerted manner during the transition. The concerted motion of M2 and M3 is also shown by monitoring the angles formed by the two helix axes. As shown in Fig. 3, the angle between M2 and M3 remains relatively constant along the transition path, with a maximum variation of less than 1.7°. In contrast, the M1–M2 or M1–M3 angle varies by ∼8° during the transition. The above data thus agree with the proposed mechanism (6) that M2 and M3 move as a rigid body in the gating transition and that the movement of M1 is small compared with M2 and M3.
Table 1.
Residue numbers in ELIC (PDB code 2VL0) (5) and GLIC (PDB code 3EHZ) (6) for each transmembrane helix
| M1 | M2 | M3 | |
|---|---|---|---|
| ELIC | 201–219 | 227–250 | 260–282 |
| GLIC | 194–212 | 220–243 | 253–275 |
Figure 2.
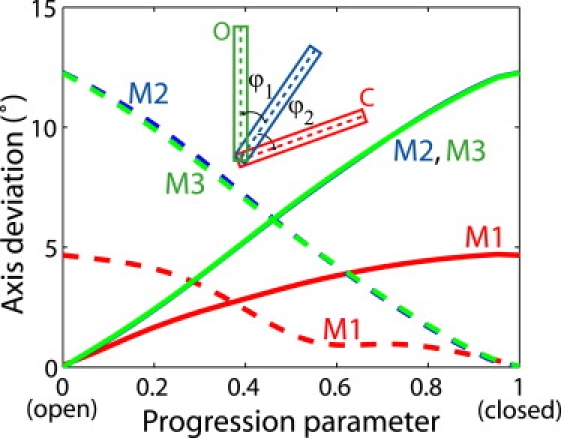
Orientation of the helices (M1, M2, and M3) relative to the open and closed structures. ϕ1 (solid lines) measures the angle of the helix axis along the transition path relative to the initial open state, and ϕ2 (dashed lines) relative to the closed state (see inset; note that the solid lines for M3 and M2 overlap with each other so that the latter becomes almost invisible.)
Figure 3.
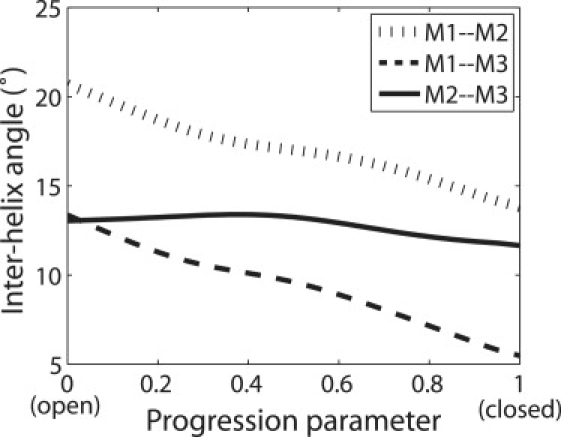
Interhelix angles during the transition. At each snapshot the helix axes for M1, M2, and M3 are identified, and the angles between M1–M2, M1–M3, and M2–M3 are calculated and plotted in the figure.
The rotation angles of each helix around its own axis during the transition were also calculated using TRAJELIX (43). The evolution of the helix rotation with respect to the open or closed conformation is shown in Fig. 4. We find that the curves are nonmonotonic, indicating that the direction of the rotation changes during the transition. Nevertheless, the magnitude of the rotation for each helix is less than ∼6°, which is small in comparison to the ∼100° separation in azimuth angle between adjacent Cα atoms in an α helix.
Figure 4.
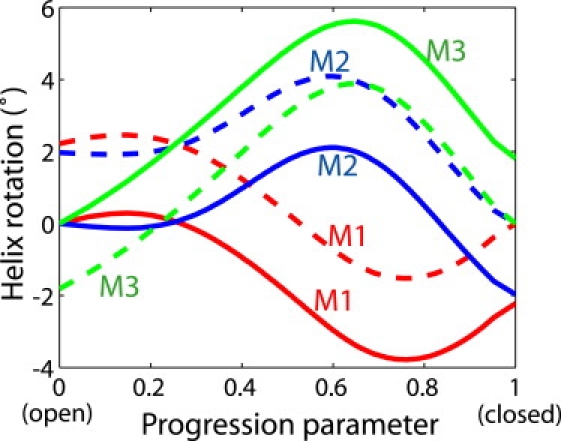
Rotation of each transmembrane helix (M1, M2, and M3) around its own axis during the transition. The rotation angles calculated with respect to the open and closed conformations are plotted as solid and dashed lines, respectively.
As mentioned in Methods, the last transmembrane helix, M4, in each subunit is not included in our model. To examine the possible effect of this exclusion, we built another MENM that incorporates M4 (residues 293–316 in ELIC or 288–311 in GLIC) (5,6) as well as M1–M3, but not the loop between M3 and M4 due to gaps in the sequence alignment. The new transition path (not shown) computed from this MENM is similar to the one with M4 excluded, confirming that M4 does not play major roles in the gating transition.
Because the energy function defined in Eq. 1 considers the locality of the residues only in space but not in sequence, one might be concerned whether the local geometry of the protein is preserved in the transition path. To investigate the issue, we built an MENM based on modified energy functions in which the spring constants between nearby Cα atoms (within four residues in sequence) in each helix are increased 10-fold. This sequence-dependent energy function is expected to enforce stronger constraints on the local geometry of the transmembrane helices. However, the transition path (not shown) calculated from the new MENM turns out to be very similar to the one described above, suggesting that no large deformation of the local helical structure occurs in either path, as is also confirmed by a visual inspection of the transition trajectory.
Despite the well preserved local geometry of the transmembrane helices, some moderate bending of the helices can be discerned in the transition trajectory. To quantify the degree of bending, we calculated the angle between the axes of the top and bottom halves of each helix. The bending angles of transmembrane helices M1–M3 along the transition path are shown in Fig. 5. Interestingly, along the transition from the open to the closed state, helix M2 first straightens (with decreasing bending angle) and then bends again (with increasing bending angle). By visual inspection of the path from the open to the closed state, we found that the conformational change in M2 proceeds in two steps. First, the extracellular half of the helix undergoes an inward movement toward the center of the pore, resulting in a straightening of the helix. Then, the intracellular half of M2 moves away from the center whereas the other half undergoes very little movement, thus re-introducing a kink in the closed conformation. Because M2 is the innermost transmembrane helix and forms the lumen of the ion-conducting pore, the bending in this helix has a nontrivial effect on the pore radius. Particularly, at the midpoint of the transition path, the extracellular half of M2 has already moved to its closed-state position whereas the intracellular half has remained near its open-state position (Fig. 1 b). The pore-radius distribution of the midpoint conformation thus matches that of the closed state in the top part of the pore, where the hydrophobic gate is located, and that of the open state in the bottom part (Fig. 1 c).
Figure 5.
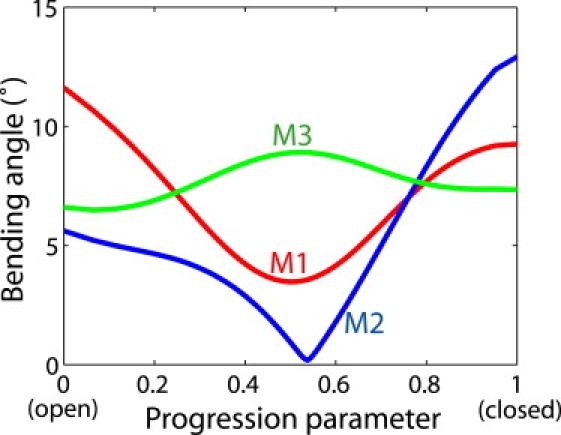
Bending angles for each helix (M1, M2, and M3) during the transition, defined as the angle between the axes of the top and bottom halves of the helix.
The MENMs described so far represent the transmembrane domain (TMD) of the protein only but not the extracellular domain (ECD), and therefore cannot reveal conformational changes in the ECD during the gating transition. As discussed in the Methods section, it is more challenging to incorporate the ECD in MENMs, due mainly to the poorer sequence similarity between ELIC and GLIC in that domain. However, single ENMs can be constructed for the entire ELIC or GLIC protein. These ENMs can then be used to explore the coupled motions of the ECD as the TMD undergoes the open-to-closed transition. Specifically, in the ENM, the Cα protein coordinates can be divided into and for the ECD and TMD, respectively. The Hessian matrix H can be similarly divided, and the energy function in Eq. 2 can be expressed as
| (6) |
When is fixed, the that minimizes the energy satisfies
| (7) |
Then for any given , the coordinates for the ECD can be determined from Eq. 7. In the following, we force the TMD coordinates to follow the transition path of the gating transition, and determine the ECD conformation that best adapts to the given TMD coordinates according to Eq. 7.
We constructed an ENM based on the GLIC crystal structure (6) and obtained a trajectory of the ECD that follows the given TMD transition path, as described above. As shown in Fig. 6 a, the most prominent change of the ECD in the open-to-closed transition is a clockwise rotation around the symmetry axis when viewed from the extracellular side, which represents a quaternary twist (7,19) between the ECD and TMD. As shown in Fig. 6 b, when the TMD is superimposed against the ELIC crystal structure, the RMSD for the ECD is decreasing during the open-to-closed transition, indicating an increasing resemblance to the closed ELIC conformation. However, such effect is due mainly to the rotation of the ECD described above, as the RMSD after superimposing the ECD does not change much. The largest internal conformational changes in the ECD occur in the interface region next to the TMD, characterized by inward movements of the ECD loops in that region, following similar motions of the adjacent helices and loops in the TMD. Such inward motions also result in a tilt of the ECD subunits that produces a small outward movement in the distal end of the ECD (Fig. 6 a, left). Analogously, we also constructed an ENM based on the ELIC crystal structure (5) and calculated a closed-to-open transition in ELIC, which exhibits similar motions (Fig. 6 a, right) including a counterclockwise twist of the ECD, an outward motion of the interface loops, and a minor tilt in the ECD with an even smaller magnitude. We note, however, that although the overall twisting motions between the ECD and TMD indeed appear plausible (7,19,22), the coupling between TMD and ECD motions warrants further examination with the help of atomically detailed models.
Figure 6.
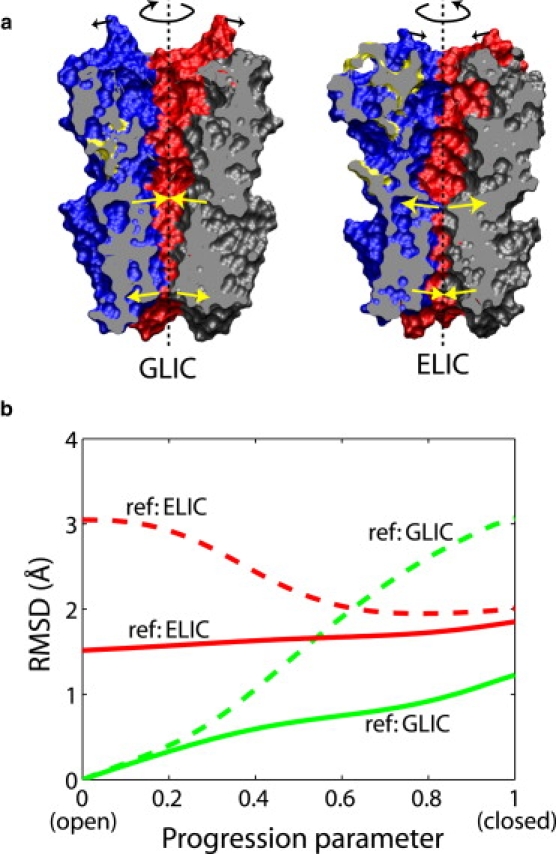
(a) Crystal structures of GLIC (6) and ELIC (5) in open and closed conformations, respectively, consisting of the extracellular domain (ECD, upper part) and the transmembrane domain (TMD, lower part). The TMDs of the two structures are aligned. Each subunit is drawn in a unique color. The proteins are cut through by a clipping plane that passes through the symmetry axis (dashed lines). The arrows indicate schematically the motions involved in the closing or opening transition, revealed by the ENM/MENM models explained in the text, including a twisting rotation of the entire ECD, a tilting motion of some helices in the TMD, and a minor tilt of the ECD subunits. Molecular images were rendered in VMD (49). (b) Analysis of the open-to-closed transition in GLIC. The RMSDs of the ECD between each snapshot in the transition path and the GLIC (6) or ELIC (5) crystal structure are plotted. The dashed lines show the RMSD values of the ECD when the TMD is superimposed against the crystal structure, and the solid lines represent the RMSDs after superimposing the ECD and thus eliminating the relative motion between the ECD and TMD. Residues constituting the common core (7) of the ECD are used for calculating the RMSD or superimposition with respect to the ELIC crystal structure.
Discussion
The gating mechanism of pLGICs has been studied extensively. Based on a medium-resolution structure of the acetylcholine receptor solved by electron microscopy (4), it was hypothesized that helix M2 would undergo a substantial rotation during the opening of the channel, thus moving some bulky side chains at the constriction region away from the center of the pore. However, this hypothesis was challenged by experiments using a novel single-channel proton-transfer technique (44,45), which suggested that no major rotation of the transmembrane helices is involved in the transition. The recent crystal structures (5–7) of prokaryotic pLGICs indeed did not suggest any significant rotation of the helices between the open and closed states. Here we find that helix rotation appears limited to less than ∼6°. In contrast, helices M2 and M3 undergo a more substantial tilting of the axes (Fig. 2), which has a major effect on the pore radii (Fig. 1 c) and thus determines the open/closed status of the channel.
In addition to the helix tilting, the bending (Fig. 5) of helix M2 also plays a role in the gating transition, resulting in a uniformly narrow pore at the midpoint of the transition (Fig. 1). Bending of helices has been identified as a major factor in the gating transition of potassium channels (16,46). Here, helix M2 is bent in both the open and closed states, but is found to straighten out at the transition midpoint. Such transient conformational changes can be probed, for instance, by nuclear magnetic resonance measurements (26,47), or in single-molecule studies (27). Moreover, structural and dynamic studies with bound ligands (48) that trap the intermediate state, or mutations that affect the packing and bending of the helices, may offer indirect experimental routes to probe the structural changes.
Electrophysiological recordings of single-channel currents provide information about the activation barrier and the rate of the transition between the two states, as well as structural aspects of the transition state. Purohit et al. (24) and Jha et al. (25) have reported Φ-values for the closed-to-open transition of the acetylcholine receptor (nAChR) for a number of residues in the M2 helix, obtained by measuring the effects of mutations on the equilibrium and rate of the closed-to-open transition. We have examined the structural changes along the transition path for the residues with the most extreme Φ-values. For residues (9′ and 12′ in ɛM2 of nAChR, or equivalently 239 and 242 in ELIC) with low Φ∼ 0.3 (25), we plotted their distances (not shown) to the nearby residues on other helices along the transition path, and found that most (but not all) of these distances change predominantly past the midpoint, as the open state is approached. This late change appears to be consistent with the low measured Φ-values. We have also examined some residues (7′, 10′, and 14′ in ɛM2 of nAChR, or 237, 240, and 244 in ELIC) at the other extreme, Φ∼ 0.6 (25). For these residues, the distance changes along the transition path exhibit mixed behavior, some occurring early and others late. Clearly, these results should not be overinterpreted. On the one hand, the proteins are different, and some Φ-values differ even between different subunits of the nAChR (24,25). On the other hand, the interpretation of Φ-values with a relatively narrow distribution around 0.5 is challenging, even on the basis of a transition path.
In this study, MENMs (37) were used to construct a transition path between two native conformations. Some features of the path, e.g., the sequential movement of the two halves of helix M2, are inherently nonlinear and thus cannot be studied easily by linear methods such as normal mode analysis based on a single ENM. Such details of the motions (e.g., the nonmonotonic bending of helix M2) and the sequence of events, as well as the cooperativity of the structural changes, also cannot be gleaned directly from a comparison of the native structures. Nevertheless, being based on a simple energy function at a coarse-grained (backbone) level and without an atomistic description of side chains, the transition path remains of an approximate nature. In particular, side-chain atoms directly interact with the substrates in the channel, and their motions are important to the function of the channel. Moreover, although some changes in the helix-helix interactions (e.g., the extracellular ends of M2 are in closer contact with adjacent subunits during the closing of the channel) can be seen in the coarse-grained transition path, a complete picture of the interhelical or protein-solvent interface must include the side chains. Further refinement and additional details of the conformational transition, in particular with regard to side-chain motions, may come from all-atom molecular dynamics simulations.
Acknowledgments
We thank Prof. R. Dutzler for sharing the coordinates of GLIC before publication.
This research was supported by the Intramural Research Program of the National Institute of Diabetes and Digestive and Kidney Diseases, National Institutes of Health.
References
- 1.Lester H.A., Dibas M.I., Dahan D.S., Leite J.F., Dougherty D.A. Cys-loop receptors: new twists and turns. Trends Neurosci. 2004;27:329–336. doi: 10.1016/j.tins.2004.04.002. [DOI] [PubMed] [Google Scholar]
- 2.Sine S.M., Engel A.G. Recent advances in Cys-loop receptor structure and function. Nature. 2006;440:448–455. doi: 10.1038/nature04708. [DOI] [PubMed] [Google Scholar]
- 3.Miyazawa A., Fujiyoshi Y., Unwin N. Structure and gating mechanism of the acetylcholine receptor pore. Nature. 2003;423:949–955. doi: 10.1038/nature01748. [DOI] [PubMed] [Google Scholar]
- 4.Unwin N. Refined structure of the nicotinic acetylcholine receptor at 4Å resolution. J. Mol. Biol. 2005;346:967–989. doi: 10.1016/j.jmb.2004.12.031. [DOI] [PubMed] [Google Scholar]
- 5.Hilf R.J., Dutzler R. X-ray structure of a prokaryotic pentameric ligand-gated ion channel. Nature. 2008;452:375–379. doi: 10.1038/nature06717. [DOI] [PubMed] [Google Scholar]
- 6.Hilf R.J., Dutzler R. Structure of a potentially open state of a proton-activated pentameric ligand-gated ion channel. Nature. 2009;457:115–118. doi: 10.1038/nature07461. [DOI] [PubMed] [Google Scholar]
- 7.Bocquet N., Nury H., Baaden M., Le Poupon C., Changeux J.P. X-ray structure of a pentameric ligand-gated ion channel in an apparently open conformation. Nature. 2009;457:111–114. doi: 10.1038/nature07462. [DOI] [PubMed] [Google Scholar]
- 8.Perozo E., Cortes D.M., Sompornpisut P., Kloda A., Martinac B. Open channel structure of MscL and the gating mechanism of mechanosensitive channels. Nature. 2002;418:942–948. doi: 10.1038/nature00992. [DOI] [PubMed] [Google Scholar]
- 9.Berneche S., Roux B. A gate in the selectivity filter of potassium channels. Structure. 2005;13:591–600. doi: 10.1016/j.str.2004.12.019. [DOI] [PubMed] [Google Scholar]
- 10.Miloshevsky G.V., Jordan P.C. Open-state conformation of the KcsA K+ channel: Monte Carlo normal mode following simulations. Structure. 2007;15:1654–1662. doi: 10.1016/j.str.2007.09.022. [DOI] [PubMed] [Google Scholar]
- 11.Gervasio F.L., Parrinello M., Ceccarelli M., Klein M.L. Exploring the gating mechanism in the ClC chloride channel via metadynamics. J. Mol. Biol. 2006;361:390–398. doi: 10.1016/j.jmb.2006.06.034. [DOI] [PubMed] [Google Scholar]
- 12.Tang Y., Cao G., Chen X., Yoo J., Yethiraj A. A finite element framework for studying the mechanical response of macromolecules: application to the gating of the mechanosensitive channel MscL. Biophys. J. 2006;91:1248–1263. doi: 10.1529/biophysj.106.085985. [DOI] [PMC free article] [PubMed] [Google Scholar]
- 13.Anishkin A., Sukharev S. Water dynamics and dewetting transitions in the small mechanosensitive channel MscS. Biophys. J. 2004;86:2883–2895. doi: 10.1016/S0006-3495(04)74340-4. [DOI] [PMC free article] [PubMed] [Google Scholar]
- 14.Vasquez V., Sotomayor M., Cordero-Morales J., Schulten K., Perozo E. A structural mechanism for MscS gating in lipid bilayers. Science. 2008;321:1210–1214. doi: 10.1126/science.1159674. [DOI] [PMC free article] [PubMed] [Google Scholar]
- 15.Kong Y., Shen Y., Warth T.E., Ma J. Conformational pathways in the gating of Escherichia coli mechanosensitive channel. Proc. Natl. Acad. Sci. USA. 2002;99:5999–6004. doi: 10.1073/pnas.092051099. [DOI] [PMC free article] [PubMed] [Google Scholar]
- 16.Tieleman D.P., Shrivastava I.H., Ulmschneider M.R., Sansom M.S. Proline-induced hinges in transmembrane helices: possible roles in ion channel gating. Proteins. 2001;44:63–72. doi: 10.1002/prot.1073. [DOI] [PubMed] [Google Scholar]
- 17.Gullingsrud J., Schulten K. Gating of MscL studied by steered molecular dynamics. Biophys. J. 2003;85:2087–2099. doi: 10.1016/s0006-3495(03)74637-2. [DOI] [PMC free article] [PubMed] [Google Scholar]
- 18.Jeon J., Voth G.A. Gating of the mechanosensitive channel protein MscL: the interplay of membrane and protein. Biophys. J. 2008;94:3497–3511. doi: 10.1529/biophysj.107.109850. [DOI] [PMC free article] [PubMed] [Google Scholar]
- 19.Taly A., Delarue M., Grutter T., Nilges M., Le Novere N. Normal mode analysis suggests a quaternary twist model for the nicotinic receptor gating mechanism. Biophys. J. 2005;88:3954–3965. doi: 10.1529/biophysj.104.050229. [DOI] [PMC free article] [PubMed] [Google Scholar]
- 20.Henchman R.H., Wang H.L., Sine S.M., Taylor P., McCammon J.A. Ligand-induced conformational change in the alpha7 nicotinic receptor ligand binding domain. Biophys. J. 2005;88:2564–2576. doi: 10.1529/biophysj.104.053934. [DOI] [PMC free article] [PubMed] [Google Scholar]
- 21.Cheng X., Lu B., Grant B., Law R.J., McCammon J.A. Channel opening motion of alpha7 nicotinic acetylcholine receptor as suggested by normal mode analysis. J. Mol. Biol. 2006;355:310–324. doi: 10.1016/j.jmb.2005.10.039. [DOI] [PubMed] [Google Scholar]
- 22.Cheng X., Ivanov I., Wang H., Sine S.M., McCammon J.A. Molecular-dynamics simulations of ELIC-a prokaryotic homologue of the nicotinic acetylcholine receptor. Biophys. J. 2009;96:4502–4513. doi: 10.1016/j.bpj.2009.03.018. [DOI] [PMC free article] [PubMed] [Google Scholar]
- 23.Yi M., Tjong H., Zhou H.X. Spontaneous conformational change and toxin binding in alpha7 acetylcholine receptor: insight into channel activation and inhibition. Proc. Natl. Acad. Sci. USA. 2008;105:8280–8285. doi: 10.1073/pnas.0710530105. [DOI] [PMC free article] [PubMed] [Google Scholar]
- 24.Purohit P., Mitra A., Auerbach A. A stepwise mechanism for acetylcholine receptor channel gating. Nature. 2007;446:930–933. doi: 10.1038/nature05721. [DOI] [PubMed] [Google Scholar]
- 25.Jha A., Purohit P., Auerbach A. Energy and structure of the M2 helix in acetylcholine receptor-channel gating. Biophys. J. 2009;96:4075–4084. doi: 10.1016/j.bpj.2009.02.030. [DOI] [PMC free article] [PubMed] [Google Scholar]
- 26.Baker K.A., Tzitzilonis C., Kwiatkowski W., Choe S., Riek R. Conformational dynamics of the KcsA potassium channel governs gating properties. Nat. Struct. Mol. Biol. 2007;14:1089–1095. doi: 10.1038/nsmb1311. [DOI] [PMC free article] [PubMed] [Google Scholar]
- 27.Shimizu H., Iwamoto M., Konno T., Nihei A., Sasaki Y.C. Global twisting motion of single molecular KcsA potassium channel upon gating. Cell. 2008;132:67–78. doi: 10.1016/j.cell.2007.11.040. [DOI] [PubMed] [Google Scholar]
- 28.Best R.B., Chen Y.G., Hummer G. Slow protein conformational dynamics from multiple experimental structures: the helix/sheet transition of arc repressor. Structure. 2005;13:1755–1763. doi: 10.1016/j.str.2005.08.009. [DOI] [PubMed] [Google Scholar]
- 29.Levy Y., Cho S.S., Shen T., Onuchic J.N., Wolynes P.G. Symmetry and frustration in protein energy landscapes: a near degeneracy resolves the Rop dimer-folding mystery. Proc. Natl. Acad. Sci. USA. 2005;102:2373–2378. doi: 10.1073/pnas.0409572102. [DOI] [PMC free article] [PubMed] [Google Scholar]
- 30.Zuckerman D.M. Simulation of an ensemble of conformational transitions in a united-residue model of calmodulin. J. Phys. Chem. B. 2004;108:5127–5137. [Google Scholar]
- 31.Koga N., Takada S. Roles of native topology and chain-length scaling in protein folding: a simulation study with a Go-like model. J. Mol. Biol. 2001;313:171–180. doi: 10.1006/jmbi.2001.5037. [DOI] [PubMed] [Google Scholar]
- 32.Tirion M.M. Large amplitude elastic motions in proteins from a single-parameter, atomic analysis. Phys. Rev. Lett. 1996;77:1905–1908. doi: 10.1103/PhysRevLett.77.1905. [DOI] [PubMed] [Google Scholar]
- 33.Song G., Jernigan R.L. An enhanced elastic network model to represent the motions of domain-swapped proteins. Proteins. 2006;63:197–209. doi: 10.1002/prot.20836. [DOI] [PubMed] [Google Scholar]
- 34.Atilgan A.R., Durell S.R., Jernigan R.L., Demirel M.C., Keskin O. Anisotropy of fluctuation dynamics of proteins with an elastic network model. Biophys. J. 2001;80:505–515. doi: 10.1016/S0006-3495(01)76033-X. [DOI] [PMC free article] [PubMed] [Google Scholar]
- 35.Tama F., Valle M., Frank J., Brooks C.L., 3rd Dynamic reorganization of the functionally active ribosome explored by normal mode analysis and cryo-electron microscopy. Proc. Natl. Acad. Sci. USA. 2003;100:9319–9323. doi: 10.1073/pnas.1632476100. [DOI] [PMC free article] [PubMed] [Google Scholar]
- 36.Zheng W., Brooks B.R., Thirumalai D. Low-frequency normal modes that describe allosteric transitions in biological nanomachines are robust to sequence variations. Proc. Natl. Acad. Sci. USA. 2006;103:7664–7669. doi: 10.1073/pnas.0510426103. [DOI] [PMC free article] [PubMed] [Google Scholar]
- 37.Zheng W., Brooks B.R., Hummer G. Protein conformational transitions explored by mixed elastic network models. Proteins. 2007;69:43–57. doi: 10.1002/prot.21465. [DOI] [PubMed] [Google Scholar]
- 38.Maragakis P., Karplus M. Large amplitude conformational change in proteins explored with a plastic network model: adenylate kinase. J. Mol. Biol. 2005;352:807–822. doi: 10.1016/j.jmb.2005.07.031. [DOI] [PubMed] [Google Scholar]
- 39.Miyashita O., Onuchic J.N., Wolynes P.G. Nonlinear elasticity, proteinquakes, and the energy landscapes of functional transitions in proteins. Proc. Natl. Acad. Sci. USA. 2003;100:12570–12575. doi: 10.1073/pnas.2135471100. [DOI] [PMC free article] [PubMed] [Google Scholar]
- 40.Chu J.W., Voth G.A. Coarse-grained free energy functions for studying protein conformational changes: a double-well network model. Biophys. J. 2007;93:3860–3871. doi: 10.1529/biophysj.107.112060. [DOI] [PMC free article] [PubMed] [Google Scholar]
- 41.Franklin J., Koehl P., Doniach S., Delarue M. MinActionPath: maximum likelihood trajectory for large-scale structural transitions in a coarse-grained locally harmonic energy landscape. Nucleic Acids Res. 2007;35:477–482. doi: 10.1093/nar/gkm342. [DOI] [PMC free article] [PubMed] [Google Scholar]
- 42.Smart O.S., Neduvelil J.G., Wang X., Wallace B.A., Sansom M.S. HOLE: a program for the analysis of the pore dimensions of ion channel structural models. J. Mol. Graph. 1996;14:354–360. doi: 10.1016/s0263-7855(97)00009-x. 376. [DOI] [PubMed] [Google Scholar]
- 43.Mezei M., Filizola M. TRAJELIX: a computational tool for the geometric characterization of protein helices during molecular dynamics simulations. J. Comput. Aided Mol. Des. 2006;20:97–107. doi: 10.1007/s10822-006-9039-1. [DOI] [PubMed] [Google Scholar]
- 44.Cymes G.D., Ni Y., Grosman C. Probing ion-channel pores one proton at a time. Nature. 2005;438:975–980. doi: 10.1038/nature04293. [DOI] [PMC free article] [PubMed] [Google Scholar]
- 45.Cymes G.D., Grosman C. Pore-opening mechanism of the nicotinic acetylcholine receptor evinced by proton transfer. Nat. Struct. Mol. Biol. 2008;15:389–396. doi: 10.1038/nsmb.1407. [DOI] [PMC free article] [PubMed] [Google Scholar]
- 46.Jiang Y., Lee A., Chen J., Cadene M., Chait B.T. The open pore conformation of potassium channels. Nature. 2002;417:523–526. doi: 10.1038/417523a. [DOI] [PubMed] [Google Scholar]
- 47.Chill J.H., Louis J.M., Miller C., Bax A. NMR study of the tetrameric KcsA potassium channel in detergent micelles. Protein Sci. 2006;15:684–698. doi: 10.1110/ps.051954706. [DOI] [PMC free article] [PubMed] [Google Scholar]
- 48.Lange A., Giller K., Hornig S., Martin-Eauclaire M.F., Pongs O. Toxin-induced conformational changes in a potassium channel revealed by solid-state NMR. Nature. 2006;440:959–962. doi: 10.1038/nature04649. [DOI] [PubMed] [Google Scholar]
- 49.Humphrey W., Dalke A., Schulten K. VMD: visual molecular dynamics. J. Mol. Graph. 1996;14:37–38. doi: 10.1016/0263-7855(96)00018-5. [DOI] [PubMed] [Google Scholar]