

Abstract
We study hydrated model membranes, consisting of stacked bilayers of 1,2-dioleoyl-sn-glycero-3-phosphocholine lipids, using terahertz time-domain spectroscopy and infrared spectroscopy. Terahertz spectroscopy enables the investigation of water dynamics, owing to its sensitivity to dielectric relaxation processes associated with water reorientation. By controlling the number of water molecules per lipid molecule in the system, we elucidate how the interplay between the model membrane and water molecules results in different water dynamics. For decreasing hydration levels, we observe the appearance of new types of water dynamics: the collective bulklike dynamics become less pronounced, whereas an increased amount of both very slowly reorienting (i.e., irrotational) and very rapidly reorienting (i.e., fast) water molecules appear. Temperature-dependent measurements reveal the interconversion between the three distinct types of water present in the system.
Introduction
Insights into membrane hydration, i.e., the interplay between water and membrane molecules, is essential for a complete understanding of biological cell functioning. Biological membranes constitute the barrier between the inside and the outside of the cell. The principal building blocks of membranes are lipids: amphiphilic molecules that spontaneously self-assemble into bilayers when in contact with water. The details of the resulting membrane, such as the curvature of the bilayer, its mechanical properties, the lipid density in the bilayer, and the thermodynamics of the self-assembly process, depend intimately on the hydration of the hydrophilic lipid headgroups. Membrane lipids form the principal structural building block of membrane bilayers; the many biochemical tasks performed at these interfaces (e.g., the controlled transfer of ions or nutrients across the membrane barrier) are performed by membrane proteins that span the membrane. The correct functioning of these trans-membrane proteins, in turn, has often been shown to depend critically on their interaction with water and their lipid neighbors (1). Such interactions are greatly influenced by the details of the hydrogen-bonding capabilities of lipid headgroups: for example, replacing a hydrogen atom by a (hydrophobic) methyl group can influence local water density and network strength in a way that is sufficient to render neighboring transmembrane proteins inactive (2). Furthermore, hydration of membranes is closely related to the fluidity of the membrane, which, in turn, is of fundamental importance for phenomena like membrane fusion or drug transport (3).
A complete molecular picture of biomembrane structure and structural changes associated with membrane action therefore requires knowledge of how lipids and proteins interact with water. On the one hand, as alluded to above, we expect specific interactions to account for the function of particular membrane-bound proteins. As a result, the particulars of protein and lipid structural chemistry will be important. On the other hand, because the number of functional groups found both in lipids and in proteins is limited, it seems reasonable that general insights can be gained by studying carefully chosen model systems. This notion has prompted the study of various well-defined model systems of lipid monolayers deposited on an aqueous subphase (4) and lipid bilayer stacks with varying degree of hydration.
The structural complexity and dynamics of water interacting with membranes has been studied using various spectroscopic tools. Much information has been obtained by using techniques such as nuclear-magnetic resonance (NMR) (5) or (time-resolved) mid-infrared spectroscopy (6–8). NMR experiments have provided insights into the orientational order within the water-shell around lipid headgroups and have helped in clarifying the different rates of lateral and normal translational diffusion of water at lipid-water interfaces (5). Femtosecond time-resolved pump-probe midinfrared spectroscopy (fs-IR) has an improved time resolution, in principle allowing one to access dynamical processes such as changes in hydration, which have been predicted to occur on (sub-)picosecond timescales (6–9).
Recently, terahertz (THz) spectroscopy has emerged as a powerful tool for investigating biomolecular systems and their interaction with water (10–14). For instance, THz absorption studies in the 2–3 THz region on protein hydration have provided detailed information about the spatial extent, the nature, and dynamics of the aqueous hydration shell of proteins (12,13). The strength of THz spectroscopy to study the structure and dynamics of water lies in the fact that the dielectric response in the THz region directly reflects the reorientation of water dipoles occurring on picosecond timescales. This same effect also gives rise to strong absorption of THz radiation by aqueous systems, limiting the THz penetration depth to ∼100 μm. Here, we apply dielectric relaxation spectroscopy in the THz domain to the study of hydration in membrane-models composed of stacks of 1,2-dioleoyl-sn-glycero-3-phosphocholine (DOPC) lipid bilayers to investigate the influence of membrane confinement on the water reorientation dynamics. DOPC has been chosen since it is an unsaturated lipid generally used as a component of model membranes mimicking real ones (15). We have studied the THz dielectric relaxation of these membranes by varying their level of hydration and by changing the ambient temperature, to investigate the possible heterogeneity of water within the DOPC membranes.
Materials and Methods
Sample
The experiments were performed on membrane models made of stacked 1,2-dioleoyl-sn-glycero-3-phosphocholine (DOPC) bilayers. DOPC was purchased from Avanti Polar Lipids (Alabaster, AL). Solutions of DOPC in pure chloroform were prepared at a concentration of ∼15 g/L. Drops of these solutions were deposited on a fused quartz window, with the chloroform allowed to evaporate. It is known that in this way stacks of lipid bilayers are formed by self-assembly (15). Samples with a thickness of a few hundred micrometers were readily realized by successive depositions. These samples were then inserted in a sample holder of our design, where the thickness of the sample chamber was variable. The sealed cell was first exposed to a dry nitrogen flow to dehydrate the lipid and was subsequently put in contact with a reservoir at controlled humidity. This allowed us to control the degree of hydration from x ≈ 4 water molecules/lipid molecule to x ≈ 11 water molecules/lipid molecule. Our cell is equipped with Peltier modules to control the temperature. The temperature could be varied between −20°C and 150°C.
Measurement techniques
Spectra in the frequency range 0.3–1.2 THz were measured by means of a spectrometer based on THz time-domain spectroscopy. A broad bandwidth single-cycle THz pulse (∼1 ps) is generated by optical rectification in ZnTe of a 130-fs laser pulse, centered at a wavelength of 800 nm. The field strength (rather than intensity) of the THz pulse transmitted through the sample is measured in the time domain by means of electro-optic sampling using a small part of the 130-fs pulse for probing at suitable time-delay the quasi-instantaneous THz field strength inside the electro-optic crystal. Details of this technique can be found in Schmuttenmaer (16). In addition, for each sample, a linear mid-infrared spectrum between 2000 and 4000 cm−1 has been recorded using a standard double-beam spectrometer.
Data extraction
In the THz time-domain spectroscopy experiments, the presence of the sample leads to a reduction of the THz pulse amplitude (absorption) and to a temporal shift of the THz pulse (refraction). These two quantities can be determined for all the spectral components contained in the THz pulse and can be directly related to the frequency-dependent complex refractive index, , of the hydrated membrane. Here, ν represents the frequency, n is the refractive index and k is the extinction coefficient, which is related to the absorption coefficient by α = k × 4πν/c. In principle, a comparison of the Fourier transforms of the THz temporal traces with and without the sample provides the frequency-dependent refractive index . However, the extraction of the complex dielectric function of the sample is complicated by the fact that the sample is contained within a sample cell with windows that also affect the THz wave. In this case, the complex refractive index is more reliably extracted by isolating the sample response from the window response through measurements at varying sample thickness d (17). With this approach, the reference is the sample itself and the contribution of the cell is directly taken into account. In Fig. 1 A, we show typical examples of the time-dependent THz field E(t) transmitted through a fully hydrated DOPC sample as a function of sample thickness. The time-domain data is converted to the frequency domain to obtain the frequency-dependent complex refractive index, using:
| (1) |
| (2) |
Figure 1.
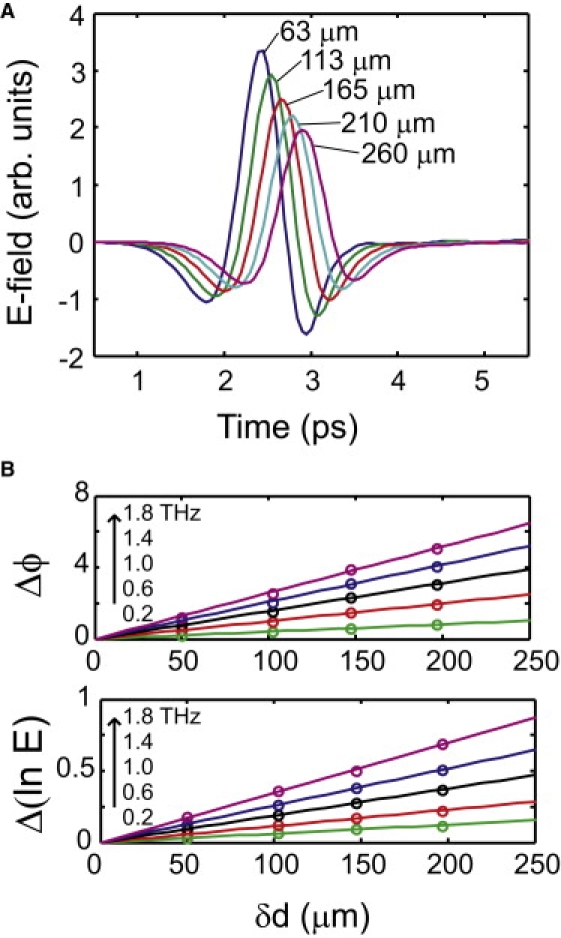
(A) THz field strength as a function of time after transmission of the THz pulses through a sample of hydrated lipid bilayers with varying sample thickness. (B) The change in the logarithm of the electric field Δ ln E and the change in the phase Δϕ as a function of change in sample thickness δd, as extracted from THz pulses through samples with varying thickness. From these results, the frequency-dependent complex dielectric function is extracted.
In Eqs. 1 and 2, we calculate the frequency-dependent real and imaginary part of the refractive index, respectively. Here, we use the Fourier transform of the electric field E(ν) = F{E(t)} and the phase of the THz pulse ϕ(ν). Furthermore, δd is the change in thickness between two subsequent measurements and c is the speed of light in vacuum. As is apparent from Eqs. 1 and 2, the phase change Δϕ(ν) and the change in the natural logarithm of the electric field Δ ln E(ν) depend linearly on δd for a given frequency. Therefore, at each frequency, a linear model can be used for describing the experimental results to extract n and k, as shown in Fig. 1 B, for some selected frequencies. From the complex refractive index, the complex dielectric function can easily be obtained, because , where we follow the convention of discussing studies of aqueous samples in terms of changes in the complex dielectric response. We will use the variable-thickness method of extracting for samples of hydrated DOPC lipid bilayers with varying hydration levels at various temperatures.
Analysis
In the frequency region that we study (0.3–1.2 THz), the main process that is active is dielectric relaxation. The dielectric relaxation response of water contains information on how well the permanent dipoles associated with water molecules can keep up with oscillating fields of a certain frequency. An electric field applied to water molecules will tend to align the permanent dipoles associated with the water molecules, resulting in an induced polarization
where ɛ0 is the vacuum permittivity. If the electric field is oscillating, the water molecules reorient to align their dipole moments with the driving field. However, if the driving frequency becomes larger than the reorientation frequency of water molecules, alignment becomes increasingly difficult and the induced polarization, and thereby ɛ, drops. Hence, the frequency dependence of the dielectric response contains information about the reorientation dynamics of water molecules.
At driving frequencies that exceed the reorientation frequency of water, the driving field can be resonant with infrared active modes that do not involve dielectric relaxation. In pure water, one such mode appears at ∼5.4 THz (180 cm−1), which is attributed to hydrogen-bond stretching (18,19). Furthermore, a (very weak) low frequency mode is located at ∼1.8 THz (60 cm−1) and is attributed to hydrogen-bond bending (19–21). We therefore restrict our analysis to frequencies up to 1.2 THz, to ensure that our data only include contributions from dielectric relaxation.
For pure water at room temperature, dielectric relaxation can be described with the well-known double Debye relaxation model (18–24):
| (3) |
Here, the first (main) term represents the dielectric relaxation process with strength S1 = ɛS – ɛ1 ≈ 75 and a time constant of τD ≈ 8 ps (the Debye time) for bulk water at room temperature. The Debye time describes the cooperative reorganization of hydrogen-bonded water molecules, which occurs through a jump mechanism that involves the breaking and reformation of hydrogen bonds (25). The second term has a strength S2 = ɛ1 – ɛ∞ and a (shorter) timescale τ2. For bulk water at room temperature, S2 is appreciably smaller than S1: S2/(S1 + S2) ≈ 0.023. The fast component in the dielectric relaxation of pure water is usually attributed to rotation or translation of water molecules that are not involved in hydrogen bonding or involved in fewer hydrogen bonds (18,23). We shall refer to water molecules that exhibit dielectric relaxation with timescale τ2 as “fast” water molecules. Finally, ɛ∞ represents the dielectric constant in the high frequency limit and ɛS is the dielectric constant in the low frequency limit.
In the case of a mixed system of hydrated DOPC lipid bilayers, the dielectric response is significantly modified from the bulk response. First of all, the response will consist of a contribution due to DOPC and a contribution due to water. The dielectric response of pure DOPC has an absorption peak in the MHz region that is associated with headgroup rotation, as a result of the dipole moment of the headgroup that contains a negatively charged phosphate group and a positively charged choline group (15). We verified that the response of pure DOPC in the GHz-THz region is low and dispersionless; it can therefore be incorporated into the parameter ɛ∞. Secondly, due to a volumetric lowering of the water content, the dielectric relaxation strengths due to water reorientation S1 and S2 will decrease. Finally, it has been established that for stacked bilayer systems of DOPC and 1,2-dimyristoyl-sn-glycero-3-phosphocholine (DMPC), a resonance occurs below 1 GHz that has been ascribed to water molecules that are so strongly bound that their reorientation rate is reduced by orders of magnitude (15). These water molecules could have slower dynamics due to interaction with local electric fields or due to clathrate formation. Here, we will refer to these water molecules as being “irrotational”: they are invisible to THz spectroscopy, as they cannot reorient on timescales that correspond to the THz spectral window. The presence of these molecules will lead to a further lowering of the values of S1 and S2. This can be understood from the schematic shown in Fig. 2: irrotationally bound water molecules with much slower reorientation dynamics have a response that is shifted out of the THz window. The presence and quantity of bound water molecules can be determined from combining the THz measurements with independent mid-IR linear absorption spectroscopy, which we use to independently quantify the overall O–H bond density.
Figure 2.

The real (ɛ′) and imaginary (ɛ″) part of the dielectric function for a system with three relaxation resonances: irrotational water, bulk water, and the fast water component. The dotted box indicates our measurement window.
In our analysis, we will use Eq. 3 to determine the amount of bulklike water (resonance at 1/2πτD) and the amount of fast water (resonance at 1/2πτ2). These amounts are reflected in the values of the relaxation strengths S1 and S2. Because the resonance due to irrotational (resonance < 1 GHz) water is outside our THz window, we do not need to add a third relaxation process—which would appear as an additional term in Eq. 3—to account for the irrotational water. Instead, we infer the amount of irrotational water by subtracting the amount of bulklike and fast water from the total amount of water obtained from infrared spectroscopy. Thus, we are able to quantify the relative amounts of three types of water in this system: bulklike, fast, and irrotational. The first two are directly from the THz spectra, and the last one is from a comparison of the THz spectra with the IR spectra. In our analysis, the presence of irrotational water will be reflected in a decrease of the parameter ɛS: ɛS∗ becomes ɛS (see Fig. 2). Despite the fact that the resonance of bulklike water (∼18 GHz at room temperature) lies outside our experimental window (0.3–1.2 THz), it still contributes significantly to our signal (especially to the imaginary part of ɛ). To restrict the number of free parameters, we fix τD to its value for bulk water. This means that we assume the presence of water molecules whose reorientation dynamics are similar to the dynamics in bulk water. The assumption that the reorientation time of part of the membrane-bound water corresponds to that of bulk water is justified by:
-
1.
The observation of a significant fraction of bulklike water in fs-IR measurements (6); and
-
2.
By microwave measurements of hydrated DOPC lipid membranes, where a dielectric relaxation resonance is found at the same location as in the case of bulk water (at 20 GHz for 25°C) (26).
Our extraction procedure exists of two steps: First, we fit our results for to Eq. 3. This yields the parameters S1 and S2, from which we know the amount of bulklike and fast water in the system. Second, we extract the amount of irrotational water using these parameters and the total amount of water in the system, as determined from our linear infrared spectra. We use the following relation to calculate the number of irrotational water molecules NI (27):
| (4) |
In this equation, is the concentration of solvent water molecules in the solution determined from mid-IR linear absorption experiments, c0 represents the concentration of water molecules of pure water (55 mol/L), and clipid is the concentration of lipid molecules. S1 and S2 are the relaxation strengths of the bulklike and fast water in our system, respectively, and S1, bulk and S2, bulk correspond to the relaxation strengths of pure water.
Results
Linear infrared spectra
First, we measure the linear infrared absorption spectra of our samples to determine the number of water molecules per lipid molecule, x = [H2O]/[lipid]. This is done by comparing the amount of absorption in the CH-stretch region, a measure for the number of lipid molecules, with the absorption of the OH-stretch vibration of water molecules. The procedure for extracting x is calibrated by recording linear spectra of a dehydrated DOPC sample and adding known amounts of water to the sample. The data for a number of different hydration levels are shown in Fig. 3 A. These spectra are normalized to the peak of the OH-stretch vibration at ∼3400 cm−1. The results are summarized in Table 1.
Figure 3.

(A) The linear spectra of lipid bilayers with different hydration levels. These spectra are normalized to their absorption of the OH stretch vibration and, hence, indicate the amount of lipid in the system with respect to water. (B) In the OH stretch region, a clear red-shift of the center frequency can be observed upon decreasing the hydration level, which corresponds to the stronger hydrogen bonds between water and the phosphate group. In addition, a small peak can be seen on the blue side of the spectrum, which corresponds to weaker hydrogen-bonded or free water molecules.
Table 1.
Sample characterization
| Relative humidity | x (water/lipid) | % wt | (mol/L) | clipid (mol/L) |
|---|---|---|---|---|
| 0% | 0.3 | 0.69 | 0.49 | 1.64 |
| 47% | 3.8 | 8.7 | 5.7 | 1.49 |
| 67% | 5.5 | 12.6 | 7.8 | 1.42 |
| 83% | 6.5 | 14.9 | 9.0 | 1.39 |
| 93% | 8.4 | 19.2 | 11.1 | 1.32 |
The values that we find for x are in excellent agreement with previous results using x-ray diffraction (28). The values for and clipid are calculated from x, using the molecular weight of water and DOPC (18 and 786 g/mol, respectively) and the density of water and DOPC (1000 and 1300 g/L, respectively). These concentrations will be used for later analysis (see Discussion). We also show in more detail the region of the OH-stretch vibration for the different samples (see Fig. 3 B). Clearly, the OH-stretch vibration shifts to lower frequencies upon the binding of water to the lipids, indicating the presence of water molecules that exhibit stronger hydrogen bonding. However, for lower hydration levels, an additional peak is visible at higher frequencies. This peak originates from water molecules that are involved in relatively weak hydrogen bonding.
Varying the hydration level
In Fig. 4 we show the measured dielectric responses of five different samples at relative humidities of 0, 47, 67, 83, and 93%, corresponding to a water fraction of x = 0.3, 3.8, 5.5, 6.5, and 8.4. It is apparent that the dielectric response is largely dispersionless for the pure lipid, and that an increase in the water density results in an increase in the dielectric response. These data can be described very well using Eq. 3, with τD fixed to its bulk water value. The imaginary part of the dielectric response clearly shows the onset of a resonance at a lower frequency. This resonance cannot belong to the DOPC headgroup reorientation or the irrotational water, since these modes are invisible in our THz window. Therefore, the resonance is very likely to correspond to the relaxation process with time constant τD ≈ 8 ps, i.e., reorientation of hydrogen-bonded water molecules. A similar onset can be observed in the THz region for samples of pure water (18–24). The observation of the onset of this resonance indicates that indeed our system contains water molecules that have reorientation dynamics that are similar to bulk water molecules.
Figure 4.

The real (ɛ′) and imaginary (ɛ″) part of the dielectric response of hydrated bilayers with different relative humidities. The lines are fits to the data, as explained in the text.
The retrieved model parameters are summarized in Table 2. It can be seen that the parameters S1 and S2 increase with increasing water content, as expected. The values for τ2 are a factor-of-3 lower for lipid-bound water compared to the bulk. Fig. 5 shows the fractions of irrotational, bulklike, and fast water as a function of lipid hydration. The number of irrotational water molecules has been extracted for each sample using Eq. 4. Clearly, a significant portion of the water molecules does not behave as bulk water, but is involved in much slower reorientational dynamics. The ratio S2/(S1 + S2) reflects the relative amount of fast water, compared to bulk water. This ratio is significantly larger for hydrated lipid bilayers than for bulk water. Especially in the case of DOPC with very low hydration, fast water seems to be important, amounting to 20% of all water.
Table 2.
Fit parameters
| Relative humidity | x | S1 | S2 | τ2 (fs) | % Irrotational | % Bulk | % Fast |
|---|---|---|---|---|---|---|---|
| 0% | 0.3 | 0.16 | 0.12 | 110 | 57 | 25 | 18 |
| 47% | 3.8 | 3.9 | 0.53 | 89 | 41 | 52 | 7 |
| 67% | 5.5 | 4.3 | 0.67 | 78 | 52 | 43 | 6 |
| 83% | 6.5 | 7.8 | 0.69 | 82 | 29 | 66 | 6 |
| 93% | 8.4 | 8.8 | 0.89 | 121 | 34 | 60 | 6 |
| Pure H2O [18] | ∞ | 74.9 | 1.8 | 250 | — | 97.7 | 2.3 |
Figure 5.

The fraction of irrotational water NI/x, bulk water, and the fraction of fast water as a function of water concentration. The lines are mono-exponential guides to the eye. Differently shaded areas indicate the relative importance of the three contributions at different hydration levels.
Varying the temperature
We have performed temperature-dependent measurements on DOPC lipid membranes with a number of different hydration levels. For these samples, we find the same qualitative trends in the fit parameters as the data presented before: the presence of irrotational water and an increased amount of fast water. For a relative hydration level of 58%, we show the temperature dependence of the dielectric response in Fig. 6. Other samples with different hydration levels yielded qualitatively similar temperature-dependent results. The data in Fig. 6 have been fit to Eq. 3 with the parameter τD fixed to its bulk water value for different temperatures, taken from Rønne and Keiding (20). We can use Eq. 3, because it is known from MHz dielectric relaxation measurements that the reorientation time of irrotational water will not become small enough to give a significant contribution to the dielectric response in our frequency window (15).
Figure 6.

The real (ɛ′) and imaginary (ɛ″) part of the dielectric response of hydrated bilayers with different temperature, from 5°C (blue) to 80°C (yellow), for 58% RH. The lines are fits to the data, as explained in the text.
We show the temperature dependence of the parameter S1 for the case of pure water (from (29)) and for the bulklike component of the hydrated DOPC lipid membranes in Fig. 7 A. In Fig. 7 B, the parameters S2 and τ2 are shown as a function of temperature for our system and for the case of pure water (from (18)). The line through the data points that we measured for τ2 is the same fit that was used for pure water (18), scaled by a factor 3.
Figure 7.

(A) The temperature dependence of the bulk water parameter S1 for the case of pure water (solid line, from (29)) and the case of bulklike water molecules in our model membranes (data points and line). (B) The temperature dependence of the fast water parameters τ2 and S2 for the case of bulk water (solid line, from (18)) and for our system (data points and line).
Discussion
The main observation is that in hydrated lipid bilayers a change in the water dynamics occurs: upon decreasing the hydration level, the amount of water obviously decreases. However, there is 1), an increased relative amount of irrotational water; and 2), an increased relative amount of fast water, as compared to bulk water. We will discuss these observations in the following.
Irrotational water
The presence of irrotational water is clear from the reduced values of S1, which are lower than one would expect, based only on the volumetric lowering of the water content. This means that there are water molecules that have a reorientation time that is significantly longer than the reorientation time of bulk water. We have found that the relative number of irrotational water molecules increases for decreasing hydration (see Table 2 and Fig. 5). The presence of irrotational water molecules is also consistent with the observation that the OH-stretch frequency shifts to lower frequencies. This shift indicates that strong hydrogen bonds are formed, which would result in slower reorientation.
The presence of (irrotational) water in the phosphocholine headgroup region of lipids such as DOPC and DMPC has been previously experimentally observed by MHz dielectric relaxation (15), NMR (30), electrical conductivity (31), x-ray and neutron diffraction and scattering (32–34), and fs-IR (6–8) measurements. Most experimental techniques cannot determine accurately to which lipid groups the water molecules are bound. In Zhao et al. (6), it is proposed that the irrotational water consists of water molecules surrounding the phosphate group of the phosphocholine headgroup (6) of DMPC, since a slowing down of the anisotropy decay (a measure that is directly related to the reorientation time) is observed. However, similar fs-IR measurements by Rezus and Bakker have shown that the presence of methyl groups near water molecules results in a much slower decay of the anisotropy (35). This means that the slowing-down of the anisotropy decay in Zhao et al. (6) could, in fact, also indicate irrotational water near the choline group of the model membranes, since this group contains three methyl groups. Unfortunately, our measurements are unable to distinguish whether irrotational water is located around the phosphate or the choline group region. We do observe that, depending on the hydration level, only 1–4 water molecules per lipid molecule exhibit a slowing down of their reorientational dynamics.
The temperature-dependent dielectric functions show an increase in the imaginary part of the dielectric function for increasing temperatures (see Fig. 6). Since we are not directly sensitive to the irrotational water in our frequency window, this increased dielectric response indicates that the fraction of bulklike water increases. Indeed, the temperature dependence of the parameter S1, shown in Fig. 7 A, is remarkably different for the case of pure water compared to the case of hydrated DOPC lipid bilayers: in pure water, the molecules exhibit a decrease in relaxation strength at elevated temperatures, but for membrane-bound water, a small increase is observed. This clearly indicates that upon increasing the temperature, a conversion takes place from irrotational water to bulklike water.
Fast water
We observe a substantially larger fraction of fast water molecules for hydrated DOPC lipid bilayers, compared to bulk water (see Fig. 5). This observation indicates the increased presence of water molecules with very weak or even absent hydrogen bonds in our hydrated bilayers. This interpretation is corroborated by the observation of a clear blue shoulder in the linear infrared spectra in the OH-stretch region (see Fig. 3). Furthermore, it is in agreement with fs-IR measurements of DMPC lipid bilayers that were hydrated using D2O with a low water-lipid ratio (x = 0.5–2) (7). In these measurements, it was observed that the anisotropy decay for strongly blue-shifted OD-stretch frequencies includes a large ultrafast (<150 fs) component. This is likely to be associated with rapidly orienting weakly bonded or free OD bonds. Finally, two-dimensional infrared spectroscopy of hydrated 1-palmitoyl-2-linoleyl phosphatidylcholine has shown that ∼50% of the water molecules form only one hydrogen bond (8), compared to the coordination number of ∼4 in bulk water. These singly hydrogen-bonded water molecules can contribute significantly to dielectric relaxation.
The temperature-dependent measurements show that the fast reorientation timescale τ2 and the relaxation strength S2 change only slightly as a function of temperature (see Fig. 7 B). A similar small effect was observed by recent broadband THz measurements on bulk water (18). This agreement is a strong indication that the fast process in bulk water is similar to the fast process that we probe in our measurements of hydrated DOPC lipid bilayers. However, the fast timescale that we find in this system is three times faster than in the case of bulk water. This increased reorientation rate could be caused by a lower average number of hydrogen bonds in the system, where perhaps a larger amount of singly hydrogen-bonded or free water molecules is present, leaving one or two dangling OH bonds that are free to rotate.
The binding location of these rapidly reorienting OH dipoles is not trivial. In Zhao et al. (6), the water molecules with a blue-shifted OH-stretch vibration are attributed to water molecules in the hydrophobic hydrocarbon region. However, it seems unlikely that water molecules would reside in this energetically less favorable region, especially in the case of very weak hydration. The largest relative amount of fast water was observed in the DOPC bilayers with hydration at 0% relative humidity, where x < 1. It is most likely that the few water molecules that are present in this system would be bound to the phosphate, the choline, or the carbonyl group (36). However, these water molecules might be involved in only one hydrogen bond. The water molecule will then have one very slowly reorienting OH group (the one involved in strong hydrogen bonding) and one rapidly reorienting OH group (the one that is not involved in hydrogen bonding). Since our dielectric relaxation measurements are sensitive to fluctuations of the permanent dipole moment of a water molecule, a single-hydrogen-bonded water molecule will show a fast reorientation component. When the hydration level is increased, water molecules can start forming hydrogen bonds with other water molecules, resulting in an increase in the fraction of slowly reorienting water. This indicates that upon increasing the hydration level, water molecules develop their collective dynamical nature. However, even at high hydration levels, a significant fraction of free or semifree water molecules persists in our system.
Conclusion
In conclusion, we have performed terahertz time-domain spectroscopy on hydrated lipid bilayers with different hydration levels. We find three distinct types of water molecules in this system:
-
1.
water molecules reorienting as water molecules in bulk,
-
2.
water molecules that have a significantly slower reorientation time than bulklike water molecules, and
-
3.
water molecules that are present in very sparse regions of the system, where only a few hydrogen-bond partners are present. These waters are only partly hydrogen-bonded and can exhibit very fast reorientation in a restricted direction (leaving their one or two existing hydrogen bonds intact).
The two latter types of water molecules become more important when the hydration level is decreased. This is the result of the disruption of the hydrogen bond network. By changing the hydration level through variation of the relative humidity from very low (RH ∼0%) to relatively high (RH ∼93%), we observe how water molecules develop their collective dynamical nature. Finally, we have shown that a temperature increase also results in the conversion of irrotational water to water exhibiting bulklike behavior. The identification and characterization of water molecules that are irrotational and water molecules with very fast dynamics could have great implications for the properties of transport of material through membranes and for functioning of transmembrane proteins. Specifically, for proton transport, it has been demonstrated that reorientation of water is a key step in the transfer of protons. The change in aqueous reorientation dynamics near lipid membranes is therefore expected to contribute to the increase of in-plane proton mobility that has been observed at membranes (37,38).
Acknowledgments
The authors thank I. Cerjak and E. Prins for technical support and R. L. A. Timmer for useful discussions.
This work is part of the research program of the “Stichting voor Fundamenteel Onderzoek der Materie (FOM)”, which is financially supported by the “Nederlandse organisatie voor Wetenschappelijk Onderzoek (NWO)”. D.P. thanks the European Commission for support with a Marie Curie grant (Project No. TERASPIN 039223).
Contributor Information
K.J. Tielrooij, Email: tielrooij@amolf.nl.
D. Paparo, Email: paparo@na.infn.it.
References
- 1.Lee A.G. How lipids affect the activities of integral membrane proteins. Biochim. Biophys. Acta. 2004;1666:62–87. doi: 10.1016/j.bbamem.2004.05.012. [DOI] [PubMed] [Google Scholar]
- 2.Hakizimana P., Masureel M., Gbaguidi B., Ruysschaert J.M., Govaerts C. Interactions between phosphatidylethanolamine headgroup and LmrP, a multidrug transporter. J. Biol. Chem. 2008;283:9369–9376. doi: 10.1074/jbc.M708427200. [DOI] [PubMed] [Google Scholar]
- 3.Bursing H., Kundu S., Vohringer P. Solvation dynamics at aqueous lipid-membrane interfaces explored by temperature-dependent 3-pulse-echo peak shifts: influence of the lipid polymorphism. J. Chem. Phys. B. 2003;107:2404–2414. [Google Scholar]
- 4.Kaganer V.M., Mohwald H., Dutta P. Structure and phase transitions in Langmuir monolayers. Rev. Mod. Phys. 1999;71:779–819. [Google Scholar]
- 5.Wassall S.R. Pulsed field-gradient-spin echo NMR studies of water diffusion in a phospholipid model membrane. Biophys. J. 1996;71:2724–2732. doi: 10.1016/S0006-3495(96)79463-8. [DOI] [PMC free article] [PubMed] [Google Scholar]
- 6.Zhao W., Moilanen D.E., Fenn E.E., Fayer M.D. Water at the surfaces of aligned phospholipid multibilayer model membranes probed with ultrafast vibrational spectroscopy. J. Am. Chem. Soc. 2008;130:13927–13937. doi: 10.1021/ja803252y. [DOI] [PMC free article] [PubMed] [Google Scholar]
- 7.Volkov V.V., Palmer D.J., Righini R. Heterogeneity of water at the phospholipid membrane interface. J. Phys. Chem. B. 2007;111:1377–1383. doi: 10.1021/jp065886t. [DOI] [PubMed] [Google Scholar]
- 8.Volkov V.V., Palmer D.J., Righini R. Distinct water species confined at the interface of a phospholipid membrane. Phys. Rev. Lett. 2007;99:078302. doi: 10.1103/PhysRevLett.99.078302. [DOI] [PubMed] [Google Scholar]
- 9.Russo D., Hura G., Head-Gordon T. Hydration dynamics near a model protein surface. Biophys. J. 2004;86:1852–1862. doi: 10.1016/S0006-3495(04)74252-6. [DOI] [PMC free article] [PubMed] [Google Scholar]
- 10.Knab J., Chen J.Y., Markelz A. Hydration dependence of conformational dielectric relaxation of lysozyme. Biophys. J. 2006;90:2576–2581. doi: 10.1529/biophysj.105.069088. [DOI] [PMC free article] [PubMed] [Google Scholar]
- 11.Balu R., Zhang H., Zukowski E., Chen J.-Y., Markelz A.G. Terahertz spectroscopy of bacteriorhodopsin and rhodopsin: similarities and differences. Biophys. J. 2008;94:3217–3226. doi: 10.1529/biophysj.107.105163. [DOI] [PMC free article] [PubMed] [Google Scholar]
- 12.Heugen U., Schwaab G., Brundermann E., Heyden M., Yu X. Solute-induced retardation of water dynamics probed directly by terahertz spectroscopy. Proc. Natl. Acad. Sci. USA. 2006;103:12301–12306. doi: 10.1073/pnas.0604897103. [DOI] [PMC free article] [PubMed] [Google Scholar]
- 13.Ebbinghaus S., Kim S.J., Heyden M., Yu X., Heigen U. An extended dynamical hydration shell around proteins. Proc. Natl. Acad. Sci. USA. 2007;104:20749–20752. doi: 10.1073/pnas.0709207104. [DOI] [PMC free article] [PubMed] [Google Scholar]
- 14.He Y., Ku P.I., Knab J.R., Chen J.Y., Markelz A. Protein dynamical transition does not require protein structure. Phys. Rev. Lett. 2008;101:178103. doi: 10.1103/PhysRevLett.101.178103. [DOI] [PubMed] [Google Scholar]
- 15.Klösgen B., Reichle C., Kohlsmann S., Kramer K.D. Dielectric spectroscopy as a sensor of membrane headgroup mobility and hydration. Biophys. J. 1996;71:3251–3260. doi: 10.1016/S0006-3495(96)79518-8. [DOI] [PMC free article] [PubMed] [Google Scholar]
- 16.Schmuttenmaer C.A. Exploring dynamics in the far-infrared with terahertz spectroscopy. Chem. Rev. 2004;104:1759–1779. doi: 10.1021/cr020685g. [DOI] [PubMed] [Google Scholar]
- 17.Koeberg M., Wu C.-C., Kim D., Bonn M. THz dielectric relaxation of ionic liquid: water mixtures. Chem. Phys. Lett. 2007;439:60–64. [Google Scholar]
- 18.Yada H., Nagai M., Tanaka K. Origin of the fast relaxation component of water and heavy water revealed by terahertz time-domain attenuated total reflection spectroscopy. Chem. Phys. Lett. 2008;464:166–170. [Google Scholar]
- 19.Fukasawa T. Relation between dielectric and low-frequency Raman spectra of hydrogen-bond liquids. Phys. Rev. Lett. 2005;95:197802. doi: 10.1103/PhysRevLett.95.197802. [DOI] [PubMed] [Google Scholar]
- 20.Rønne C., Keiding S.R. Low frequency spectroscopy of liquid water using THz-time domain spectroscopy. J. Mol. Liq. 2002;101:199–218. [Google Scholar]
- 21.Yu B.L., Yang Y., Zeng F., Xin X., Alfano R.R. Reorientation of the H2O cage studied by terahertz time-domain spectroscopy. Appl. Phys. Lett. 2005;86:061912. [Google Scholar]
- 22.Kindt J.T., Schmuttenmaer C.A. Far-infrared dielectric properties of polar liquids probed by femtosecond terahertz pulse spectroscopy. J. Chem. Phys. 1996;100:10373–10379. [Google Scholar]
- 23.Rønne C., Thrane L., Åstrand P.-O., Wallqvist A., Mikkelsen K.V. Investigation of the temperature dependence of dielectric relaxation in liquid water by THz reflection spectroscopy and molecular dynamics simulation. J. Chem. Phys. 1997;107:5319–5331. [Google Scholar]
- 24.Rønne C., Åstrand P.O., Keiding S.R. THz spectroscopy of liquid H2O and D2O. Phys. Rev. Lett. 1999;82:2888–2891. [Google Scholar]
- 25.Laage D., Hynes J.T. A molecular jump mechanism of water reorientation. Science. 2006;311:832–835. doi: 10.1126/science.1122154. [DOI] [PubMed] [Google Scholar]
- 26.Kurylowicz, M. 2003. Gigahertz spectroscopy on hydrated polyunsaturated phospholipid membranes. MSc thesis. University of British Columbia, Vancouver, Canada.
- 27.Hayashi Y., Katsumoto Y., Omori S., Kishii N., Yasuda A. Liquid structure of the urea-water system studied by dielectric spectroscopy. J. Phys. Chem. B. 2007;111:1076–1080. doi: 10.1021/jp065291y. [DOI] [PubMed] [Google Scholar]
- 28.Hristova K., White S.H. Determination of the hydrocarbon core structure of fluid dioleoylphosphocholine (DOPC) bilayers by x-ray diffraction using specific bromination of the double-bonds: Effect of hydration. Biophys. J. 1998;74:2419–2433. doi: 10.1016/S0006-3495(98)77950-0. [DOI] [PMC free article] [PubMed] [Google Scholar]
- 29.Buchner R., Barthel J., Stauber J. The dielectric relaxation of water between 0°C and 35°C. Chem. Phys. Lett. 1999;306:57–63. [Google Scholar]
- 30.Hsieh C.-J., Wu W.-G. Structure and dynamics of primary hydration shell of phosphatidylcholine bilayers at subzero temperatures. Biophys. J. 1996;71:3278–3287. doi: 10.1016/S0006-3495(96)79520-6. [DOI] [PMC free article] [PubMed] [Google Scholar]
- 31.Jendrasiak G.L., Smith R.L. The interaction of water with the phospholipid head group and its relationship to the lipid electrical conductivity. Chem. Phys. Lipids. 2004;131:183–195. doi: 10.1016/j.chemphyslip.2004.05.003. [DOI] [PubMed] [Google Scholar]
- 32.Wiener M.C., White S.H. Structure of a fluid dioleoylphosphatidylcholine bilayer determined by joint refinement of x-ray and neutron-diffraction data. Biophys. J. 1992;61:434–447. doi: 10.1016/S0006-3495(92)81849-0. [DOI] [PMC free article] [PubMed] [Google Scholar]
- 33.Caracciolo G., Pozzi D., Caminiti R. Hydration effect on the structure of dioleoylphosphatidylcholine bilayers. Appl. Phys. Lett. 2007;90:183901. [Google Scholar]
- 34.Kučerka N., Nagle J.F., Sachs J.N., Feller S.E., Pencer J. Lipid bilayer structure determined by the simultaneous analysis of neutron and x-ray scattering data. Biophys. J. 2008;95:2356–2367. doi: 10.1529/biophysj.108.132662. [DOI] [PMC free article] [PubMed] [Google Scholar]
- 35.Rezus Y.L.A., Bakker H.J. Observation of immobilized water molecules around hydrophobic groups. Phys. Rev. Lett. 2007;99:148301. doi: 10.1103/PhysRevLett.99.148301. [DOI] [PubMed] [Google Scholar]
- 36.Rosso L., Gould I.R. Structure and dynamics of phospholipid bilayers using recently developed general all-atom force fields. J. Comput. Chem. 2008;29:24–37. doi: 10.1002/jcc.20675. [DOI] [PubMed] [Google Scholar]
- 37.Gabriel B., Teissie J. Proton long-range migration along protein monolayers and its consequences on membrane coupling. Proc. Natl. Acad. Sci. USA. 1996;93:14521–14525. doi: 10.1073/pnas.93.25.14521. [DOI] [PMC free article] [PubMed] [Google Scholar]
- 38.Mulkidjanian A.Y., Heberle J., Cherepanov D.A. Protons at interfaces: implications for biological energy conversion. Biochim. Biophys. Acta. 2006;1757:913–930. doi: 10.1016/j.bbabio.2006.02.015. [DOI] [PubMed] [Google Scholar]