


Abstract
The S-adenosylmethionine-1 (SAM-I) riboswitch mediates expression of proteins involved in sulfur metabolism via formation of alternative conformations in response to binding by SAM. Models for kinetic trapping of the RNA in the bound conformation require annealing of nonadjacent mRNA segments during a transcriptional pause. The entropic cost required to bring nonadjacent segments together should slow the folding process. To address this paradox, we performed molecular dynamics simulations on the SAM-I riboswitch aptamer domain with and without SAM, starting with the X-ray coordinates of the SAM-bound RNA. Individual trajectories are 200 ns, among the longest reported for an RNA of this size. We applied principle component analysis (PCA) to explore the global dynamics differences between these two trajectories. We observed a conformational switch between a stacked and nonstacked state of a nonadjacent dinucleotide in the presence of SAM. In the absence of SAM the coordination between a bound magnesium ion and the phosphate of A9, one of the nucleotides involved in the dinucleotide stack, is destabilized. An electrostatic potential map reveals a ‘hot spot’ at the Mg binding site in the presence of SAM. These results suggest that SAM binding helps to position J1/2 in a manner that is favorable for P1 helix formation.
INTRODUCTION
Most folded, functional RNAs require conformational flexibility to perform their biological role (1). Often, RNA folding occurs as a response to specific signals, such as the binding of a protein, small molecule ligand or metal ion (2). A riboswitch is an autonomous cis-regulatory element that can control gene expression by sensing levels of small molecule metabolites, such as amino acids, nucleotides, or enzyme cofactors (3,4). Riboswitches are widely distributed in genomic sequences (5,6). They have been proposed as RNA targets for novel small molecule drugs (7). Riboswitches contain an aptamer domain that can bind to the effector ligand with high specificity (8–10). The mechanism of riboswitch function involves formation of alternative secondary structures in the presence and absence of the metabolite ligand (8,9). It is not clear how these interactions between small molecules and RNAs are coupled to the RNA secondary structures.
The S-adenosylmethionine-1 (SAM-I) riboswitch appears in the 5′ untranslated region (5′-UTR) of the messenger RNA (mRNA) of a number of bacteria. It modulates expression of genes involved in the biosynthesis of methionine, cysteine, SAM and other sulfur-containing metabolites in response to the concentration of SAM in vivo (11–14). Genetic and biochemical studies (11–13,15) propose the following model for the regulatory mechanism of SAM-I riboswitches (Figure 1a). In the absence of SAM, the SAM-I riboswitch forms the anti-terminator (AT), which prevents formation of the terminator (T) that is required for ρ-independent transcription attenuation. Binding by SAM triggers formation of the anti-anti-terminator (AAT) that occupies the 5′ strand of the AT. Under these conditions, the formation of the T facilitates transcription termination, turning off the expression of a set of downstream genes that are involved in sulfur-related metabolic pathways. An important question raised by this model is how SAM binding facilitates AAT formation.
Figure 1.

(a) Schematic of the regulatory mechanism of the SAM-I riboswitch. This model has been previously described (11–13,15). In the presence of SAM, pairing of nonadjacent regions (highlighted in blue) forms the P1 helix of the anti-anti-terminator (AAT) structure, which prevents formation of the anti-terminator (AT). Under these conditions, the ρ-independent terminator (T) hairpin can form to achieve transcriptional attenuation. (b) Three-dimensional crystallographic structure of the SAM-I riboswitch from T. tencongensis (35). A close-up is shown of the SAM binding pocket, highlighting the positions of two of the residues that are observed to contact the RNA. (c) Secondary structure representation of tertiary interactions observed in the crystallographic [Residues in red are involved in formation of the SAM binding pocket. The direction of the arrow is from 5′ to 3′. The base pairs are automatically identified using RNAVIEW (60). The structural motifs are annotated as ref. (61)].
Studies of other riboswitches (16,17) have pointed toward the importance of kinetic factors in determining ligand binding and riboswitch conformations. It has been proposed that SAM binds to the AAT and fixes the conformation before the polymerase can complete the synthesis of AT and T forming segments of the 5′-UTR mRNA (18,19). However, the formation of the AAT requires base pairing between two distal mRNA segments to form the P1 helix. This process requires the RNA to overcome an entropic barrier, which is expected to slow the folding process (20). The barrier may be overcome if the polymerase pauses long enough to allow folding before completing synthesis of the AT-forming segments. The model of kinetic control is strengthened further if ligand binding can accelerate the folding of the aptamer domain, as has been suggested for purine-binding riboswitches (17,21).
Molecular dynamics (MD) simulations have been used to address similar mechanistic questions in protein dynamics (22,23). These methods have limitations due to the large number of degrees of freedom, computational demands and the difficulties of preparing accurate force fields (24,25). Distinct characteristics of nucleic acids further complicate the application to RNA: the highly negatively charged backbone, the complicated role of the ionic environment and distinctive hierarchical folding mechanisms (26–29). Nonetheless, it is widely accepted that simulation protocols for RNA systems are mature enough to provide physical insights regarding atomistic details (26,27,29–31). For example, when applied carefully simulations have produced valuable insights, cross-validated by experimental data, regarding ionic and electrostatic interactions (32), ribozyme folding and catalysis (33) and ligand–RNA interactions (34) for RNAs up to the ∼25 kDa range.
In this manuscript, we report long timescale (200 ns) MD simulations of the SAM-1 riboswitch aptamer based upon the crystal structure in the AAT conformation from Thermoanaerobacter tengcongensis in complex with SAM (35). This is one of the longest simulations to date of an RNA of this size (32.2 kDa) (36). We repeated the simulation with SAM absent. Principal components analysis (PCA) of the covariance matrix for the atomic coordinates based upon each trajectory has been performed. In the presence of SAM the MD trajectory preserves critical contact distances between the RNA and SAM, as well as with a bound magnesium ion. Many of these contacts involve tight interactions with the J1/2 junction connecting the 5′ end of the RNA with the P2 helix. When the ligand is removed, contacts between the magnesium and the phosphate backbone of J1/2 are destabilized. Intriguingly, we observe a nonadjacent dinucleotide stack, which, though not present in the T. tencongensis X-ray coordinates, has appeared in a more recent SAM-I riboswitch from another organism. Altogether, our findings suggest a hypothesis for how SAM binding can accelerate and/or stabilize AAT formation by constraining the position of J12, thus reducing the entropic barrier for the annealing of the P1 helix.
METHODS
The aptamer domain of T. tengcongensis SAM-I riboswitch and its complex with SAM has been submitted to MD simulation for 200 ns using an explicit water solvent model. The 2.9-Å crystal structure of SAM bound to the aptamer domain of SAM-I riboswitch (35) is used as the starting point. The simulations with SAM are designated as SAM_TRAJ, while the simulations without ligand are denoted as WOSAM_TRAJ. A second simulation was carried out with identical protocols and length as SAM_TRAJ. Some analysis plots for the second trajectory with SAM are included in the Supplementary Data. From this point on, we discuss only SAM_TRAJ and WoSAM_TRAJ, concentrating on those aspects of SAM_TRAJ that were preserved in the trajectory of the second simulation with SAM present (unless otherwise noted).
MD simulation
The starting structure is the crystal structure of SAM binding to the aptamer domain of the SAM-I riboswitch in the AAT conformation (35) (PDB ID: 2GIS). In WOSAM_TRAJ, SAM is directly removed from the X-ray crystal structure and replaced with solvent water. Water and two magnesium ions in the crystal structure are kept. All the simulations are performed using NAMD 2.6 (37) with amber99bsc0 correction force field (25). Parameters for SAM are from the Generalized Amber Force Field (GAFF) (38) and missing parameters are calculated using ANTECHAMBER (39) using the AM1-bcc model (40). The starting structures are prepared using the LEaP module in AMBER (41). The RNA molecules are solvated in a cubic solvent box of TIP3P waters (42) with a 16-Å padding in all directions. Sodium ions are placed in the most negative position around RNA in order to neutralize charges of the system. Energy minimizations are carried out to remove bad contacts. Starting from 0 K, the temperature is raised 10 K for every 10 000 steps and is held constant after reaching the desired temperature (300 K) using temperature reassignment. Harmonic constraints were applied on the RNA and gradually removed over the equilibration steps using scale from 1.0 to 0 with 0.2 increment per 50 000 steps. MD simulations are performed in the NPT ensemble. The Langevin dynamics was used for constant temperature control, with the value of Langevin coupling coefficient and the Langevin temperature set to 5 ps and 300 K, respectively. The pressure was maintained at 1 atm using the Langevin piston method with a period of 100 fs and decay times of 50 fs. The time step is 2 fs for both equilibration and production phase. Bond lengths between hydrogens and heavy atoms are constrained using SHAKE (43). The long-range electrostatics is treated with the Particle Mesh Ewald (PME) method (44) with a cutoff distance 12 Å. The trajectory is recorded for every 10 ps.
Root mean square deviation (RMSD) and Root mean square fluctuation (RMSF) calculation
We have calculated RMSD values including heavy atoms only. Both the X-ray structure and the average structure have been used as references, as noted in the text and figure captions. We have also calculated the RMSF (45) which provides information about the atomic fluctuations over the trajectory broken down by residue. Both the RMSD and RMSF are calculated using the ptraj module in AMBER (41).
Details regarding the PCA, mapping of the electrostatic potential (ESP), and clustering analysis are in the Supplementary Data.
RESULTS
We aimed to submit the X-ray coordinates of the SAM-I riboswitch aptamer domain to a relatively long timescale (200 ns) MD simulation. The resulting trajectory samples the energetically accessible conformational space in the vicinity of the X-ray coordinates. We repeated the calculations and subsequent analysis with SAM removed to determine the effect of the ligand on the trajectory. We carefully monitored the overall deviation of coordinates from the starting structure and from an average structure. In this way, we could determine when our simulations had equilibrated, and detect signs of instabilities in coordinates which might indicate intrinsic problems with the structure or simulation parameters.
RMSD and RMSF of the binding pocket
The residues that have atoms within 5 Å of SAM were defined as the binding pocket (Figure 1b and c). The RMSD of all heavy atoms in the binding pocket with reference to the crystallographic structure is presented in Figure 2. Each snapshot has been superimposed on the crystallographic coordinates to remove the overall translational and rotational motion. In SAM_TRAJ, the binding pocket is relatively stable throughout the trajectory, though the full RMSD shows an increase in the final ∼10% of the 200-ns simulation (see ‘Discussion’ section). The interactions between the ligand and the residues in the binding pocket are maintained (see below). However, in the absence of SAM, the RMSDs gradually increase up to 100 ns. This result indicates instabilities in the crystallographic structures when the ligand is removed. The RMSFs of residues in the binding pocket increase in the absence of SAM (Supplementary Figure 1). Altogether, these results suggest that the binding pocket configuration requires the presence of SAM to maintain a stable fold. Over the course of our simulations, SAM_TRAJ fluctuates about an equilibrium structure which is close to the X-ray coordinates (Supplementary Figure 2). WoSAM_TRAJ, on the other hand, does not reach a stable, equilibrium structure after 200 ns of simulations (Supplementary Figure 2).
Figure 2.

Time evolution of RMSD of the binding pocket and the ligand SAM relative to X-ray coordinates (35). In the presence of SAM (SAM_TRAJ, red), the RMSD is stable, while in the absence of SAM (WoSAM_TRAJ, blue), the RMSD increases until ∼100 ns.
Essential dynamics of the SAM-I riboswitch
The MD simulation samples the 3N-dimensional space corresponding to the positions of the N atoms. We used PCA as a guide to identify significant dynamic processes from this very large data set. The first several eigenmodes indicate the directions of global motions and the eigenvalues indicate the magnitude of the motion along each eigenmode. The eigenmodes associated with the largest eigenvalues have the largest contribution to essential dynamics (46). The approach contrasts with conventional normal mode dynamics, which detects relatively trivial harmonic motions. The projection of the trajectory on an eigenmode, which is called the principle component, provides the time-dependent dynamics of the system along this eigenmode.
Here, PCA is applied to both SAM_TRAJ and WOSAM_TRAJ. The eigenvalue drops steeply in the first 10 eigenmodes, and the first 5 eigenmodes account for about 72% of the fluctuation of the trajectories (Supplementary Figure 3). The RMSF plots of both trajectories along their first 5 eigenmodes are displayed in Supplementary Figure 3, which present the fluctuations on an atomic basis. Based on these plots, the regions that are responsible for the most variance in atomic position can be identified. A clustering analysis identified three major structure clusters over the course of the trajectory. These are plotted as a function of the first two principle components in Figure 3a, alongside representative snapshots of each cluster for WOSAM_TRAJ. The plot shows that the PCA and clustering analysis have identified similar dynamic processes in WOSAM_TRAJ.
Figure 3.

Clustering and principal component analysis (PCA) point toward a chopstick-like motion involving P1 and P3 helices in the absence of SAM. (a) Projections of snapshots of the WOSAM-TRAJ are plotted against the first two principal components and color coded according to a k-means clustering (k = 3): cluster 0: green; cluster 1, cyan; cluster 2, magenta.. Representative snapshots from each cluster are also shown. This plot indicates that snapshots can be broadly clustered into two groups (cluster 1 and cluster 2) with cluster 0 representing a group with characteristics similar to those of cluster 2. The projection along PC1 broadly separates the clusters, while projection along PC2 completes the separation between clusters 0 and 2. Structures of representative snapshots indicate that clusters are distinguished by a dramatic change in relative position of P1 and P3. (b) (From top to bottom) The time evolution of the first principle component of WoSAM_TRAJ. (each snapshot is color-coded as in Figure 3a). RMSD for each snapshot in WOSAM_TRAJ relative to the representative snapshots for cluster 0 (cyan curve) and for cluster 2 (magenta curve). The distance between the Center of Mass (COM) of P1 and P3 for WOSAM_TRAJ (blue) and for SAM_TRAJ (red). During the first half of WOSAM_TRAJ, P1 and P3 helices move apart (clusters 0 and 2), then they move back together during the second half of the trajectory (cluster 1).
Snapshots representing each cluster reveal a large scale relative motion of helices P1 and P3 (Figure 3, see also Supplementary Movie 1). The P1 helix moves in the opposite direction relative to the P3 helix along the 1st eigenmode in WOSAM_TRAJ (Supplementary Figure 4). The time evolution of the first principle component and the distance monitor shows that the P1 helix and the P3 helix separate in the first 100 ns and then move close together in the second 100 ns (Figure 3, Supplementary Figures 3 and 4). Like a pair of chopsticks, the two helices move in phase but in opposite directions. The change from positive to negative correlation for these two helices upon removal of SAM is highlighted in Supplementary Figure 4.
The residues that display spike patterns in both trajectories are highlighted in Supplementary Figure 3. These residues (A14, U34 and A51) are highly exposed to the solvent in the crystallographic structure (35). Residue A9 has a spike pattern along the first 5 eigenmodes in SAM_TRAJ. A9 has the opposite orientation as compared to other nucleotides in single stranded junction J1/2, but it is placed close to residues in J3/4. Aside from the A9 and A14 residues, motions in the presence of SAM are confined to the P4 helix. This is the only large-scale secondary structure element which does not contact SAM. Overall, the PCA analysis indicates that SAM binding contributes to the formation of a stable core tertiary fold, in agreement with fluorescence resonance energy transfer (FRET) and gel mobility studies (47).
Transient formation of a nonadjacent dinucleotide stack
In order to understand the continuing dynamic behavior observed for A9 in the presence of SAM according to the PCA analysis we inspected more closely the movement of this residue over the course of the trajectory. We observed that A9 and U63 transiently form a non-adjacent dinucleotide stack resembling a motif originally observed in a ribosomal RNA (48,49) (Figure 4a). The LJ energy between nucleotides A9 and U63 was used to monitor this nonadjacent dinucleotide stack. Strongly favorable (negative) values indicate that A9 and U63 are stacked, while we interpret values near zero as unstacked. Some sample snapshots are presented (Figure 4a) and a movie (Supplementary Movie 2). Multiple instances of the transient stack take place, typically holding for a period of tens of nanoseconds.
Figure 4.

A9/U63 dinucleotide stack state monitor and the correlation with glycosidic angles for the respective residues. (a) Monitor of Lennard–Jones energy (EVDW) of interaction between the A9 and U63 residues involved in a nonadjacent stack in SAM_TRAJ (red) and WoSAM_TRAJ (blue). Snapshots above the panel of the A9/U63 stacking geometry show that the intervals during which EVDW is lowered correspond to the dinucleotide stacked state; (b) monitor of the glycosidic angle of residues involved in the nonadjacent stack in all the simulations. Histograms showing occupancy of the stacking states and glycosidic angles for A9 and U63 are on the right side of each figure respectively. A biphasic distribution for the A9 glycosidic angle is indicative of anharmonic motions.
The sample snapshots show that only one stacked mode between A9 and U63 is found in SAM_TRAJ. WOSAM_TRAJ adopts the same stacking mode as SAM_TRAJ at the beginning of the simulation. Before 20 ns the glycosidic angle of the nucleotide U63 flips from anti to syn (Figure 4a and b). Later, a transition between stacked state and unstacked state of A9 and U63 is coupled with a shift in glycosidic angle from anti to syn on A9 and from anti to high-anti on U63 in SAM_TRAJ (Figure 4a–c).
A histogram showing the occupancy of glycosidic angles in Figure 4c gives an indication of the ‘essential’ nature of the motion involving A9 in SAM_TRAJ. This residue undergoes a biphasic ‘jump’ motion between stacked and unstacked configurations. By contrast, in WOSAM_TRAJ motions involving A9, though present, may be harmonic, as indicated by the near-Gaussian distribution of glycosidic angle occupancies. U63 may be undergoing anharmonic motion in WoSAM_TRAJ. The correlation between the non-adjacent dinucleotide stack and the glycosidic angle of A9 in SAM_TRAJ is again apparent, since both monitors show a biphasic distribution of values over the course of the trajectory.
Coordination of the specific binding magnesium ion with J1/2 and J3/4 phosphates
In the crystallographic structures of the SAM-I riboswitch, a specific magnesium binding site is found between the junction J1/2 and the junction J3/4 (35). This specific bound magnesium ion is also similarly found in a recent crystallographic structure of the yit-J SAM-I riboswitch (Ailong Ke, personal communication). The magnesium ion apparently counters the electrostatic repulsion between the phosphate backbone of J1/2 and that of J3/4. In addition, this magnesium binding site is close to the SAM-binding pocket. We monitored the distances of this magnesium to negatively charged atoms on the RNA during our simulated trajectories (Figure 5b). In WoSAM_TRAJ, the contact distances between the magnesium ion and the phosphate backbone of J1/2 lengthen, while those with the phosphate backbone of J3/4 hold constant. The S-turn motif in J3/4 is preserved during the simulation. In SAM_TRAJ, all of the magnesium distances are constant through the simulation. We defined a pseudo-residue by combining those phosphates which contact the magnesium ion in the X-ray structure, and monitored the radius of gyration of this residue over the course of the two trajectories (Supplementary Figure 5). The effective radius of gyration is reduced significantly in SAM_TRAJ as compared to WoSAM_TRAJ.
Figure 5.

Relaxation of the magnesium coordination with J1/2 in the absence of SAM and its coordination with the backbone of nucleotide A9 is correlated with the A9/U63 dinucleotide stack state (Figure 4). (a) Residues near the specific magnesium binding site; (b) distance monitor between the specific binding magnesium and atoms on the phosphate backbone (Red: SAM_TRAJ, blue: WoSAM_TRAJ). Coordination of the magnesium ion with phosphates in J1/2 is stabilized in SAM_TRAJ; (c) distance monitor between the specific binding magnesium and O3′ in A9 in SAM_TRAJ. A slight shift is correlated with the non-adjacent dinucleotide stack (see text and Figure 4).
These results suggest that binding of magnesium and SAM might have a synergistic effect on the stabilization of the J1/2 junction. In addition, the coordination of this magnesium ion with the 3′ oxygen atom on A9 may be correlated with the nonadjacent dinucleotide stack state of A9 and U63 (Figures 3a and 5c). Coupled motions are also apparent for the backbone torsion angles (α, γ, δ, ϵ, ζ) of A9 (Supplementary Figure 6).
An ESP map confirms the likely presence of an electrostatic ‘hot spot’ at this site in the presence of SAM (Figure 6a). Close-ups of the hot spot for representatives of each of the three clusters obtained from SAM_TRAJ and WOSAM_TRAJ are shown in Figure 6b. The maps show the hot spot surrounding the Mg in a pocket tightly bounded by J1/2 and J3/4 in SAM_TRAJ snapshots, but focused more narrowly near the backbone of J3/4 in WOSAM_TRAJ. As force fields for divalent ions are seen as problematic for nucleic acid simulations (33), we performed a series of shorter simulations in which Mg ions were removed and only monovalent Na ions were present. A high occupancy of the binding site of the removed Mg coordinating the J1/2 and J3/4 phosphate groups was observed for Na ions, with two specific sodium ions in particular located permanently near the phosphates of G10 and A11. More Na ions seem to occupy the site with SAM present than with SAM absent (Supplementary Movie 3 and Supplementary Movie 4).
Figure 6.

Electrostatic potential maps (ESPs) highlighting two orthogonal slices through a Mg binding site. (a) ESP map for the X-ray coordinates with SAM bound. SAM is highlighted in yellow. J1/2 is highlighted in orange, J3/4 in magenta and the position of the Mg is highlighted by a green sphere. Note that phosphate groups appear as red and some electropositive functional groups as blue. A large region of negative potential appears on all sides of the Mg ion, bordered tightly by J1/2 and J3/4. (b) Close-ups of ESP in the region around the Mg site for three representative snapshots of SAM_TRAJ (left) and WOSAM_TRAJ (right). The snapshots are chosen from the centroid of each of the three main clusters. In SAM_TRAJ snapshots, the hotspot of negative potential is tightly surrounded by J1/2 and J3/4, whereas it is concentrated near J3/4 only in the absence of SAM.
Interactions between the ligand SAM and the SAM-I riboswitch
Residues in the binding pocket of the SAM-I riboswitch and SAM form a network of hydrogen bonds (35). To explore the interactions between SAM and the SAM-I riboswitch aptamer, we monitored the distance between donor and acceptor for possible hydrogen bonds as indicated in the crystallographic structure (Figure 7). As shown in the figure, all these contacts are maintained during the simulation. Of these distances, the interactions between the methionine chain moiety of SAM and G11/G58 persist most rigidly through the simulation. In addition, we monitored hydrogen bonding using the hbond command in the ptraj module of Amber10 (41) for all hydrogen donors and acceptors identified involving SAM binding (Supplementary Table 1). In this analysis, all possible hydrogen bond pairs were tracked. The majority of the hydrogen bond pairs were observed between the carboxyl group/the amino group on the methionine chain moiety of SAM and G11/G58 in the SAM-I riboswitch. Moreover, 3 of the 4 hydrogen bonds with highest occupancy occur between the carboxyl group of SAM and G11.
Figure 7.

The distances between hydrogen bond donor and acceptor of hydrogen bonds between SAM and the SAM-I riboswitch RNA in MD trajectory (nitrogen atoms are colored in blue, and oxygen atoms are colored in red). The contacts between SAM and G11 and G58 are extremely stable during the simulation. For the hydrogen bonding monitor, see Supplementary Table 1.
DISCUSSION
We have used MD simulations to probe the mechanism for coupling between SAM binding and SAM-I riboswitch conformation and secondary structure. Trajectories obtained from our long timescale simulated trajectories have been analyzed by PCA and clustering analysis and ESP calculations. Our trajectories indicate that SAM interactions with J1/2 are major contributors to binding. Moreover, these interactions help to fix J1/2 into a configuration that is favorable for P1 helix formation, which has been proposed to be the kinetic barrier to AAT formation (20). Comparison of the SAM_TRAJ and WoSAM_TRAJ leads us to suggest that some details of the bound SAM RNA conformation are stabilized when SAM is present in the binding pocket.
Stabilization of the riboswitch aptamer core in the presence of SAM
PCA analysis clearly suggests that a core region of the aptamer structure, defined as those secondary structure elements that contact SAM with at least one residue (P1, J1/2 and P3,) are stabilized when SAM is bound. P4 and some regions of P2, which do not have direct contact with SAM, undergo more dynamic fluctuations in SAM_TRAJ. Two exceptions to this rule are A9, in J1/2, and A14, the bulged nucleotide within the P2 helix. Interestingly, these two residues have the lowest reported electron density in the submitted X-ray data. The apparent correlation in their motion, as indicated by the PCA plots (Supplementary Figure 3) appears to reflect the fact that adjacent secondary structure elements are undergoing very little motion. The intervening residues (10–13) are stacked and are held rigid by interactions with SAM and magnesium. The unstacked status of A9 is reinforced by the transient formation of the non adjacent dinucleotide stack with U63 (see below).
J1/2 positioned for formation of the P1 helix
The observation of extraordinarily stable contact distances between G11 and SAM is consistent with the high sequence conservation observed at this position. Mutation at this position eliminates the SAM binding (11). This is consistent with previous findings that the length of the methionine moiety is crucial for tight binding of SAM to the aptamer domain (11). The interactions between SAM and G11 are in the form of hydrogen bonding. This may help explain the discrimination by the riboswitch between SAM and its analog S-adenosyl homocystein (SAH), which is restricted to adopt certain conformations (35,50).
The monitor of magnesium coordination suggests that J1/2 cannot maintain its compact configuration as seen in the crystallographic structure in the absence of SAM. This conclusion is reinforced by the overall increase in the radius of gyration of a pseudo-residue defined by the group of phosphates involved in coordinating the magnesium (Supplementary Figure 5). However, a hot spot of negative electrostatic potential seems to preserve the magnesium coordination throughout the simulation in the presence of SAM. This result is consistent with biophysical studies which indicate that the compact global folding of the SAM-I riboswitch is stabilized by SAM binding (47). Altogether, these results suggest that the SAM binding affects the placement of J1/2. SAM binding would then appear to lower the entropic cost of pulling the 5′ and 3′ of the P1 helix together by pre-positioning J1/2, thus facilitating formation of the P1 helix.
Although there is no experimental report of Mg ions being replaced by Na ions in a stably folded SAM-I riboswitch, we have performed simulations with only the latter ion present. These simulations, together with the ESP maps, indicate that the Mg binding site is located within a pocket of strongly negative electrostatic potential in the SAM-bound form. The appearance of the ESP maps for SAM_TRAJ (Figure 6b) suggests that the contact between SAM and J1/2 positions the latter close to J3/4, setting up a region of electrostatic repulsion. Close contacts (<7 Å; ∼3.5 Å for two contacts) observed in the X-ray structure and in our simulations for the Mg ion with phosphate moieties (Figure 5) are consistent with inner shell binding (51).
The function of the non-adjacent dinucleotide stack
In SAM_TRAJ, the nonadjacent dinucleotide stack of A9 and U63 is transiently formed during the simulation. Although the nonadjacent stack is not observed in the X-ray structure of T. tencongensis SAM-I riboswitch RNA, an analogous nonadjacent dinucleotide stack (A10 and A84) is observed in the recent crystallographic structure of the yitJ S-box riboswitch (Ailong Ke, personal communication). Our simulations suggest that the dinucleotide stack may be a conserved feature of SAM-I riboswitches, though this tertiary interaction is apparently not stably maintained. Coordination of the specific binding magnesium and phosphate atom on A9 is coupled with this dinucleotide stack state (Figures 4a and 5c) in SAM_TRAJ, though not in the second SAM trajectory (see Supplementary Data). When the stack is lost, the coordination of the magnesium and phosphate atom on A9 is shortened slightly. It is possible that this non-adjacent dinucleotide stack stabilizes the tertiary interactions between J1/2 and J3/4.
Although the simulation including bound SAM shows transient formation of, loss, and reformation, of the A9/U63 stack, the stack is maintained consistently through WoSAM_TRAJ. As mentioned above, the significance of conformational changes observed in WoSAM_TRAJ, including the observation of alternate glycosidic angles, is difficult to judge. Although we have used force field potentials which have been explicitly optimized with glycosidic angles in mind (25), with no published apo-structure available we have no means of cross validating the details of WoSAM_TRAJ (see below). What we can say from this trajectory is that in the absence of SAM, A9 will have a tendency to seek alternative conformations. One correlate will be a weakening of the coordination between the specific bound magnesium and the phosphate of A9 mentioned above.
Robust features of long timescale simulations
Since the free-form structure of the aptamer domains have not yet been available publicly or determined experimentally, the free-form structure was simply obtained by removing SAM from the coordinates of the bound complex. However, the goal of this study is not to probe the conformation of the free-form SAM-I riboswitch. The limited timescales available to MD are not sufficient to provide meaningful information in the absence of an experimental determination of the equilibrium structure. Our aim has been to understand effects that SAM binding has on the tertiary structure and dynamics of the aptamer domain.
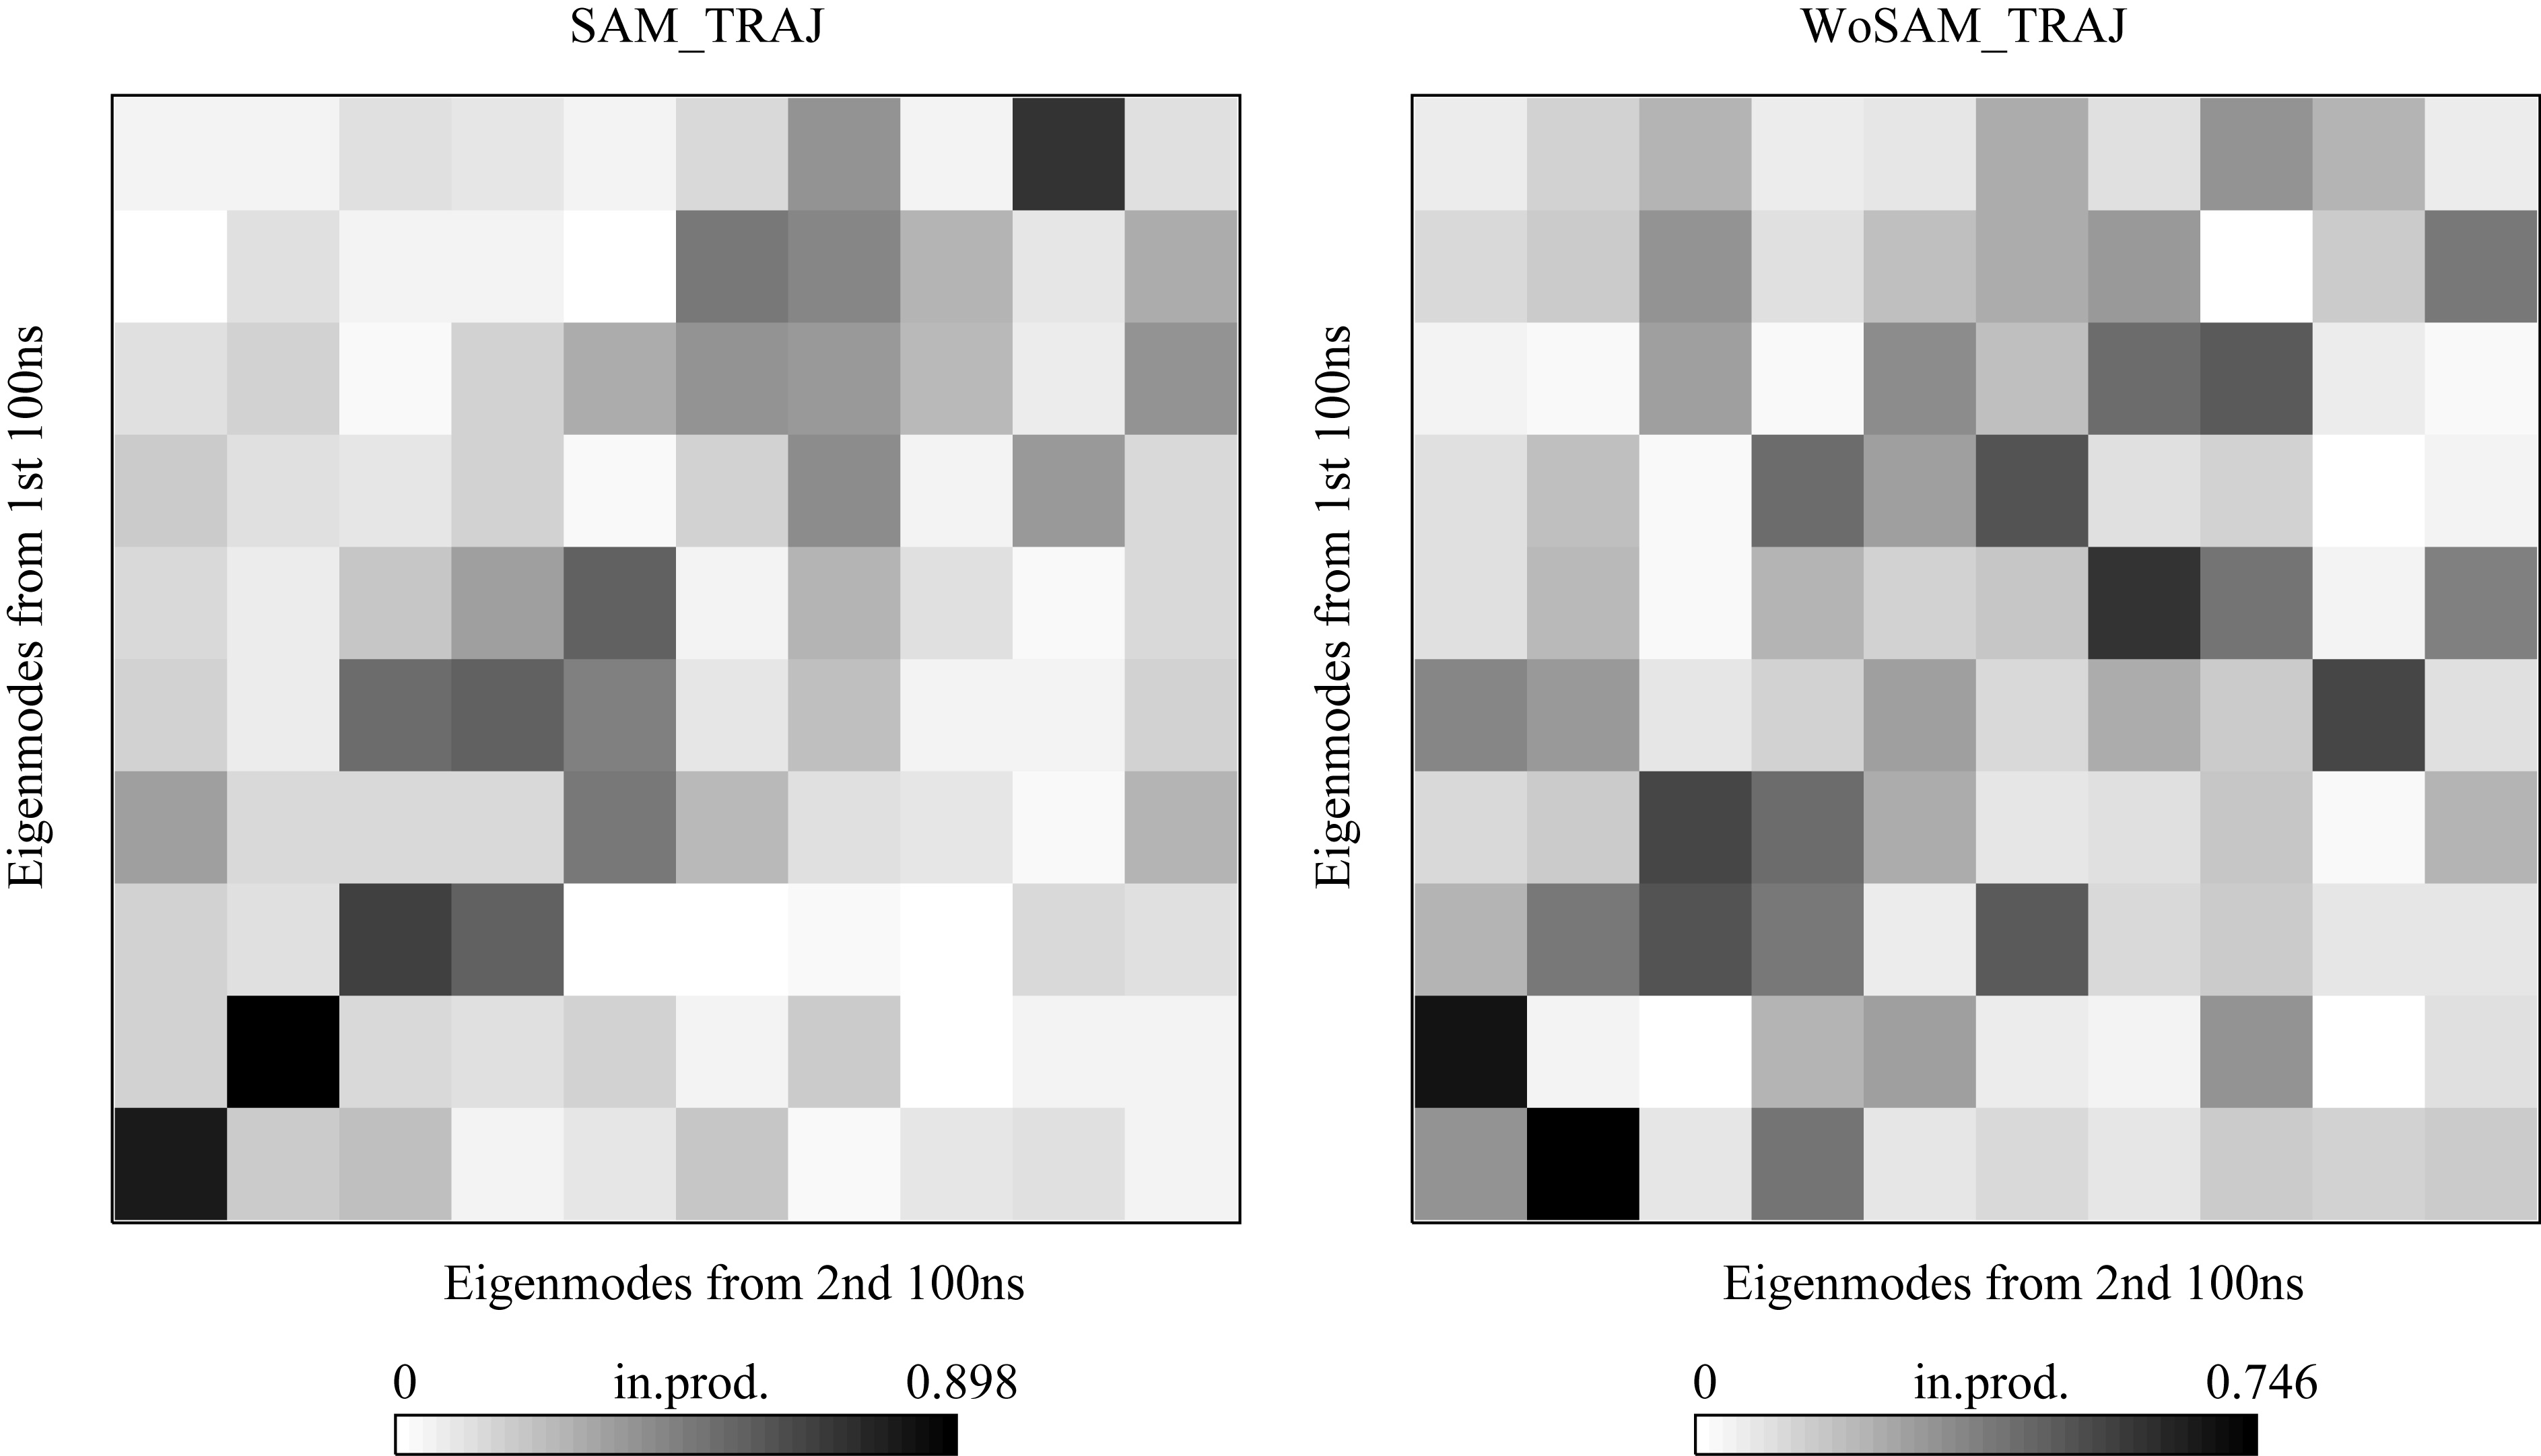
The simulations reported here are amongst the longest all-atom trajectories reported for an RNA of this size to date (36). Several hundred nanosecond simulations require significant computing resources. Coarse-grained models or knowledge-based models could be an alternative but protocols are still in development (52). Recent simulations have begun to press the limits of MD simulations well into the tens of nanoseconds range or longer for biologically relevant RNAs (33,34). The time evolutions of the RMSD of all heavy atoms (atoms except hydrogen atom) with reference to the crystal structure and average structure during simulations are shown in Supplementary Figure 2. As shown in the figure, the RMSD values with reference to the crystallographic structure are maintained within 6 Å, which are reasonable for RNAs that have complicated tertiary folding. The RMSD values using the average structure as a reference stays around 3 Å over the simulation. The larger RMSDs, and larger-scale dynamic behavior identified by PCA analysis in the absence of SAM, imply that the aptamer structure as represented in the X-ray coordinates requires the presence of bound SAM for full stability. The first 3 eigenmodes show a strong correlation between the first and second halves of SAM_TRAJ (Supplementary Figure 7), in contrast to the cross correlation map observed between the two halves of WOSAM_TRAJ. We conclude that the essential dynamic modes are consistent through SAM_TRAJ but not through WOSAM_TRAJ.
An apparent jump in the RMSD for SAM_TRAJ during the last 20 ns of the trajectory indicates that at this stage the simulation is beginning to deviate sharply from the experimental coordinates. Until 160 ns, the RMSD stays within <5 Å of the X-ray structure. Accumulation of small errors in the initial input are a concern over a long MD trajectory (31). Recent progress in refinement of force-field parameters and protocols has increased confidence in long timescale MD simulations of protein dynamics (53). Few, if any, MD trajectories of 100 ns or longer have been reported for RNA (31). For these reasons, we ran a second 200-ns MD simulation with SAM present (Supplementary Figure 8). The second trajectory maintained an RMSD relative to the experimental structure of less than ∼5 Å. Unless otherwise noted, we highlighted only features of the SAM_TRAJ which were present also during the second trajectory.
Effects of transcriptional pausing
The critical decision step in SAM-I mediated regulation is the competence of the 3′ sequence of the P1 helix to form AAT or AT conformations. A folding simulation (20) study has proposed that SAM can bind to the aptamer after formation of the P3 helix, then accelerate overall AAT folding. Several studies (19,54) have proposed that transcriptional pausing or the kinetics of folding has an effect on this genetic decision step. However, the details of how transcriptional pausing influences riboswitch regulation are unclear. The actual number of nucleotides that have been transcribed at the time when SAM binding occurs is unknown.
Although tertiary structures are more brittle than the secondary structures for RNA molecules, as evidenced in the absence of SAM of this study, it is believed that it is the tertiary structures that account for the kinetic arrest of the structure rearrangement of RNA molecules from mechanical pulling studies (55,56). The comparison of the trajectories of the riboswitch with and without SAM bound suggests a mechanism through which SAM binding can stabilize the formation of the AAT conformation relative to an alternative conformer, such as the AT. Alternatively, by aiding the positioning of J1/2 SAM binding may accelerate AAT formation during transcription as predicted by models for kinetic control of riboswitches. The placement of J1/2 facilitated by SAM binding increases the probability, and therefore the rate, of the encounter between the 5′ and the 3′ ends of the P1 helix. The results here are consistent with a kinetic effect arising from the binding of SAM, trapping the AAT conformation before the full AT sequence is synthesized by the polymerase.
CONCLUSION AND FUTURE WORK
The results from MD simulations lead us to propose that the positioning of J1/2 upon SAM binding helps to overcome the entropic barrier to formation of the P1 helix. SAM binding appears to facilitate the coordination of a magnesium ion to phosphates within the J1/2 strand. This proposed mechanism can be tested by single molecule experiments (56) that can explore the energy landscape of the folding or folding kinetics studies (57,58) with and without SAM. Interestingly, a nonadjacent dinucleotide stack that is present in a recent crystallographic structure of the SAM-I riboswitch emerges in our simulations. This finding leads us to suggest that the interaction may form transiently in the T. tencongensis SAM-I riboswitch RNA as well.
It is important to note that little structural or dynamic information regarding the AT conformation is currently available at this point. Future studies of transcriptional pausing, dynamic equilibria between AAT, AT and T forms, and, in particular, how these factors are correlated with SAM binding, will be necessary to reveal the regulatory mechanism behind this system. Understanding the molecular basis of riboswitch recognition of SAM and the coupling between ligand binding and RNA secondary structure is crucial for the design of novel riboswitch binding small molecules. Such designed ligands can provide a powerful tool to further probe the flexibility of riboswitch RNA (59), and the link between RNA conformational dynamics and function (1).
SUPPLEMENTARY DATA
Supplementary Data are available at NAR Online.
FUNDING
Faculty Research Grant from the LSU Office of Research and Economic Development (to F.A. and S.J.); and the LSU Department of Biological Sciences (to F.A.). Funding for open access charge: GridChem Project and CCT Resources.
Conflict of interest statement. None declared.
Supplementary Material
ACKNOWLEDGEMENTS
We thank other members in the Aboul-ela lab for useful discussions. We thank Changrui Lu and Dr. Ailong Ke for allowing us to view coordinates of the yitJ riboswitch RNA prior to publication. Portions of this research were conducted with high performance computational resources provided by the Louisiana Optical Network Initiative (http://www.loni.org/). We thank the LSU & LONI HPC support for their help during the use of High Performance Computing machines. We also acknowledge resources provided by the GridChem Project.
REFERENCES
- 1.Al-Hashimi HM, Walter NG. RNA dynamics: it is about time. Curr. Opin. Struct. Biol. 2008;18:321–329. doi: 10.1016/j.sbi.2008.04.004. [DOI] [PMC free article] [PubMed] [Google Scholar]
- 2.Cruz JA, Westhof E. The dynamic landscapes of RNA architecture. Cell. 2009;136:604–609. doi: 10.1016/j.cell.2009.02.003. [DOI] [PubMed] [Google Scholar]
- 3.Mandal M, Breaker RR. Gene regulation by riboswitches. Nat. Rev. Mol. Cell Biol. 2004;5:451–463. doi: 10.1038/nrm1403. [DOI] [PubMed] [Google Scholar]
- 4.Grundy FJ, Henkin TM. Regulation of gene expression by effectors that bind to RNA. Curr. Opin. Microbiol. 2004;7:126–131. doi: 10.1016/j.mib.2004.02.013. [DOI] [PubMed] [Google Scholar]
- 5.Kazanov M, Vitreschak A, Gelfand M. Abundance and functional diversity of riboswitches in microbial communities. BMC Genomics. 2007;8:347. doi: 10.1186/1471-2164-8-347. [DOI] [PMC free article] [PubMed] [Google Scholar]
- 6.Barrick J, Breaker R. The distributions, mechanisms, and structures of metabolite-binding riboswitches. Genome Biol. 2007;8:R239. doi: 10.1186/gb-2007-8-11-r239. [DOI] [PMC free article] [PubMed] [Google Scholar]
- 7.Blount KF, Breaker RR. Riboswitches as antibacterial drug targets. Nat. Biotech. 2006;24:1558–1564. doi: 10.1038/nbt1268. [DOI] [PubMed] [Google Scholar]
- 8.Blouin S, Mulhbacher J, Penedo JC, Lafontaine DA. Riboswitches: Ancient and Promising Genetic Regulators. ChemBioChem. 2009;10:400–416. doi: 10.1002/cbic.200800593. [DOI] [PubMed] [Google Scholar]
- 9.Henkin TM. Riboswitch RNAs: using RNA to sense cellular metabolism. Genes Dev. 2008;22:3383–3390. doi: 10.1101/gad.1747308. [DOI] [PMC free article] [PubMed] [Google Scholar]
- 10.Lim J, Winkler WC, Nakamura S, Scott V, Breaker RR. Molecular-recognition characteristics of SAM-binding riboswitches. Angew. Chemie Int. Ed. 2006;45:964–968. doi: 10.1002/anie.200503198. [DOI] [PubMed] [Google Scholar]
- 11.Winkler WC, Nahvi A, Sudarsan N, Barrick JE, Breaker RR. An mRNA structure that controls gene expression by binding S-adenosylmethionine. Nat. Struct. Biol. 2003;10:701–707. doi: 10.1038/nsb967. [DOI] [PubMed] [Google Scholar]
- 12.Mcdaniel BAM, Grundy FJ, Artsimovitch I, Henkin TM. Transcription termination control of the S box system: direct measurement of S-adenosylmethionine by the leader RNA. Proc. Natl Acad. Sci. USA. 2003;100:3083–3088. doi: 10.1073/pnas.0630422100. [DOI] [PMC free article] [PubMed] [Google Scholar]
- 13.Epshtein V, Mironov AS, Nudler E. The riboswitch-mediated control of sulfur metabolism in bacteria. Proc. Natl Acad. Sci. USA. 2003;100:5052–5056. doi: 10.1073/pnas.0531307100. [DOI] [PMC free article] [PubMed] [Google Scholar]
- 14.Wang JX, Breaker RR. Riboswitches that sense S-adenosylmethionine and S-adenosylhomocysteine. Biochem. Cell Biol. 2008;86:157–168. doi: 10.1139/O08-008. [DOI] [PubMed] [Google Scholar]
- 15.Grundy FJ, Henkin TM. The S box regulon: a new global transcription termination control system for methionine and cysteine biosynthesis genes in Gram-positive bacteria. Mol. Microbiol. 1998;30:737–749. doi: 10.1046/j.1365-2958.1998.01105.x. [DOI] [PubMed] [Google Scholar]
- 16.Wickiser JK, Cheah MT, Breaker RR, Crothers DM. The kinetics of ligand binding by an adenine-sensing riboswitch. Biochemistry. 2005;44:13404–13414. doi: 10.1021/bi051008u. [DOI] [PubMed] [Google Scholar]
- 17.Gilbert SD, Stoddard CD, Wise SJ, Batey RT. Thermodynamic and kinetic characterization of ligand binding to the purine riboswitch aptamer domain. J. Mol. Biol. 2006;359:754–768. doi: 10.1016/j.jmb.2006.04.003. [DOI] [PubMed] [Google Scholar]
- 18.Montange RK, Batey RT. Riboswitches: emerging themes in RNA structure and function. Annu. Rev. Biophys. 2008;37:117–133. doi: 10.1146/annurev.biophys.37.032807.130000. [DOI] [PubMed] [Google Scholar]
- 19.Tomsic J, Mcdaniel BA, Grundy FJ, Henkin TM. Natural variability in S-adenosylmethionine (SAM)-dependent riboswitches: S-Box elements in Bacillus subtilis exhibit differential sensitivity to SAM in vivo and in vitro. J. Bacteriol. 2008;190:823–833. doi: 10.1128/JB.01034-07. [DOI] [PMC free article] [PubMed] [Google Scholar]
- 20.Whitford PC, Schug A, Saunders J, Hennelly SP, Onuchic JN, Sanbonmatsu KY. Nonlocal helix formation is key to understanding S-Adenosylmethionine-1 riboswitch function. Biophys. J. 2009;96:L7–L9. doi: 10.1016/j.bpj.2008.10.033. [DOI] [PMC free article] [PubMed] [Google Scholar]
- 21.Rieder R, Lang K, Graber D, Micura R. Ligand-induced folding of the adenosine deaminase A-riboswitch and implications on riboswitch translational control. ChemBioChem. 2007;8:896–902. doi: 10.1002/cbic.200700057. [DOI] [PubMed] [Google Scholar]
- 22.Mccammon JA, Gelin BR, Karplus M. Dynamics of folded proteins. Nature. 1977;267:585–590. doi: 10.1038/267585a0. [DOI] [PubMed] [Google Scholar]
- 23.Dodson GG, Lane DP, Verma CS. Molecular simulations of protein dynamics: new windows on mechanisms in biology. EMBO Rep. 2008;9:144–150. doi: 10.1038/sj.embor.7401160. [DOI] [PMC free article] [PubMed] [Google Scholar]
- 24.Showalter SA, Bruschweiler R. Validation of molecular dynamics simulations of biomolecules using NMR spin relaxation as benchmarks: application to the AMBER99SB force field. J. Chem. Theor. Comput. 2007;3:961–975. doi: 10.1021/ct7000045. [DOI] [PubMed] [Google Scholar]
- 25.Perez A, Marchan I, Svozil D, Šponer J, Cheatham TE, Laughton CA, Orozco M. Refinement of the AMBER force field for nucleic acids: improving the description of {alpha}/{gamma} conformers. Biophys. J. 2007;92:3817–3829. doi: 10.1529/biophysj.106.097782. [DOI] [PMC free article] [PubMed] [Google Scholar]
- 26.Chu VB, Bai Y, Lipfert J, Herschlag D, Doniach S. A repulsive field: advances in the electrostatics of the ion atmosphere. Curr. Opin. Chem. Biol. 2008;12:619–625. doi: 10.1016/j.cbpa.2008.10.010. [DOI] [PMC free article] [PubMed] [Google Scholar]
- 27.Mackerell AD, Jr, Nilsson L. Molecular dynamics simulations of nucleic acid–protein complexes. Curr. Opin. Struct. Biol. 2008;18:194–199. doi: 10.1016/j.sbi.2007.12.012. [DOI] [PMC free article] [PubMed] [Google Scholar]
- 28.Foloppe N, Nilsson L, Mackerell AD., Jr Ab initio conformational analysis of nucleic acid components: intrinsic energetic contributions to nucleic acid structure and dynamics. Biopolymers. 2001;61:61–76. doi: 10.1002/1097-0282(2001)61:1<61::AID-BIP10047>3.0.CO;2-1. [DOI] [PubMed] [Google Scholar]
- 29.Mcdowell SE, Špačková NA, Šponer J, Walter NG. Molecular dynamics simulations of RNA: An in silico single molecule approach. Biopolymers. 2007;85:169–184. doi: 10.1002/bip.20620. [DOI] [PMC free article] [PubMed] [Google Scholar]
- 30.Aduri R, Psciuk BT, Saro P, Taniga H, Schlegel HB, Santalucia J. AMBER force field parameters for the naturally occurring modified nucleosides in RNA. J. Chem. Theor. Comput. 2007;3:1464–1475. doi: 10.1021/ct600329w. [DOI] [PubMed] [Google Scholar]
- 31.Hashem Y, Auffinger P. A short guide for molecular dynamics simulations of RNA systems. Methods. 2009;47:187–197. doi: 10.1016/j.ymeth.2008.09.020. [DOI] [PubMed] [Google Scholar]
- 32.Auffinger P, Bielecki L, Westhof E. The Mg2+ binding sites of the 5S rRNA loop E motif as investigated by molecular dynamics simulations. Chem. Biol. 2003;10:551–561. doi: 10.1016/s1074-5521(03)00121-2. [DOI] [PubMed] [Google Scholar]
- 33.Krasovska MV, Sefcikova J, Réblová K, Schneider B, Walter NG, Šponer J. Cations and hydration in catalytic RNA: molecular dynamics of the hepatitis delta virus ribozyme. Biophys. J. 2006;91:626–638. doi: 10.1529/biophysj.105.079368. [DOI] [PMC free article] [PubMed] [Google Scholar]
- 34.Villa A, Wohnert J, Stock G. Molecular dynamics simulation study of the binding of purine bases to the aptamer domain of the guanine sensing riboswitch. Nucleic Acids Res. 2009 doi: 10.1093/nar/gkp486. doi:10.1093/nar/gkp486. [DOI] [PMC free article] [PubMed] [Google Scholar]
- 35.Montange RK, Batey RT. Structure of the S-adenosylmethionine riboswitch regulatory mRNA element. Nature. 2006;441:1172–1175. doi: 10.1038/nature04819. [DOI] [PubMed] [Google Scholar]
- 36.Auffinger P. In: Computational Studies of RNA and DNA. Šponer J, Lankaš F, editors. Dordrecht, The Netherlands: Springer; 2006. pp. 283–300. [Google Scholar]
- 37.Phillips JC, Braun R, Wei W, Gumbart J, Tajkhorshid E, Villa E, Chipot C, Skeel RD, Kale L, Schulten K. Scalable molecular dynamics with NAMD. J. Comput. Chem. 2005;26:1781–1802. doi: 10.1002/jcc.20289. [DOI] [PMC free article] [PubMed] [Google Scholar]
- 38.Wang J, Wolf RM, Caldwell JW, Kollman PA, Case DA. Development and testing of a general amber force field. J. Comput. Chem. 2004;25:1157–1174. doi: 10.1002/jcc.20035. [DOI] [PubMed] [Google Scholar]
- 39.Wang J, Wang W, Kollman PA, Case DA. Automatic atom type and bond type perception in molecular mechanical calculations. J. Mol. Graph. Model. 2006;25:247–260. doi: 10.1016/j.jmgm.2005.12.005. [DOI] [PubMed] [Google Scholar]
- 40.Jakalian A, Bush BL, Jack DB, Bayly CI. Fast, efficient generation of high-quality atomic charges. AM1-BCC model: I. Method. J. Comput. Chem. 2000;21:132–146. doi: 10.1002/jcc.10128. [DOI] [PubMed] [Google Scholar]
- 41.Case DA, Cheatham TE, Darden T, Gohlke H, Luo R, Jr, KMM , Onufriev A, Simmerling C, Wang B, Woods RJ. The amber biomolecular simulation programs. J. Comput. Chem. 2005;26:1668–1688. doi: 10.1002/jcc.20290. [DOI] [PMC free article] [PubMed] [Google Scholar]
- 42.Jorgensen WL, Duffy EM. Prediction of drug solubility from Monte Carlo simulations. Bioorg. Med. Chem. Lett. 2000;10:1155–1158. doi: 10.1016/s0960-894x(00)00172-4. [DOI] [PubMed] [Google Scholar]
- 43.Ryckaert JP, Ciccotti G, Berendsen HJC. Numerical integration of the Cartesian equations of motion of a system with constraints: molecular dynamics of n-alkanes. J. Comput. Phys. 1977;23:327–341. [Google Scholar]
- 44.Essmann U, Perera L, Berkowitz ML, Darden T, Lee H, Pedersen LG. A smooth particle mesh Ewald method. J. Chem. Phys. 1995;103:8577–8593. [Google Scholar]
- 45.Henzler-Wildman K, Kern D. Dynamic personalities of proteins. Nature. 2007;450:964–972. doi: 10.1038/nature06522. [DOI] [PubMed] [Google Scholar]
- 46.Amadei A, Linssen ABM, Berendsen HJC. Essential dynamics of proteins. Proteins: Struct. Funct. Genet. 1993;17:412–425. doi: 10.1002/prot.340170408. [DOI] [PubMed] [Google Scholar]
- 47.Heppell B, Lafontaine DA. Folding of the SAM aptamer is determined by the formation of a K-turn-dependent pseudoknot. Biochemistry. 2008;47:1490–1499. doi: 10.1021/bi701164y. [DOI] [PubMed] [Google Scholar]
- 48.Conn GL, Draper DE, Lattman EE, Gittis AG. Crystal structure of a conserved ribosomal protein–RNA complex. Science. 1999;284:1171–1174. doi: 10.1126/science.284.5417.1171. [DOI] [PubMed] [Google Scholar]
- 49.Wimberly BT, Guyman R, Mccutcheon JP, White SW, Ramakrishnan V. A detailed view of a ribosomal active site: the structure of the L11-RNA complex. Cell. 1999;97:491–502. doi: 10.1016/s0092-8674(00)80759-x. [DOI] [PubMed] [Google Scholar]
- 50.Lu C, Smith AM, Fuchs RT, Ding F, Rajashankar K, Henkin TM, Ke A. Crystal structures of the SAM-III/SMK riboswitch reveal the SAM-dependent translation inhibition mechanism. Nat. Struct. Mol. Biol. 2008;15:1076–1083. doi: 10.1038/nsmb.1494. [DOI] [PMC free article] [PubMed] [Google Scholar]
- 51.Draper DE, Grilley D, Soto AM. Ions and RNA folding. Annu. Rev. Biophys. Biomol. Struct. 2005;34:221–243. doi: 10.1146/annurev.biophys.34.040204.144511. [DOI] [PubMed] [Google Scholar]
- 52.Jonikas MA, Radmer RJ, Laederach A, Das R, Pearlman S, Herschlag D, Altman RB. Coarse-grained modeling of large RNA molecules with knowledge-based potentials and structural filters. RNA. 2009;15:189–199. doi: 10.1261/rna.1270809. [DOI] [PMC free article] [PubMed] [Google Scholar]
- 53.Klepeis JL, Lindorff-Larsen K, Dror RO, Shaw DE. Long-timescale molecular dynamics simulations of protein structure and function. Curr. Opin. Struct. Biol. 2009;19:120–127. doi: 10.1016/j.sbi.2009.03.004. [DOI] [PubMed] [Google Scholar]
- 54.Wickiser JK, Winkler WC, Breaker RR, Crothers DM. The speed of RNA transcription and metabolite binding kinetics operate an FMN riboswitch. Mol. Cell. 2005;18:49–60. doi: 10.1016/j.molcel.2005.02.032. [DOI] [PubMed] [Google Scholar]
- 55.Wong TN, Sosnick TR, Pan T. Folding of noncoding RNAs during transcription facilitated by pausing-induced nonnative structures. Proc. Natl Acad. Sci. USA. 2007;104:17995–18000. doi: 10.1073/pnas.0705038104. [DOI] [PMC free article] [PubMed] [Google Scholar]
- 56.Greenleaf WJ, Frieda KL, Foster DAN, Woodside MT, Block SM. Direct observation of hierarchical folding in single riboswitch aptamers. Science. 2008;319:630–633. doi: 10.1126/science.1151298. [DOI] [PMC free article] [PubMed] [Google Scholar]
- 57.Lang K, Rieder R, Micura R. Ligand-induced folding of the thiM TPP riboswitch investigated by a structure-based fluorescence spectroscopic approach. Nucleic Acids Res. 2007;35:5370–5378. doi: 10.1093/nar/gkm580. [DOI] [PMC free article] [PubMed] [Google Scholar]
- 58.Shcherbakova I, Brenowitz M. Monitoring structural changes in nucleic acids with single residue spatial and millisecond time resolution by quantitative hydroxyl radical footprinting. Nat. Protoc. 2008;3:288–302. doi: 10.1038/nprot.2007.533. [DOI] [PubMed] [Google Scholar]
- 59.Murchie AIH, Davis B, Isel C, Afshar M, Drysdale MJ, Bower J, Potter AJ, Starkey ID, Swarbrick TM, Mirza S, et al. Structure-based drug design targeting an inactive RNA conformation: exploiting the flexibility of HIV-1 TAR RNA. J. Mol. Biol. 2004;336:625–638. doi: 10.1016/j.jmb.2003.12.028. [DOI] [PubMed] [Google Scholar]
- 60.Yang H, Jossinet F, Leontis N, Chen L, Westbrook J, Berman H, Westhof E. Tools for the automatic identification and classification of RNA base pairs. Nucleic Acids Res. 2003;31:3450–3460. doi: 10.1093/nar/gkg529. [DOI] [PMC free article] [PubMed] [Google Scholar]
- 61.Xin Y, Laing C, Leontis NB, Schlick T. Annotation of tertiary interactions in RNA structures reveals variations and correlations. RNA. 2008;14:2465–2477. doi: 10.1261/rna.1249208. [DOI] [PMC free article] [PubMed] [Google Scholar]
Associated Data
This section collects any data citations, data availability statements, or supplementary materials included in this article.