

Abstract
With the advancement of image acquisition and analysis methods in recent decades, unique opportunities have emerged to study the neuroanatomical correlates of intelligence. Traditional approaches examining global measures have been complemented by insights from more regional analyses based on pre-defined areas. Newer state-of-the-art approaches have further enhanced our ability to localize the presence of correlations between cerebral characteristics and intelligence with high anatomic precision. These in vivo assessments have confirmed mainly positive correlations, suggesting that optimally increased brain regions are associated with better cognitive performance. Findings further suggest that the models proposed to explain the anatomical substrates of intelligence should address contributions from not only (pre)frontal regions, but also widely distributed networks throughout the whole brain.
Keywords: Brain, Cerebral Cortex, Corpus Callosum, MRI
Introduction
The substrate of human intelligence has been a topic of considerable interest to scientists, philosophers, and physicians from the time of the ancient Greeks. The advent of modern brain imaging technologies and the development of advanced analysis methods have since provided unique opportunities to examine the biological essence of human intelligence. The goal of this article is to summarize macro-structural associations with intelligence based on magnetic resonance imaging (MRI) data from healthy individuals. However, rather than providing an exhaustive overview, we aimed to demonstrate a variety of research findings using traditional and modern approaches that allow us to analyze correlations with different degrees of regional specificity. This review encompasses studies investigating relationships between global (e.g., brain volume), regional (e.g., lobar volume), and highly localized (e.g., voxel-level) brain measurements and intelligence. Measures cover diverse brain structures (e.g., whole brain, cerebral cortex, corpus callosum) and cerebral characteristics (e.g., volume, concentration, thickness). A related goal of this article is to highlight that many questions regarding the biological substrates of intelligence remain unresolved – not only due to partly overlapping results across studies and the sparseness of research findings, but also due to limitations in the spatial resolution of the images and other acquisition parameters. Thus, conclusions with respect to the underlying neural architecture and its possible impact on higher cognitive function remain speculative.
1. Volume of the Brain and its Subregions
As early as the 5th century B.C.E., the brain was assumed to be the location where human thoughts are elaborated (Crivellato and Ribatti, 2007), but controversy has persisted for many centuries concerning the actual associations between cerebral structure and cognitive function. Some early attempts to establish relationships between brain anatomy and intelligence were based on measuring external head parameters (i.e., perimeter, height, length, width). Results from these studies reported relatively weak although sometimes significant relationships (i.e., significant positive correlations between intelligence and head width) (Gignac et al., 2003). Other studies have measured brain weight or volume using post mortem data and also revealed that greater intellectual abilities are associated with greater cerebral volumes1, albeit observed correlations “depended on the realm of intelligence studied, as well as the sex and hemispheric functional lateralization of the subject” (Witelson et al., 2006). The most recent approaches, (summarized and discussed below) have taken advantage of the improved spatial resolution of MRI and calculated brain volume in vivo based on (semi)automatically classifying and quantifying voxels representing brain tissue.
Global and regional findings of volume-based intelligence correlates
For assessments of relationships between global brain volume and intelligence, results from existing studies have shown predominantly positive correlations ranging from 0 to 0.6, with the majority of MRI studies reporting correlations around 0.3 or 0.4 (Wickett et al., 2000; McDaniel, 2005; Witelson et al., 2006). A visual impression of how total brain volume (TBV) relates to intelligence is provided in Figure 1 (first panel). In order to determine whether all brain regions are equally related to intelligence or whether there are certain structures that are selectively altered in more intelligent individuals, a number of studies have increased their regional specificity by measuring the area or volume of regions of interest (ROIs) following boundaries based on structural or functional anatomy. Again, mainly positive correlations have been reported, where the most significant and frequently detected associations are observed within the frontal, temporal, and parietal lobes, the hippocampus, and the cerebellum (Andreasen et al., 1993; Flashman et al., 1997; MacLullich et al., 2002).
Figure 1.

Correlations between global volumes and full-scale intelligence in a sample of 65 healthy subjects, after removing the partial effects of sex and age (Narr et al., 2007). Illustrated are the intelligence-specific relationships with the residuals of total brain volume (TBV), gray matter volume (GM), and white matter volume (WM).
Possible functional implications
These studies clearly demonstrate a biological basis to intelligence, with larger brains predicting greater intelligence (Gray and Thompson, 2004; Toga and Thompson, 2005). However, complementary findings revealing distinct regional correlations with intelligence suggest that increased global brain volumes observed in more intelligent individuals may be accounted for by selectively enlarged volumes in brain regions especially relevant for higher cognitive function (Andreasen et al., 1993). Intelligence is assumed to reflect various task demands (Andreasen et al., 1993; Flashman et al., 1997), which have been attributed to different brain regions (e.g., verbal task demands to the left inferior prefrontal and posterior temporal lobe; visuo-spatial demands to the parietal lobe; information encoding and retrieval to the hippocampus; and executive task demands including problem solving, planning, reasoning, etc. to frontal cortices). Notwithstanding, researchers have emphasized the modest nature of regional relationships: “Significant correlations ranged from 0.26 to 0.56, indicating that between 12% and 31% of the variance can be accounted for by the size of the brain or its subregions” (Andreasen et al., 1993). They argue that this relatively small amount of variance suggests that while size may be related to human intelligence, other factors must also play a role. In the sections below we introduce and discuss some other cerebral features that may account for portions of variance when assessing relationships between brain measures and intelligence.
2. Cerebral Tissue Components
The brain contains different tissue types including gray matter, white matter and cerebrospinal fluid. Quantifying the amount of gray matter gives an estimate of the density and number of neuronal bodies and dendritic expansions; quantifying white matter helps to approximate the number of axons and their degree of myelination. That is, while the amount of gray matter might reflect the capacity of information processing centers, the amount of white matter might mirror the efficiency of inter-neuronal communication. Individual intelligence might thus be related to global and/or regional tissue volumes or concentrations.
Global and regional findings of tissue-based intelligence correlates
In studies assessing associations with overall tissue volumes, the majority of data suggests that higher intelligence and/or cognitive performance scores are associated with increased gray matter volumes (Andreasen et al., 1993; Reiss et al., 1996; Gur et al., 1999; Posthuma et al., 2002; Wilke et al., 2003; Gignac et al., 2003; Frangou et al., 2004; Colom et al., 2006; Narr et al., 2007). Similarly, positive correlations between intelligence and white matter volumes have been reported (Gur et al., 1999; Schoenemann et al., 2000; Posthuma et al., 2002; Gignac et al., 2003; Narr et al., 2007). Global gray and white matter correlations are suggested to be roughly equally distributed (Gignac et al., 2003) but findings also appear to indicate that associations are stronger for gray matter in general, as demonstrated in Figure 1 (second and third panel).
To examine the correlations between intelligence and tissue volumes for cerebral subregions, prior studies have divided the brain into smaller-sized and possibly more functionally meaningful compartments. One study was based on a somewhat unusual approach that projected planes through the brain revealing different sections in each hemisphere (Reiss et al., 1996). This study detected significant positive correlations between intelligence and prefrontal gray matter volume; although arguably such an anatomical partitioning approach does not “conform well to the extensive individual differences among subjects in brain size and morphology” (Haier et al., 2004). Another study (Thompson et al., 2001) was based on manually outlining ROIs (i.e., following structure-specific boundaries and dividing the brain surface into its different lobes). In agreement with Reiss et al. (1996), this approach revealed a highly significant positive association between intellectual function and gray matter volume in the frontal cortex. Still, this method only provides gray matter correlations at the lobar level, suggesting that more spatially detailed measurements may offer greater anatomical precision.
Local findings of tissue-based intelligence correlates
In contrast to whole-brain or ROI-based methods, a fully-automated voxel-by-voxel analysis technique allows the examination of intelligence-specific relationships across the entire brain. For example, voxel-based morphometry (VBM; Ashburner and Friston, 2000) provides the means to calculate a voxel-wise correlation between tissue amounts and individual intelligence measures. Several studies have utilized this VBM approach, where the most frequently replicated positive correlations2 appear localized in the lateral and medial frontal cortex (Haier et al., 2004; Frangou et al., 2004; Haier et al., 2005; Gong et al., 2005; Colom et al., 2006) and in the (anterior) cingulate (Wilke et al., 2003; Haier et al., 2004; Frangou et al., 2004). However, less significant positive correlations also seem to exist in other medial and lateral temporal, parietal, and occipital sections, as well as subcortically and in the cerebellum. Voxel-wise positive correlations between intelligence and white matter are less common, but have been found mainly in frontal and temporal regions (Haier et al., 2004; Haier et al., 2005).
Possible functional implications
The MRI signal reflects the cellular characteristics of the brain to some degree: For example, increased gray matter might indicate more or increased density of neurons or glial cells which could allow more efficient information processing. This may lead to improved cognitive function and account for the observed positive correlations between gray matter and intelligence. However, Haier and colleagues (1988; 1992) demonstrated that intelligence measures and glucose consumption are negatively correlated, supporting the assumption that more intelligent individuals use their neurons more efficiently, and fewer neurons may not necessarily be associated with reduced cognitive performance. Thus, positive correlations between gray matter and intelligence might more closely reflect other micro-topographic features, such as the formation and usage-dependent selective elimination of synapses which help to create and sculpt neural circuitry (Shaw et al., 2006).
Similarly, positive white matter correlations may exist if increased white matter volume reflects a higher degree of myelination and thus an enhanced facilitation of neural transmission. For example, fractional anisotropy, a diffusion data-derived measure of white matter integrity, is known to correlate with full-scale IQ (Chiang et al., 2008). Still, other variables (e.g., biochemical) may also account for the observed correlation given that white matter-specific pH levels have been shown to correlate positively with intelligence (Rae et al., 1996), possibly via modulating nerve action amplitude and conduction time.
To date, the underlying biological processes accounting for tissue-specific correlations in particular brain regions and/or across the whole brain remain uncertain. Also, it remains to be established whether white matter-specific correlations are a secondary consequence of gray matter-specific correlations (or vice versa) or whether there is no general rule but, instead, region-specific mechanisms apply. Notwithstanding, the detected significant positive correlations between gray/white matter and intelligence underscore that the structural integrity of particular brain regions is important to support higher cognitive functions.
3. Cortical Thickness
The cerebral cortex holds two thirds of the brain’s neurons and thus appears to be a promising candidate for determining the primary neuroanatomical correlates of intelligence. Measures of cortical thickness range between 1.5 and 4.5 mm, and although linked with other measures of gray matter (Narr et al., 2005), they might be more closely related to intellectual abilities than volumetric or intensity-based gray matter concentration measures (Narr et al., 2007).
Global and regional findings of thickness-based intelligence correlates
There is a lack of findings concerning global or ROI-specific correlations between intelligence and cortical thickness. The cerebral cortex consists of layers of cells organized into columns that vary in depth as dependent on number and thickness of layers, the types of neurons and glial cells, and their size and density. Given that these underlying cytoarchitectural characteristics defining cortical thickness vary within different cortical regions (von Economo, 1929), possible structure-function relationships can be overlooked when correlating individual intelligence scores with averaged measures of cortical thickness (i.e., mean thickness across the entire cortex or within pre-defined regions).
Local findings of thickness-based intelligence correlates
By increasing the spatial resolution of the thickness measurement (i.e., analyzing the thickness of the cortex across thousands of surface locations) it becomes more likely that region-specific associations with individual intelligence can be detected. Although such detailed thickness measurements are now available (Fischl and Dale, 2000; Jones et al., 2000; Kabani et al., 2001; Memoli et al., 2004; Thompson et al., 2004; Lerch and Evans, 2005), to date, there are only two published reports of correlations between intelligence and local variations in cortical thickness. Using a longitudinal design, the first study (Shaw et al., 2006) revealed a developmental shift from a predominantly negative correlation in early childhood to a positive correlation in late childhood and beyond. However, when analyzing all age groups combined, the authors detected modest and non-significant positive correlations throughout most of the frontal, parietal and occipital cortex, and similarly non-significant negative correlations in the anterior temporal cortex. The authors thus concluded that “the trajectory of change in the thickness of the cerebral cortex, rather than cortical thickness itself, is most closely related to level of intelligence.” In contrast, prominent correlations between full-scale intelligence and cortical thickness were revealed in a number of regions in a recently published study in adults (Narr et al., 2007). The authors reported significant positive correlations between intelligence and cortical thickness across the lateral surface (i.e., prefrontal cortex and inferior temporal gyrus) and medial surface (i.e., fusiform gyrus and hippocampal cortex) (Figure 2). The findings of positive correlations in prefrontal and temporal cortical regions in adult subjects are consistent with the cross-sectional thickness results of Shaw and colleagues (2006) within the late-adolescent and early-adulthood age groups and with gray matter-specific correlations in frontal regions, as analyzed with VBM (Haier et al., 2004; Frangou et al., 2004; Haier et al., 2005).
Figure 2.
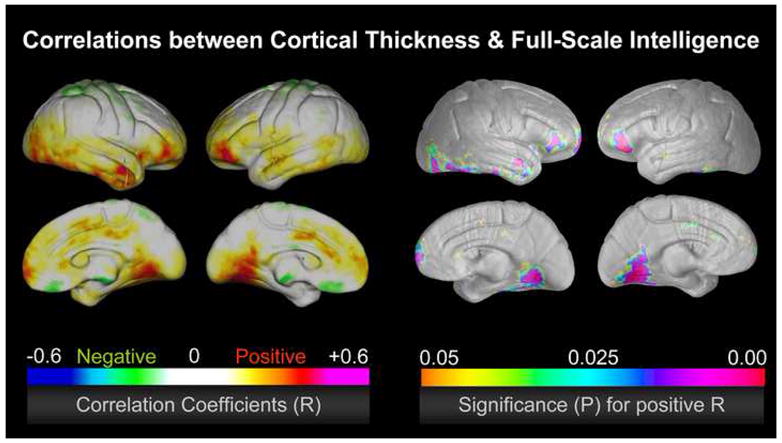
Correlations between cortical thickness and full-scale intelligence in a sample of 65 healthy subjects, after removing the partial effects of sex and age (Narr et al., 2007). The left color bar encodes the r-values that depict the magnitude and direction of correlations; the right color bar encodes the significance (p) associated with the positive correlations, where significance was confirmed by permutation testing (p<0.01) in frontal and temporal regions. Significant negative correlations were completely absent.
Possible functional implications
An analysis by Kruggel and colleagues (2003) revealed a high correspondence between MRI-based intensity profiles and cytometry-based descriptions of the local layer structure and cytoarchitectonic fields, but the exact underlying architecture of increased cortical thickness and how it contributes towards higher intelligence still remains to be established (see discussion with respect to gray matter). Although the observed correlations in prefrontal areas support the idea of a frontal-lobe network consistently recruited for problem solving, planning, sequencing, reasoning, and judgment (Duncan and Owen, 2000; Duncan et al., 2000) other brain regions are shown to contribute to individual intellectual abilities as well. For example, Narr and colleagues (2007) argue with respect to their significant thickness-based correlations observed in the temporal cortex that “cortical association area 37 […] participates in the analysis of visual form, motion, and the representation of objects”. Observations of specific links between cortical thickness and intelligence in this region (and within proximal visual association area 36) suggest that variations in cortical thickness influence visual analysis abilities, which are integral to cognitive processing.
4. Cortical Convolution
Over the course of evolution, the cerebral cortex has grown considerably in surface area, which seems to be not only the result of a larger brain but, perhaps more importantly, of an increased folding of the brain’s surface. It has been suggested that the high degree of cortical gyrification in humans may be a morphological substrate that supports some of our species’ most distinctive cognitive abilities. Consequently, individual intelligence within the human species might be modulated by the degree of cortical convolution.
Global and regional findings of convolution-based intelligence correlates
To our knowledge, there is no information on relationships between intelligence and global whole-brain or regional measures of cortical convolution. Traditional two-dimensional methods (e.g., Zilles et al., 1988) can estimate a gyrification index (i.e. the ratio between deep and superficial cortex in coronal sections) and even more sophisticated mesh-based techniques (e.g., Thompson et al., 1996a; Thompson et al., 1996b; Magnotta et al., 1999) make it possible to investigate three-dimensional cortical and surface complexity in particular ROIs. Even so, these methods may lack the spatial resolution necessary to reveal significant relationships.
Local findings of convolution-based intelligence correlates
A recently introduced approach (Luders et al., 2006b) has allowed for a point-specific estimation of cortical convolution and was based on the calculation of mean curvature (Do Carmo, 1976) at 65,536 vertex points across the lateral and medial cortical surface. When assessing relationships between cortical convolution and full-scale intelligence, statistically significant positive correlations were detected within the left temporo-occipital lobe, particularly in the outermost section of the posterior cingulate gyrus (retrosplenial areas) (Luders et al., 2007a) (Figure 3). Although comparable data with respect to local convolution do not exist, this observation supports previous in vivo and post mortem findings of predominantly positive associations between intelligence and brain morphology in general. Moreover, it agrees with findings based on phylogenetic research, where brains of larger primates (who, presumably, are more intelligent) are more highly folded than smaller primate brains (Zilles et al., 1989; Rilling and Insel, 1999). In addition, cortical convolution was reported to increase more rapidly with brain size among later evolved (and likely more intelligent) primates compared with earlier evolved primates (Zilles et al., 1988; 1989). Finally, the regional specificity of these observed convolution-based correlations are in agreement with findings of thickness-based correlations in similar temporo-occipital regions across the medial cortical surface (Narr et al., 2007).
Figure 3.
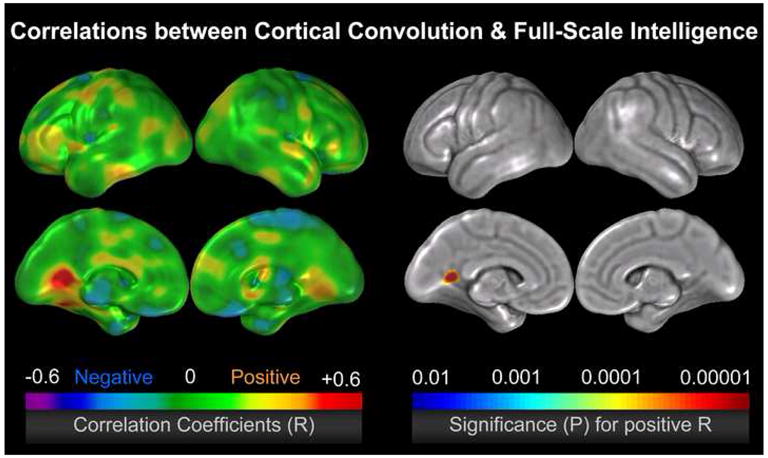
Correlations between cortical convolution and full-scale intelligence in a sample of 65 healthy subjects, after removing the partial effects of age (Luders et al., 2007a). The left color bar encodes the r-values that depict the magnitude and direction of correlations; the right color bar encodes the significance (p) associated with the positive correlations (p<0.05, corrected, using the false discovery rate method). Significant negative correlations were completely absent.
Possible functional implications
The regional degree and pattern of the convolution of the cortex has been suggested to reflect regional interconnectivity or neuronal circuitry (Caviness, Jr., 1975; Goldman-Rakic, 1981; Rakic, 1988; Watson et al., 1993; Rademacher et al., 1993; Roland and Zilles, 1994; Van Essen, 1997). Thus, certain architectonic constellations in the retrosplenial area – their precise nature remains to be established – might benefit intellectual abilities. In support of this hypothesis, the temporo-occipital region of the medial cortex was suggested recently to be fundamental in determining individual differences in intelligence “by serving as a brain site in which higher-order language-based concepts converge with the incoming visual information stream” (Haier et al., 2003). In addition, this region might be an important contributor towards individual intelligence via modulating pathways to (pre)frontal regions. These assumptions corroborate a recently proposed theory – The Parieto-Frontal Integration Theory (P-FIT) of intelligence (Jung and Haier, 2007) highlighting the integration of anterior and posterior brain regions in most intelligence research.
5. The Corpus Callosum
The corpus callosum (CC) is a white matter structure and the largest commissure in the human brain, connecting the two hemispheres through more than 200 million fibers. The midsagittal callosal area is an indicator of the total number of small diameter fibers within the CC (Aboitiz et al., 1992). Since small diameter fibers are particularly involved in transferring higher-order cognitive information (Aboitiz, 1992), callosal morphology may reflect the capacity for inter-hemispheric processes that modulate intellectual abilities.
Global and segment-specific findings of callosal intelligence correlates
There is a large pool of studies where associations between cognitive abilities and callosal characteristics were examined in samples with neurological conditions, developmental disabilities and disorders, or diseases. The majority of these studies report positive correlations, with larger callosal area measurements being associated with better cognitive performance (Fletcher et al., 1992; Strauss et al., 1994; Atkinson, Jr. et al., 1996; Spencer et al., 2005; Schatz and Buzan, 2006). Although most of these studies examined correlations with total callosal size (measured as callosal area across the whole midsagittal section), a few conducted more specific analyses by subdividing the midsagittal section of the CC into macroscopic subregions according to parcellation schemes (e.g., Witelson, 1989). Here, the CC is arbitrarily divided into several sections suggested to correspond to a certain topographic organization and functional boundaries. Measuring segmental subunits (in contrast to evaluating the CC as a whole) allows more precise conclusions with respect to the relevance of callosal sections and interconnected homotopic cortical regions for higher cognitive functions. However, traditional parcellation schemes have recently generated some controversy with respect to the assumed topography of callosal fibers, where for example callosal motor fiber bundles were found to cross the CC in a much more posterior location than previously indicated (Hofer and Frahm, 2006).
Local findings of callosal intelligence correlates
Some newer studies try to circumvent the pitfalls associated with callosal segmentation; they can map relationships between callosal characteristics and intelligence with high spatial resolution without relying on pre-defined areas. As described above, VBM provides voxel-wise estimators of local tissue concentration throughout the whole brain but existing VBM studies did not detect white matter correlates of intelligence in the region of the CC (Haier et al., 2004; Haier et al., 2005). A different high-resolution approach – based on anatomical mesh-based geometrical modeling (Thompson et al., 1996a; Thompson et al., 1996b; Thompson et al., 1997) – provides point-wise distance measures and was applied to correlate intelligence and callosal thickness at 100 points across the whole callosal surface (Luders et al., 2006a). This approach revealed significant positive correlations between callosal thickness and full-scale IQ in several callosal regions (Luders et al., 2007b). Correlations were most significant at the border between posterior body and isthmus but extended farther anterior (covering almost the entire posterior body) and also farther posterior (covering the remainder of the isthmus and anterior sections of the splenium). In addition, another smaller region at the border between anterior third and anterior body was detected to exhibit positive correlations (Figure 4). These findings are in agreement with previous global or segment-specific results indicating positive correlations between callosal area size and cognitive measurements in non-normative samples (Fletcher et al., 1992; Strauss et al., 1994; Atkinson, Jr. et al., 1996; Spencer et al., 2005; Schatz and Buzan, 2006).
Figure 4.
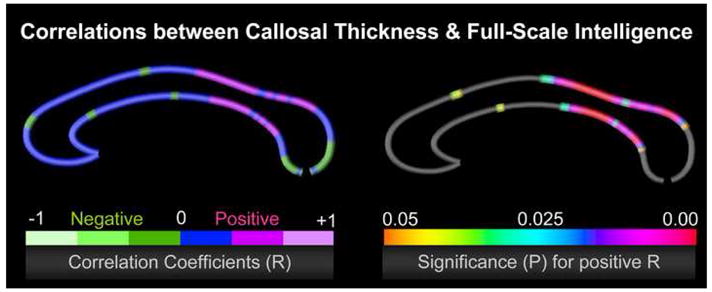
Correlations between callosal thickness and full-scale intelligence in a sample of 62 healthy subjects, after removing the partial effects of brain volume (Luders et al., 2006a). The left color bar encodes the r-values that depict the magnitude and direction of correlations; the right color bar encodes the significance (p) associated with the positive correlations, where significance was confirmed by permutation testing (p<0.05). Significant negative correlations were completely absent.
Possible functional implications
Positive correlations between callosal thickness and full-scale IQ may indicate that additional or better-myelinated callosal pathways facilitate a more efficient inter-hemispheric information transfer, which is likely to benefit the integration and processing of information and positively affect intellectual performance (Luders et al., 2007b). At the same time, local variations in callosal thickness (and their correlations with intelligence) might also partly reflect the relevance of topographically connected cortical regions for processing higher-order cognitive information (e.g., the posterior association cortex). Although precise anatomical boundaries of higher-order networks are vaguely defined and proposed maps of callosal connectivity lack consistency (Witelson, 1989; Zarei et al., 2006; Hofer and Frahm, 2006), these findings suggest that inter-hemispheric communication mediated by the CC in posterior parietal as well as occipital association regions appears to be fundamental in determining individual differences in intelligence. Further support for the involvement of not only anterior but also posterior brains regions comes from a functional study designed to examine the neural bases for intellectual giftedness (superior-g) in adolescents (Lee et al., 2006). Here the authors concluded that superior-g may be achieved due to facilitation of the fronto-parietal network particularly driven by the posterior parietal activation. This claim is also in agreement with the above mentioned theory by Jung and Haier (2007) as well as with findings discussed throughout this article suggesting that variations in a widely distributed network throughout the brain predict individual differences in intelligence.
6. Future Developments
Modern neuroimaging methods have contributed considerably to our understanding of the neurobiology of intelligence. In addition to structural MRI (which constituted the main focus of this article) other imaging techniques will further contribute to elucidating the physical correlates of human intelligence and have the potential to resolve how structural, physiological, histological, or neuro-chemical characteristics of the brain are interrelated. Systematically combining structural MRI with functional MRI (fMRI) or with positron emission tomography (PET) could add information regarding whether more or less tissue in a particular region is associated with more or less activation during a given cognitive task. Moreover, applying magnetic resonance spectroscopy (MRS) in combination with structural MRI or with diffusion tensor imaging (DTI) could help to clarify how regional concentrations of particular neurometabolites are related to other white matter measurement (e.g., fractional anisotropy; concentration; volume). Last but not least, imaging genomics could provide unprecedented opportunities to establish common biological determinants for both brain structure and higher cognitive function. The development of such methods allowing cross-correlation of region-specific measurements will be a valuable step in the still-emerging field linking brain anatomy with intelligence.
Footnotes
Obviously, intelligence is not driven by global enlargement per se but by some optimal size increase that represents the importance of size × intelligence relationships. For example, macrocephaly (without any identifiable developmental errors) occurs more frequently in autism where intellectual abilities are compromised. The discussed findings in this article are mainly based on healthy samples; thus we will abstain from using the phrase “optimally” increased (which is what we mean) to simplify matters.
To our knowledge, only one VBM study analyzing the relationship between brain tissue and intelligence has reported significant negative correlations that were observed for gray matter density in the caudate nucleus (Frangou et al., 2004).
Publisher's Disclaimer: This is a PDF file of an unedited manuscript that has been accepted for publication. As a service to our customers we are providing this early version of the manuscript. The manuscript will undergo copyediting, typesetting, and review of the resulting proof before it is published in its final citable form. Please note that during the production process errors may be discovered which could affect the content, and all legal disclaimers that apply to the journal pertain.
References
- 1.Aboitiz F. Brain connections: interhemispheric fiber systems and anatomical brain asymmetries in humans. Biol Res. 1992;25:51–61. [PubMed] [Google Scholar]
- 2.Aboitiz F, Scheibel AB, Fisher RS, Zaidel E. Fiber composition of the human corpus callosum. Brain Res. 1992;598:143–153. doi: 10.1016/0006-8993(92)90178-c. [DOI] [PubMed] [Google Scholar]
- 3.Andreasen NC, Flaum M, Swayze V, O’Leary DS, Alliger R, Cohen G, Ehrhardt J, Yuh WT. Intelligence and brain structure in normal individuals. Am J Psychiatry. 1993;150:130–134. doi: 10.1176/ajp.150.1.130. [DOI] [PubMed] [Google Scholar]
- 4.Ashburner J, Friston KJ. Voxel-based morphometry--the methods. Neuroimage. 2000;11:805–821. doi: 10.1006/nimg.2000.0582. [DOI] [PubMed] [Google Scholar]
- 5.Atkinson DS, Jr, bou-Khalil B, Charles PD, Welch L. Midsagittal corpus callosum area, intelligence, and language dominance in epilepsy. J Neuroimaging. 1996;6:235–239. doi: 10.1111/jon199664235. [DOI] [PubMed] [Google Scholar]
- 6.Caviness VS., Jr Mechanical model of brain convolutional development. Science. 1975;189:18–21. doi: 10.1126/science.1135626. [DOI] [PubMed] [Google Scholar]
- 7.Chiang MC, Barysheva M, Lee AD, Madsen SK, Klunder AD, Toga AW, McMahon K, de Zubicaray GI, Meredith M, Wright MJ, Scrivastava A, Balov N, Thompson PM. Brain Fiber Architecture, Genetics, and Intelligence: A High Angular Resolution Diffusion Imaging (HARDI) Study. MICCAI. 2008 doi: 10.1007/978-3-540-85988-8_126. [DOI] [PMC free article] [PubMed] [Google Scholar]
- 8.Colom R, Jung RE, Haier RJ. Distributed brain sites for the g-factor of intelligence. Neuroimage. 2006;31:1359–1365. doi: 10.1016/j.neuroimage.2006.01.006. [DOI] [PubMed] [Google Scholar]
- 9.Crivellato E, Ribatti D. Soul, mind, brain: Greek philosophy and the birth of neuroscience. Brain Res Bull. 2007;71:327–336. doi: 10.1016/j.brainresbull.2006.09.020. [DOI] [PubMed] [Google Scholar]
- 10.Do Carmo MP. Differential Geometry of Curves and Surfaces. 1976. [Google Scholar]
- 11.Duncan J, Owen AM. Common regions of the human frontal lobe recruited by diverse cognitive demands. Trends Neurosci. 2000;23:475–483. doi: 10.1016/s0166-2236(00)01633-7. [DOI] [PubMed] [Google Scholar]
- 12.Duncan J, Seltz RJ, Kolodny J, Bor D, Herzog H, Ahmed A, Newell FN, Emslie H. A neural basis for general intelligence. Am J Ophthalmol. 2000;130:687. doi: 10.1016/s0002-9394(00)00752-2. [DOI] [PubMed] [Google Scholar]
- 13.Fischl B, Dale AM. Measuring the thickness of the human cerebral cortex from magnetic resonance images. Proc Natl Acad Sci USA. 2000;97:11050–11055. doi: 10.1073/pnas.200033797. [DOI] [PMC free article] [PubMed] [Google Scholar]
- 14.Flashman LA, Andreasen NC, Flaum M, Swayze VW. Intelligence and regional brain volumes in normal controls. Intelligence. 1997;25:149–160. [Google Scholar]
- 15.Fletcher JM, Bohan TP, Brandt ME, Brookshire BL, Beaver SR, Francis DJ, Davidson KC, Thompson NM, Miner ME. Cerebral white matter and cognition in hydrocephalic children. Arch Neurol. 1992;49:818–824. doi: 10.1001/archneur.1992.00530320042010. [DOI] [PubMed] [Google Scholar]
- 16.Frangou S, Chitins X, Williams SC. Mapping IQ and gray matter density in healthy young people. Neuroimage. 2004;23:800–805. doi: 10.1016/j.neuroimage.2004.05.027. [DOI] [PubMed] [Google Scholar]
- 17.Gignac GE, Vernon PA, Wickett JC. Factors influencing the relationship between brain size and intelligence. In: Nyborg H, editor. The Scientific Study of General Intelligence: Tribute to Arthur R. Jensen. Oxford; Pergamon: 2003. [Google Scholar]
- 18.Goldman-Rakic PS. Prenatal formation of cortical input and development of cytoarchitectonic compartments in the neostriatum of the rhesus monkey. J Neurosci. 1981;1:721–735. doi: 10.1523/JNEUROSCI.01-07-00721.1981. [DOI] [PMC free article] [PubMed] [Google Scholar]
- 19.Gong QY, Sluming V, Mayes A, Keller S, Barrick T, Cezayirli E, Roberts N. Voxel-based morphometry and stereology provide convergent evidence of the importance of medial prefrontal cortex for fluid intelligence in healthy adults. Neuroimage. 2005;25:1175–1186. doi: 10.1016/j.neuroimage.2004.12.044. [DOI] [PubMed] [Google Scholar]
- 20.Gray JR, Thompson PM. Neurobiology of intelligence: science and ethics. Nat Rev Neurosci. 2004;5:471–482. doi: 10.1038/nrn1405. [DOI] [PubMed] [Google Scholar]
- 21.Gur RC, Turetsky BI, Matsui M, Yan M, Bilker W, Hughett P, Gur RE. Sex differences in brain gray and white matter in healthy young adults: correlations with cognitive performance. J Neurosci. 1999;19:4065–4072. doi: 10.1523/JNEUROSCI.19-10-04065.1999. [DOI] [PMC free article] [PubMed] [Google Scholar]
- 22.Haier RJ, Jung RE, Yeo RA, Head K, Alkire MT. Structural brain variation and general intelligence. Neuroimage. 2004;23:425–433. doi: 10.1016/j.neuroimage.2004.04.025. [DOI] [PubMed] [Google Scholar]
- 23.Haier RJ, Jung RE, Yeo RA, Head K, Alkire MT. The neuroanatomy of general intelligence: sex matters. Neuroimage. 2005;25:320–327. doi: 10.1016/j.neuroimage.2004.11.019. [DOI] [PubMed] [Google Scholar]
- 24.Haier RJ, Siegel BV, Jr, MacLachlan A, Soderling E, Lottenberg S, Buchsbaum MS. Regional glucose metabolic changes after learning a complex visuospatial/motor task: a positron emission tomographic study. Brain Res. 1992;570:134–143. doi: 10.1016/0006-8993(92)90573-r. [DOI] [PubMed] [Google Scholar]
- 25.Haier RJ, Siegel BV, Nuechterlein KH, Hazlett E, Wu JC, Peak J, Browning HL, Buchsbaum MS. Cortical glucose metabolic rate correlates of abstract reasoning and attention studied with Positron Emission Tomography. Intelligence. 1988;11:199–218. [Google Scholar]
- 26.Haier RJ, White NS, Alkire MT. Individual differences in general intelligence correlate with brain function during nonreasoning tasks. Intelligence. 2003;31:429–441. [Google Scholar]
- 27.Hofer S, Frahm J. Topography of the human corpus callosum revisited--comprehensive fiber tractography using diffusion tensor magnetic resonance imaging. Neuroimage. 2006;32:989–994. doi: 10.1016/j.neuroimage.2006.05.044. [DOI] [PubMed] [Google Scholar]
- 28.Jones SE, Buchbinder BR, Aharon I. Three-dimensional mapping of cortical thickness using Laplace’s equation. Hum Brain Mapp. 2000;11:12–32. doi: 10.1002/1097-0193(200009)11:1<12::AID-HBM20>3.0.CO;2-K. [DOI] [PMC free article] [PubMed] [Google Scholar]
- 29.Jung RE, Haier RJ. The Parieto-Frontal Integration Theory (P-FIT) of Intelligence: Converging Neuroimaging Evidence. Behavioral and Brain Sciences. 2007;30 doi: 10.1017/S0140525X07001185. [DOI] [PubMed] [Google Scholar]
- 30.Kabani N, Le GG, MacDonald D, Evans AC. Measurement of cortical thickness using an automated 3-D algorithm: a validation study. Neuroimage. 2001;13:375–380. doi: 10.1006/nimg.2000.0652. [DOI] [PubMed] [Google Scholar]
- 31.Kruggel F, Bruckner MK, Arendt T, Wiggins CJ, von Cramon DY. Analyzing the neocortical fine-structure. Med Image Anal. 2003;7:251–264. doi: 10.1016/s1361-8415(03)00006-9. [DOI] [PubMed] [Google Scholar]
- 32.Lee KH, Choi YY, Gray JR, Cho SH, Chae JH, Lee S, Kim K. Neural correlates of superior intelligence: stronger recruitment of posterior parietal cortex. Neuroimage. 2006;29:578–586. doi: 10.1016/j.neuroimage.2005.07.036. [DOI] [PubMed] [Google Scholar]
- 33.Lerch JP, Evans AC. Cortical thickness analysis examined through power analysis and a population simulation. Neuroimage. 2005;24:163–173. doi: 10.1016/j.neuroimage.2004.07.045. [DOI] [PubMed] [Google Scholar]
- 34.Luders E, Narr K, Bilder RM, Szeszko P, Gurbani M, Hamilton L, Toga A, Gaser C. Mapping the Relationship between Cortical Convolution and Intelligence: Effects of Gender. Submitted to Cerebral Cortex. 2007a doi: 10.1093/cercor/bhm227. [DOI] [PMC free article] [PubMed] [Google Scholar]
- 35.Luders E, Narr KL, Bilder RM, Thompson PM, Szeszko PR, Hamilton L, Toga AW. Positive correlations between corpus callosum thickness and intelligence. Neuroimage. 2007b;37:1457–1464. doi: 10.1016/j.neuroimage.2007.06.028. [DOI] [PMC free article] [PubMed] [Google Scholar]
- 36.Luders E, Narr KL, Zaidel E, Thompson PM, Jancke L, Toga AW. Parasagittal asymmetries of the corpus callosum. Cereb Cortex. 2006a;16:346–354. doi: 10.1093/cercor/bhi112. [DOI] [PubMed] [Google Scholar]
- 37.Luders E, Thompson PM, Narr KL, Toga AW, Jancke L, Gaser C. A curvature-based approach to estimate local gyrification on the cortical surface. Neuroimage. 2006b;29:1224–1230. doi: 10.1016/j.neuroimage.2005.08.049. [DOI] [PubMed] [Google Scholar]
- 38.MacLullich AM, Ferguson KJ, Deary IJ, Seckl JR, Starr JM, Wardlaw JM. Intracranial capacity and brain volumes are associated with cognition in healthy elderly men. Neurology. 2002;59:169–174. doi: 10.1212/wnl.59.2.169. [DOI] [PubMed] [Google Scholar]
- 39.Magnotta VA, Andreasen NC, Schultz SK, Harris G, Cizadlo T, Heckel D, Nopoulos P, Flaum M. Quantitative in vivo measurement of gyrification in the human brain: changes associated with aging. Cereb Cortex. 1999;9:151–160. doi: 10.1093/cercor/9.2.151. [DOI] [PubMed] [Google Scholar]
- 40.McDaniel MA. Big-brained people are smarter: A meta-analysis of the relationship between in vivo brain volume and intelligence. Intelligence. 2005;33:337–346. [Google Scholar]
- 41.Memoli F, Sapiro G, Thompson P. Implicit brain imaging. Neuroimage. 2004;23(Suppl 1):S179–S188. doi: 10.1016/j.neuroimage.2004.07.072. [DOI] [PubMed] [Google Scholar]
- 42.Narr KL, Bilder RM, Toga AW, Woods RP, Rex DE, Szeszko PR, Robinson D, Sevy S, Gunduz-Bruce H, Wang YP, DeLuca H, Thompson PM. Mapping cortical thickness and gray matter concentration in first episode schizophrenia. Cereb Cortex. 2005;15:708–719. doi: 10.1093/cercor/bhh172. [DOI] [PubMed] [Google Scholar]
- 43.Narr KL, Woods RP, Thompson PM, Szeszko P, Robinson D, Dimtcheva T, Gurbani M, Toga AW, Bilder RM. Relationships between IQ and regional cortical gray matter thickness in healthy adults. Cereb Cortex. 2007;17:2163–2171. doi: 10.1093/cercor/bhl125. [DOI] [PubMed] [Google Scholar]
- 44.Posthuma D, de Geus EJ, Baare WF, Hulshoff Pol HE, Kahn RS, Boomsma DI. The association between brain volume and intelligence is of genetic origin. Nat Neurosci. 2002;5:83–84. doi: 10.1038/nn0202-83. [DOI] [PubMed] [Google Scholar]
- 45.Rademacher J, Caviness VS, Jr, Steinmetz H, Galaburda AM. Topographical variation of the human primary cortices: implications for neuroimaging, brain mapping, and neurobiology. Cereb Cortex. 1993;3:313–329. doi: 10.1093/cercor/3.4.313. [DOI] [PubMed] [Google Scholar]
- 46.Rae C, Scott RB, Thompson CH, Kemp GJ, Dumughn I, Styles P, Tracey I, Radda GK. Is pH a biochemical marker of IQ? Proc Biol Sci. 1996;263:1061–1064. doi: 10.1098/rspb.1996.0156. [DOI] [PubMed] [Google Scholar]
- 47.Rakic P. Specification of cerebral cortical areas. Science. 1988;241:170–176. doi: 10.1126/science.3291116. [DOI] [PubMed] [Google Scholar]
- 48.Reiss AL, Abrams MT, Singer HS, Ross JL, Denckla MB. Brain development, gender and IQ in children. A volumetric imaging study. Brain. 1996;119 ( Pt 5):1763–1774. doi: 10.1093/brain/119.5.1763. [DOI] [PubMed] [Google Scholar]
- 49.Rilling JK, Insel TR. The primate neocortex in comparative perspective using magnetic resonance imaging. J Hum Evol. 1999;37:191–223. doi: 10.1006/jhev.1999.0313. [DOI] [PubMed] [Google Scholar]
- 50.Roland PE, Zilles K. Brain atlases--a new research tool. Trends Neurosci. 1994;17:458–467. doi: 10.1016/0166-2236(94)90131-7. [DOI] [PubMed] [Google Scholar]
- 51.Schatz J, Buzan R. Decreased corpus callosum size in sickle cell disease: relationship with cerebral infarcts and cognitive functioning. J Int Neuropsychol Soc. 2006;12:24–33. doi: 10.1017/S1355617706060085. [DOI] [PubMed] [Google Scholar]
- 52.Schoenemann PT, Budinger TF, Sarich VM, Wang WS. Brain size does not predict general cognitive ability within families. Proc Natl Acad Sci USA. 2000;97:4932–4937. doi: 10.1073/pnas.97.9.4932. [DOI] [PMC free article] [PubMed] [Google Scholar]
- 53.Shaw P, Greenstein D, Lerch J, Clasen L, Lenroot R, Gogtay N, Evans A, Rapoport J, Giedd J. Intellectual ability and cortical development in children and adolescents. Nature. 2006;440:676–679. doi: 10.1038/nature04513. [DOI] [PubMed] [Google Scholar]
- 54.Spencer MD, Gibson RJ, Moorhead TW, Keston PM, Hoare P, Best JJ, Lawrie SM, Johnstone EC. Qualitative assessment of brain anomalies in adolescents with mental retardation. AJNR Am J Neuroradiol. 2005;26:2691–2697. [PMC free article] [PubMed] [Google Scholar]
- 55.Strauss E, Wada J, Hunter M. Callosal morphology and performance on intelligence tests. J Clin Exp Neuropsychol. 1994;16:79–83. doi: 10.1080/01688639408402618. [DOI] [PubMed] [Google Scholar]
- 56.Thompson PM, Cannon TD, Narr KL, van Erp T, Poutanen VP, Huttunen M, Lonnqvist J, Standertskjold-Nordenstam CG, Kaprio J, Khaledy M, Dail R, Zoumalan CI, Toga AW. Genetic influences on brain structure. Nat Neurosci. 2001;4:1253–1258. doi: 10.1038/nn758. [DOI] [PubMed] [Google Scholar]
- 57.Thompson PM, Hayashi KM, Sowell ER, Gogtay N, Giedd JN, Rapoport JL, de Zubicaray GI, Janke AL, Rose SE, Semple J, Doddrell DM, Wang Y, van Erp TG, Cannon TD, Toga AW. Mapping cortical change in Alzheimer’s disease, brain development, and schizophrenia. Neuroimage. 2004;23(Suppl 1):S2–18. doi: 10.1016/j.neuroimage.2004.07.071. [DOI] [PubMed] [Google Scholar]
- 58.Thompson PM, MacDonald D, Mega MS, Holmes CJ, Evans AC, Toga AW. Detection and mapping of abnormal brain structure with a probabilistic atlas of cortical surfaces. J Comput Assist Tomogr. 1997;21:567–581. doi: 10.1097/00004728-199707000-00008. [DOI] [PubMed] [Google Scholar]
- 59.Thompson PM, Schwartz C, Lin RT, Khan AA, Toga AW. Three-dimensional statistical analysis of sulcal variability in the human brain. J Neurosci. 1996a;16:4261–4274. doi: 10.1523/JNEUROSCI.16-13-04261.1996. [DOI] [PMC free article] [PubMed] [Google Scholar]
- 60.Thompson PM, Schwartz C, Toga AW. High-resolution random mesh algorithms for creating a probabilistic 3D surface atlas of the human brain. Neuroimage. 1996b;3:19–34. doi: 10.1006/nimg.1996.0003. [DOI] [PubMed] [Google Scholar]
- 61.Toga AW, Thompson PM. Genetics of brain structure and intelligence. Annu Rev Neurosci. 2005;28:1–23. doi: 10.1146/annurev.neuro.28.061604.135655. [DOI] [PubMed] [Google Scholar]
- 62.Van Essen DC. A tension-based theory of morphogenesis and compact wiring in the central nervous system. Nature. 1997;385:313–318. doi: 10.1038/385313a0. [DOI] [PubMed] [Google Scholar]
- 63.von Economo C. The cytoarchitectonics of the human cerebral cortex. Oxford University Press; London: 1929. [Google Scholar]
- 64.Watson JD, Myers R, Frackowiak RS, Hajnal JV, Woods RP, Mazziotta JC, Shipp S, Zeki S. Area V5 of the human brain: evidence from a combined study using positron emission tomography and magnetic resonance imaging. Cereb Cortex. 1993;3:79–94. doi: 10.1093/cercor/3.2.79. [DOI] [PubMed] [Google Scholar]
- 65.Wickett JC, Vernon PA, Lee DH. Relationships between factors of intelligence and brain volume. Personality and Individual Differences. 2000;29:1095–1122. [Google Scholar]
- 66.Wilke M, Sohn JH, Byars AW, Holland SK. Bright spots: correlations of gray matter volume with IQ in a normal pediatric population. Neuroimage. 2003;20:202–215. doi: 10.1016/s1053-8119(03)00199-x. [DOI] [PubMed] [Google Scholar]
- 67.Witelson SF. Hand and sex differences in the isthmus and genu of the human corpus callosum. A postmortem morphological study. Brain. 1989;112 ( Pt 3):799–835. doi: 10.1093/brain/112.3.799. [DOI] [PubMed] [Google Scholar]
- 68.Witelson SF, Beresh H, Kigar DL. Intelligence and brain size in 100 postmortem brains: sex, lateralization and age factors. Brain. 2006;129:386–398. doi: 10.1093/brain/awh696. [DOI] [PubMed] [Google Scholar]
- 69.Zarei M, Johansen-Berg H, Smith S, Ciccarelli O, Thompson AJ, Matthews PM. Functional anatomy of interhemispheric cortical connections in the human brain. J Anat. 2006;209:311–320. doi: 10.1111/j.1469-7580.2006.00615.x. [DOI] [PMC free article] [PubMed] [Google Scholar]
- 70.Zilles K, Armstrong E, Moser KH, Schleicher A, Stephan H. Gyrification in the cerebral cortex of primates. Brain Behav Evol. 1989;34:143–150. doi: 10.1159/000116500. [DOI] [PubMed] [Google Scholar]
- 71.Zilles K, Armstrong E, Schleicher A, Kretschmann HJ. The human pattern of gyrification in the cerebral cortex. Anat Embryol (Berl) 1988;179:173–179. doi: 10.1007/BF00304699. [DOI] [PubMed] [Google Scholar]