Abstract
Recently, the Highly Constrained BackPRojection (HYPR) and HYPR with Local Reconstruction (HYPR LR) methods have been introduced to reconstruct magnitude images from a series of highly undersampled data while preserving high spatial and temporal resolution and high SNR in applications with spatiotemporal correlations. However, these conventional HYPR algorithms are limited to the generation of magnitude images and, therefore, have limitations in their potential applications. In this work, the HYPR LR algorithm has been modified to extend the use of algorithms in the HYPR family to applications that require processing of complex data, such as MR chemical shift imaging (CSI), or spectroscopic imaging. The proposed method processes the magnitude information the same way as in original HYPR LR processing. In addition, it improves the phase images by subtracting the phase map of a synthesized composite image. The feasibility and efficiency of this algorithm has been demonstrated on CSI of cortical bone, Achilles tendon and a healthy volunteer on a clinical 3T scanner.
Keywords: UTESI, HYPR LR, Spectroscopy, Projection Reconstruction
INTRODUCTION
Cortical bone in the mature skeleton has a very short T2* and its signal is typically not detectable with conventional MR sequences (1). The T2* of cortical bone is about 200 to 500 μs, while the shortest echo times (TE) achievable with conventional spin-warp sequences is usually several milliseconds. This leads to the typical dark appearance of bone and prohibits the evaluation of its T2*. One approach to acquire detectable signal from short T2* tissue is the use of the ultrashort TE (UTE) sequences (1-5). UTE imaging employs a novel type of slice selection, rapid transmit/receive switching, radial mapping of k-space, and variable-rate selective excitation in order to start signal acquisition almost immediately after rf excitation (< 10 μs). In addition, suppression of signals from long T2* tissue is usually utilized to achieve better visualization of bone.
While UTE sequences can be effective in providing anatomical information, further diagnostic information can be gained by combining UTE with spectroscopic methods (UTESI) (6). In UTESI, images are acquired at progressively increasing TEs with a UTE sequence. As in echo-planar spectroscopic imaging (EPSI) (7,8), performing a Fourier transform on the imaging series over various TEs will generate a corresponding spectroscopic image series with high spatial resolution and low spectral resolution. This chemical shift imaging (CSI) has been used for the separation of fat and water and the extraction of other metabolic information including the study of bone disease in humans (2,6,9).
However, due to limits in acceptable patient scan time, the spatial and temporal resolutions are compromised if images at all the TEs are fully sampled. One approach to accelerate the imaging process is the use of radial undersampling. In projection reconstruction (PR), the spatial resolution is determined by the readout resolution alone and the number of projections can be reduced without a direct loss in resolution. However, the cost of the angular undersampling is a decreased signal-to-noise ratio (SNR) and apparent streak artifacts that can be tolerable in certain imaging applications. Therefore, novel reconstruction methods that can reduce streak artifacts and maintain a high SNR for each TE image would be desirable, such as view sharing of high spatial frequencies (10-12), but it causes increased temporal window due to the use of high frequency data from neighboring frames (13).
Recently, the Highly Constrained BackPRojection (HYPR) (14) technique has been proposed to allow for high undersampling while maintaining waveform fidelity in dynamic contrast-enhanced MR angiography (CE-MRA) and high SNR in the individual time frames, reducing the artifact level and providing high spatial and temporal resolution. HYPR LR (HYPR with Local Reconstruction) represents a variation of this approach, and has been shown to have improved waveform fidelity (15). While HYPR was originally developed for time series in dynamic imaging, it can be applied to other image series that share information among the series, such as UTESI. For example, each echo image can be treated as a “time frame” as in MRA and the composite image can be made by summing over all or a subset of the echo images. However, the current HYPR-like algorithms are inherently limited to the processing of magnitude images only. Therefore, they are not suitable for applications requiring the processing of complex data, such as CSI.
In this work, we present a version of the HYPR LR algorithm, which is an intrinsically complex reconstruction method providing all the benefits of HYPR LR in the magnitude domain and streak reduction in the phase domain. This approach was validated in numerical phantom simulations, and then demonstrated by in vitro experiments and an in vivo volunteer study using the UTESI technique. A series of echo images were acquired, starting from the minimal TE achievable with progressively increasing and equally-spaced TEs. The gradient diagram for the UTESI pulse sequence used in this paper is described in detail in Ref. (6).
METHODS
Theory
The proposed complex HYPR LR method, as shown in Fig. 1, is an extension of the original HYPR LR algorithm and can be performed in three steps: 1) Each undersampled TE image is reconstructed using Filtered BackProjection (FBP), resulting in images with low SNR and dominating streak artifacts. 2) A composite image is generated using either all or a subset of TE images and a weighting image is calculated by normalizing the lowpass filtered current TE image by the lowpass filtered composite image resampled at the corresponding projection angles. 3) The complex HYPR LR image is calculated as the multiplication of the composite image and the weighting image. However, the proposed complex version of the HYPR LR differs from the original HYPR LR in two aspects. First, instead of calculating the magnitude of image data before HYPR LR processing, all the images throughout the complex reconstruction process are kept as complex-valued. Second, instead of low-pass filtering the complex images directly (i.e. filtering the real and imaginary channel separately), the filtration is applied only to the magnitude data, and phase information is kept un-filtered. The reason for doing this is that the complex filtering procedure would introduce a band artifact along a line where sharp phase change exists. A simple numerical phantom containing two regions with abrupt phase change and a set of in vivo images (imaging parameters presented in in vivo experiment section) are used to illustrate this problem, as shown in Fig. 2. For numerical phantom, both regions in the phantom have comparable intensities but different phases (phase of π on the left and zero phase on the right). Direct filtering of the complex image over the boundary region will cause signal cancellation, which results in an incorrect black band in the output magnitude image. In the invivo image, similar dark band artifacts are also observed if the complex blurring scheme was used.
Figure 1.
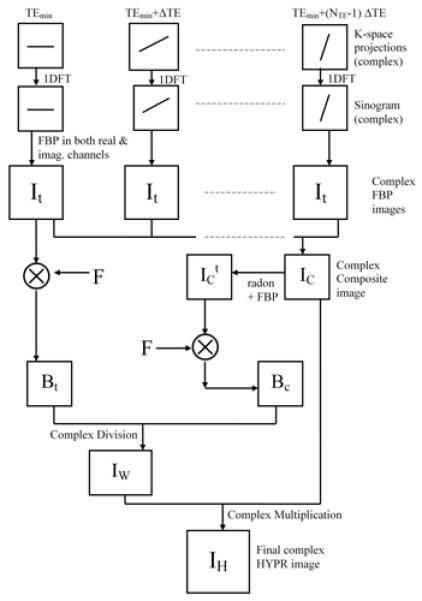
Schematic Diagram of the complex HYPR LR reconstruction algorithm. For simplicity, this diagram shows the case in which all the time frames are combined to produce a complex composite image. The filtration is only applied to the magnitude channel in the formation of Bt and BC. All the boxes in the diagram are intrinsically complex-valued data.
Figure 2.
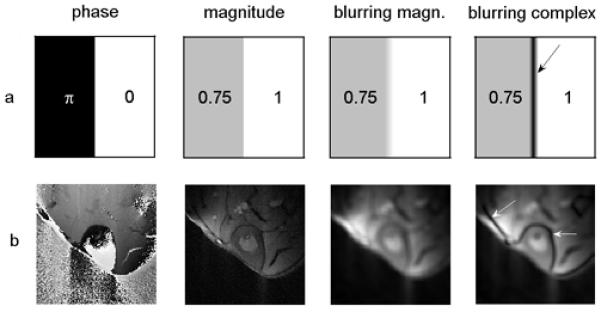
A numerical phantom example (a) and an in vivo example (b) showing the band artifacts caused by filtering complex images directly. The third column shows the blurred magnitude images obtained by the proposed magnitude filtering method, while the last column corresponds to magnitude images reconstructed using the straightforward complex blurring scheme. Arrows in the last column show the typical band artifacts due to signal cancellation due to complex filtering.
Similar to the conventional HYPR LR algorithm (Eq. [2] in Ref. (15))., the final complex HYPR LR time frame can be expressed as
| (1) |
where IC refers to the complex composite image, IW is the complex weighting image, Bt is the filtered TE images and BC is the filtered re-sampled composite image. Filtering only applies to magnitude channel, i.e.,
| (2) |
| (3) |
where F is the filter kernel, It is the complex-valued time frame obtained by reconstructing the real and imaginary channel separately using the FBP algorithm, and is the unfiltered re-sampled composite image. φt and are the phase of It and , respectively. Specifically, the magnitude and phase of the final HYPR LR image can be written as
| (4) |
| (5) |
From Eq. 4, we know that this method processes the magnitude of the HYPR LR images in the same way as the original HYPR LR (Eq. [2] in Ref. (15)). Therefore, image signal-to-noise ratio (SNR) is determined by the composite image, and streaks are reduced by normalizing the time frame to the re-sampled composite image. Furthermore, according to Eq. 5, this method assigns the phase of the time frame data to the HYPR LR image with steak artifacts mitigated by subtracting the FBP of the composite at each of the synthesized time frame angles. This is exactly the McKinnon-Bates algorithm in the phase domain (16). Rewriting Eq. 5, we have
| (6) |
| (7) |
Fig. 3 uses in-vivo images to illustrate the streak reduction in phase domain based on Eq. 6 and Eq. 7. Both the phase of the FBP image (Fig. 3d) and the phase of the resampled composite image (Fig. 3e) have severe streak artifacts. However, streaks in both phase images are due to the undersampled acquisition at the same projection angles, therefore they are coherent and can be effectively reduced by subtracting one from the other, providing a relative streak-free phase map of the weighting image (Fig. 3c). The phase of the HYPR LR image is calculated as the sum of the composite phase image and the weighting phase image, and it is considered to have reduced streaks. Therefore, by taking advantage of the property of complex division in Eq. 1, HYPR LR processing in magnitude domain and McKinnon-Bates in phase domain can be achieved simultaneously.
Figure 3.
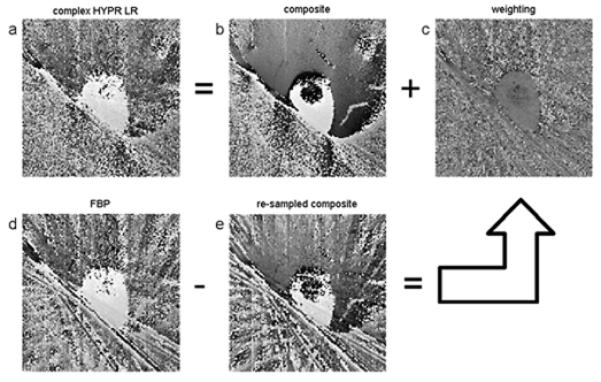
Formation of the phase in the complex HYPR LR algorithm. The first and second rows correspond to Eq. 6and Eq. 7, respectively.
T2* Quantification
The quantification of T2* can be achieved using UTESI by fitting the signal decay as a function of TE to an exponential decay. In order to account for the background noise, a constant term can be added to the exponential decay prior to fitting. Mathematically, the decay curve for a voxel at location can be modeled as
| (8) |
where S is the signal intensity, nbg accounts for background noise (assumed constant over time), and K is a constant. Eq. 8 is applicable when the region of interest (ROI) is composed of or dominated by a single species. The combination of two or more species with significant chemical shift difference results in an intrinsic phase cancellation of the species which causes the decay curve to be modulated by an oscillation pattern.
Simulation
In order to validate the proposed complex HYPR LR algorithm, a simulation was designed to determine whether both the magnitude and phase information of the complex-valued image could be processed accurately. This simulation was implemented in Matlab (The Mathworks Inc. Natick, MA, USA). A numerical phantom containing a circular disk representing bone marrow and an outer elliptical region representing bone was generated. The bone marrow was assumed to contain 65% fat and 35 % water (17), both of which had a T2* of 6000 μs. Water was assumed to be the only metabolite that contributed signal to the outer bone region, with a short T2* equal to 400 μs. The resonance frequency for fat was set to −440 Hz relative to water, mimicking invivo conditions on a 3T system. The maximum signal intensity of bone marrow was set to 80% of the maximum signal intensity of the bone (considering the effect of long T2* suppression pulse, marrow signal was lower than bone). Image size was 256×256 and Gaussian white noise with zero mean and a standard deviation of 5% of the maximum signal amplitude (corresponding SNR = 20) was added to both the real and imaginary channels, separately. Images were sampled at minimal TE of 8 μs and at increments of 80 μs for the subsequent TEs, i.e. TE = 8 μs, 88 μs, 168 μs, … Each TE image was radially undersampled, and contained only a few projections that covered k-space uniformly. The number of projections per echo image was set to three different values such that the simulation could run at three different undersampling levels. Different composite window lengths were also used to reconstruct images at each undersampling level. Other complex HYPR LR reconstruction parameters included Gaussian filtering kernel with filter size = 10 pixels and σ = 7 pixels, which were the same for all the reconstructions.
In vitro Experiment
The proposed complex HYPR LR method was then applied to two types of in-vitro samples, with data acquired by the UTESI sequence on a clinical 3T system (Signa TwinSpeed, GE Healthcare Technologies, Milwaukee, WI, USA). In the first in-vitro study, data were collected from a pig tibia, which typically contains a large circular marrow region at the center, surrounded by a ring-shaped bone region. Bone is of ultra-short T2*, which is typically on the order of several hundred microseconds. Imaging parameters were listed in Table 1, vitro#1. Specifically, Np half projections (spokes in k-space) were acquired and interleaved into NTE groups with an initial TE of TEmin and a TE increment of ΔTE thereafter. For each group, half projections that were 180 degree apart were combined together to form a full projection, which covered the k-space uniformly. TI was the inversion time in the long T2 suppression preparation pulse (6). Following the data acquisition, raw data were transferred to a Linux computer for complex HYPR LR image reconstruction using Matlab. Different reconstruction parameter settings were used to compare their effects on the final HYPR LR images in terms of SNR.
Table 1.
Imaging parameters for in vitro and in vivo experimentsa
| Np | NTE | TEmin(us) | ΔTE(us) | TR (ms) |
TI (ms) |
FOV (cm) |
slice thickness (mm) |
NEX | Scan time (min) |
|
|---|---|---|---|---|---|---|---|---|---|---|
| vitro #1 | 1800 | 45 | 8 | 60 | 200 | 80 | 10 | 6 | 2 | 12 |
|
| ||||||||||
| vitro #2 | 1800 | 45 | 8 | 200 | 100 | N/A | 12 | 3 | 2 | 6 |
|
| ||||||||||
| vivo #1 | 1800 | 45 | 12 | 80 | 300 | 115 | 12 | 7 | 2 | 18 |
Np: total number of half projection; NTE: number of TE images; ΔTE: time duration between two neighboring TE images; TI: inversion time for suppression pulse. Scan time=NEX×Np×TR
The second in-vitro sample experiment was a spectroscopic imaging of a tendon specimen. Long T2 suppression pulses were not used in this application and the imaging parameters are shown in Table 1, vitro #2. Larger ΔTE was used for better spectral resolution to obtain a spectral image very close to fat peak. The complex HYPR LR reconstruction parameters were: sliding composite window length = 15 TE images, Gaussian filtering kernel size = 10 pixels and Gaussian parameter σ = 5 pixels.
In vivo Experiment
The proposed algorithm was further validated and confirmed in a volunteer study. Institutional Review Board permission was obtained prior to this study, in which cortical bone data from a 30 year old healthy male volunteer were acquired. The quality of the reconstructed images, intensity vs. TE curve, and the spectra were investigated. T2* decay fitting using maximum likelihood was also performed to evaluate the accuracy of the complex HYPR LR method. Imaging parameters are also shown in Table1 vivo #1. Reconstruction parameters were: sliding composite window length = 9 TE images, Gaussian filtering kernel size = 10 pixels and Gaussian parameter σ = 7 pixels.
RESULTS
Simulation
Fig. 4(a) shows the reconstructed images from the simulation at various undersampling factors with different composite window lengths. By using the complex HYPR LR method, streaks were significantly reduced for all the undersampling levels and SNR was enhanced. The signal standard deviation from a selected 100 pixels (10×10) ROI was measured for an undersampling factor of 16, and was found to decrease with longer composite length, NC. This is consistent with the conclusion in previous HYPR literature that the SNR of the final HYPR image is determined by the composite image. The signal intensity curves of simulated bone and marrow reconstructed at an undersampling factor of 16 are shown in Fig. 4(b) and (d), and are in very good agreement with those of the fully sampled phantom when NC = 9, as indicated by the open circles. Because bone was designed to contain water only, the intensity vs. time curve followed an exponential decay as expected. Differently, marrow was supposed to consist of fat and water with comparable contributions, so a fat/water oscillation pattern was expected. Fig. 4(d) shows a fat/water oscillation pattern from the reconstructed marrow signal, which implies that the phases of fat and water were well preserved in the proposed method. However, the use of a very short composite length, e.g. NC=3 (stars in Fig. 4(b) and (d)), results in reduced accuracy. Insufficient composite length produces a composite image with streak artifacts and the resampling procedure for the generation of BC will further degrade the image quality, therefore reconstruction error appears.
Figure 4.
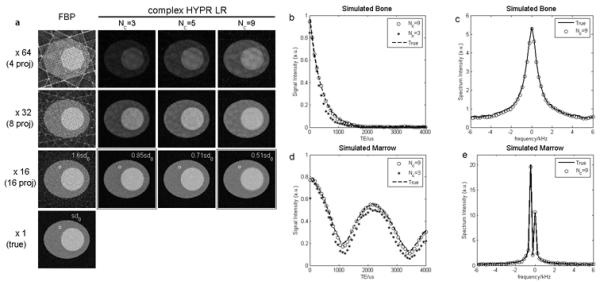
Simulation results. Panel (a) shows the original image and the reconstructed images using different composite lengths at various undersampling levels. Standard deviation measured from a 100-pixel ROI is displayed for ×16 setup, and sd0 is the standard deviation measured in the actual phantom. (b) and (d) show the signal vs. TE curves from simulated bone and marrow, using two different composite lengths. (c) and (e) are the corresponding spectra of simulated bone and marrow, using composite length of 9 images.
The contents of the designed bone and marrow can also be confirmed in their spectra, as Fig. 4(c) and (e) show an undersampling factor of 16 and NC=9. Both spectra are in good agreement with the spectra of the true phantom. The bone spectrum has a single peak located at zero frequency with a broad Full Width at Half Maximum (FWHM). This implies that the artificial bone is made of zero-frequency water and has a very short T2*. In contrast, the marrow spectrum shows a double-peak shape, with one dominant off resonance peak and one smaller zero-frequency peak. The small central peak corresponds to the water in marrow, and the dominant peak which is located at about −440 Hz is the fat peak.
In vitro Experiments
Fig. 5 shows the reconstruction results of the pig tibia experiment using different complex HYPR LR parameter settings. The magnitude of TE images at TEmin are shown, with different composite lengths and Gaussian filter kernel parameters. The improvement of SNR after complex HYPR LR implementation is significant for all the settings. A ROI containing 100 pixels was drawn in the bone region, and the standard deviation (sd) was measured and compared with the sd in the FBP image. The sd measurement results show that SNR increases (sd decreases) with composite length Nc and the FWHM of the Gaussian filtering kernel.
Figure 5.
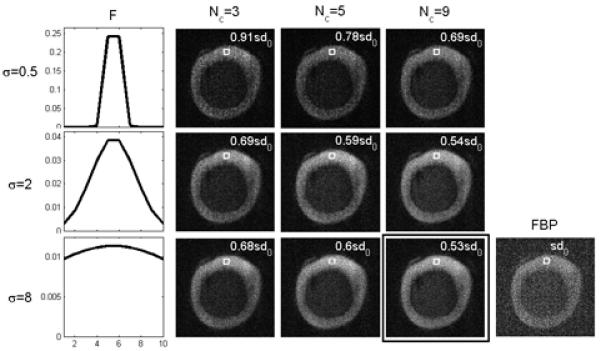
Comparison of the FBP TE image and the complex HYPR LR images reconstructed using different parameters at TEmin. The first column shows the profiles of Gaussian filter kernel with size = 10 pixels with three different values of the kernel standard deviation σ. Signal standard deviation from a 100-pixel ROI was measured for each parameter setting. Images reconstructed from in vitro experiment sample #1.
Fig. 6 shows the results from the tendon sample. The upper oval-shaped region is the tensile tendon, which is typically dark when using conventional pulse sequences. With this UTESI sequence, the tendon presents significant signal level at early TE times, especially in the minimal TE image. The complex HYPR LR image has ability to significantly reduce streak artifacts, as illustrated in Fig. 6(a) and (b). Fat/water separation is achieved by displaying the spectroscopic images at corresponding frequencies (−444 Hz and 0 Hz in Fig. 6a). The interleaved projection in k-space shifts oscillating artifacts to high frequency images and therefore results in a clean spectroscopic image at low frequency (6). The fascicular pattern inside the tensile tendon is well identified in the water image, as Fig. 6(c) shows.
Figure 6.
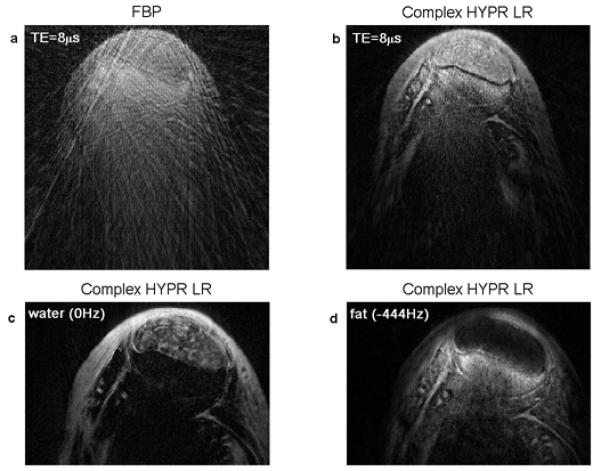
Results of in-vitro experiment sample #2. Magnitude image at TE=8μs reconstructed from simple FBP algorithm (a) and complex HYPR LR method (b). Spectroscopic image at water peak (c) and fat peak (d) are also shown. Fascicular pattern inside the tensile tendon is well depicted in the water image.
In vivo Experiment
Fig. 7 summarizes the results of the volunteer bone study. TE images and spectroscopic images are shown in Fig. 7(a). In order to illustrate the importance of using magnitude filtering, the problematic complex filtering was used in the last image of the second row. All other images appear to have good quality in terms of SNR and streak artifact reduction. The bone signal decays rapidly with increasing TE, which is consistent with the fact that its spectrum is bright over a broad range. T2* decay fitting was also performed and is shown in Fig. 7(b). The fitted T2* is 361 μs, which is in agreement with the broad bone spectrum shown in Fig. 7(c). Fig. 7(d) provides the signal analysis of marrow, and it a shows fat/water oscillation pattern. In the analyzed ROI, the marrow contains fat and water with roughly same percentage in content, as shown in the spectrum (Fig. 7(e)), which will theoretically give a perfect signal cancellation of fat and water. This is confirmed by the large peak-to-peak amplitude in the intensity curve.
Figure 7.
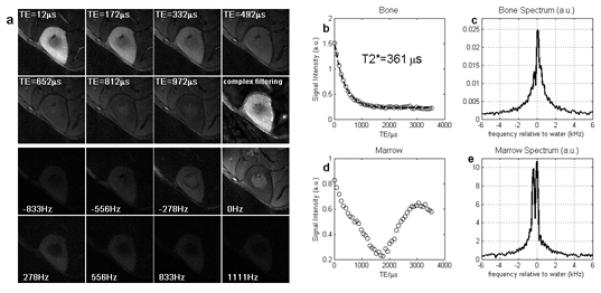
Results from volunteer study. Panel (a) shows the complex HYPR LR time frames at selected TEs and the corresponding spectroscopic images at 8 selected frequencies around the water peak. The last image in the second row shows the bright ghosting artifacts if using direct complex filtering method. Graph (b) to (e) shows the signal intensity vs TE curve and the spectrum of an 8 by 8 ROI drawn from bone and marrow, respectively. Zero-padding to 512 points was performed prior to Fourier transform along the time dimension.
DISCUSSION
A novel and intrinsically complex HYPR-LR reconstruction was shown to simultaneously improve SNR in the magnitude channel and reduce streak artifact in the phase channel for radially undersampled projection MRI data. This was validated in computer simulations and demonstrated in in vitro and in vivo MRI data. The reason that the UTESI data can be undersampled is that the image object is composed of several regions, and the temporal behavior within each local region is relatively homogeneous. So even though the dataset is not necessarily spatially sparse, there is still data redundancy in the temporal-spatial domain and HYPR-like algorithms can help exploit this type of data redundancy. By radially undersampling, the number of echo images, N, acquired within clinically acceptable time can be increased, and therefore the spectral resolution, Δf = 1/(N ·ΔTE), the spectral bandwidth, or both can be improved.
The general strategy of the proposed method is to treat echo images in UTESI as “time frames” in MRA where the original HYPR and HYPR LR algorithm can significantly reduce the spatial streak artifacts without compromising the SNR. By summing all or a subset of echo images, the UTE composite image is clean and has high SNR. However, the magnitude and the phase in the composite image are usually not the same as in one specific echo image. Then by wisely synthesizing a weighting image IW, the correct magnitude and phase information of this echo image is fed into the composite image and a complex HYPR LR image is generated.
The proposed complex HYPR LR algorithm, as well as other HYPR-like methods, should be differentiated from previously reported view-sharing technique (10-12). In view-sharing technique, images are constructed by incorporating high spatial frequency data from neighboring time frame to reduce the streak artifacts due to undersampling. This results in degraded temporal resolution. In HYPR-like algorithms, the composite image is generated by averaging all the images within a composite window; therefore, the temporal information in the composite image is very poor. However, HYPR-like algorithms further correct the temporal information by multiplying the composite image by a synthesized weighting image, and it has been shown to have better temporal response than view-sharing approaches (13).
The choice of undersampling factor and reconstruction parameters, such as composite length, filter type and size, in the proposed complex HYPR LR method should be made considering the following factors. First, the degree of undersampling is limited by the sparsity of the image object, acceptability of streak artifacts and tolerable reconstruction error. As Fig. 4 shows, at very high undersampling level, residual streak artifacts are always visible and cannot be entirely removed no matter what composite length is used. Second, because the image is not necessarily sparse, and it is very common that two regions, such as bone and marrow, are directly connected to each other, even the proposed magnitude blurring method will still cause inaccuracy or cross-talk at the region boundaries. This effect can be reduced by decreasing the FWHM of the filtering kernel. From this standpoint, a smaller filter is favorable, and HYPR LR is generally superior to original HYPR in this UTESI application, because original HYPR has a large 1/r global filtering (detailed comparison between HYPR and HYPR LR is presented in Ref. (15). However, SNR will be compromised if the filter is too small. Based on all the results shown in this paper, our experience with the complex HYPR LR method suggests that an image-space Gaussian kernel with size of 10 pixels and σ of 7 pixels is a good choice for bone and tendon imaging. The reconstructed images show much better SNR with acceptable spatial cross-talk. Third, the composite length, Nc, should be long enough such that the composite image is free of streak artifacts and has high SNR. An insufficient composite length results in reconstruction error, as the simulation results suggest. On the other hand, a very long composite length in this UTESI application is unfavorable, because longer TE images have low SNR and including them in the composite image will not provide increased SNR.
Some spatial blurring artifacts observed in the UTE bone and tendon imaging are not due to the blurring procedure in HYPR LR reconstruction; however, they are partially due to the chemical shift artifacts that are related to radial acquisition and partially caused by rapid T2* decay during readout. These types of blurring artifacts can be removed using water-fat separation methods (18-20) and will be investigated in the future.
One limitation of this complex HYPR LR method, however, is the phase cancellation in the composite image. In this method, composite images are generated by summing NC FBP TE images, and the SNR of the composite is times bigger than each FBP image. But it is possible that the summation of the complex signals from FBP images will cause signal cancellation, and therefore result in a very low signal level and low SNR in the generated composite image. If this happens, this method does not have the SNR gain and will fail. The phase change within a composite window is given by Δφ = 2π·Δffat·ΔTE· Nc. Generally, Nc should be chosen such that Δφ does not exceed π to avoid significant cancellation, therefore, Nc <1/(2ΔffatΔTE). However the presence of T2* decay will mitigate this problem and the restriction on Nc can be relaxed.
In other applications where composite cancellation is unavoidable, special treatment to the composite images is needed. One alternative to summing complex images to obtain the composite image is to acquire a single separate, fully or even over-sampled image with high SNR at minimal TE, and to use it as the composite for the complex HYPR LR reconstruction. By doing so, cancellation will not occur and the high SNR of the composite can be guaranteed.
The proposed complex HYPR LR method is a non-iterative reconstruction algorithm that does not require any training data and can deal with complex dataset in an elegant way. Iterative HYPR-like algorithms have been introduced to improve temporal waveform fidelity and seem to be more robust in the case of significant motion (21-23). It also is likely that an iterative version of this complex HYPR LR method can reduce the discrepancy shown in Fig. 4(b) and (d). Future work may also include multi-echo UTESI with complex HYPR LR reconstruction to improve the spectral resolution.
CONCLUSION
In this work, a complex HYPR LR reconstruction method was proposed and validated in simulation, in-vitro and in-vivo studies using the UTESI technique. It has been demonstrated that this approach can be used to reduce scan time with given SNR or increase the SNR for a fixed scan time with high in-plane spatial resolution. Streak artifacts reduction is also achieved in the phase domain. Future work may include the extension of this method to other applications in which complex information is intrinsically needed, such as phase contrast MRI and hyperpolarized C-13 spectroscopic imaging.
REFERENCES
- 1.Reichert IL, Robson MD, Gatehouse PD, He T, Chappell KE, Holmes J, Girgis S, Bydder GM. Magnetic resonance imaging of cortical bone with ultrashort TE pulse sequences. Magn Reson Imaging. 2005;23(5):611–618. doi: 10.1016/j.mri.2005.02.017. [DOI] [PubMed] [Google Scholar]
- 2.Gold GE, Pauly JM, Macovski A, Herfkens RJ. MR spectroscopic imaging of collagen: tendons and knee menisci. Magn Reson Med. 1995;34(5):647–654. doi: 10.1002/mrm.1910340502. [DOI] [PubMed] [Google Scholar]
- 3.Gatehouse PD, Bydder GM. Magnetic resonance imaging of short T2 components in tissue. Clin Radiol. 2003;58(1):1–19. doi: 10.1053/crad.2003.1157. [DOI] [PubMed] [Google Scholar]
- 4.Robson MD, Gatehouse PD, Bydder M, Bydder GM. Magnetic resonance: an introduction to ultrashort TE (UTE) imaging. J Comput Assist Tomogr. 2003;27(6):825–846. doi: 10.1097/00004728-200311000-00001. [DOI] [PubMed] [Google Scholar]
- 5.Rahmer J, Bornert P, Groen J, Bos C. Three-dimensional radial ultrashort echo-time imaging with T2 adapted sampling. Magn Reson Med. 2006;55(5):1075–1082. doi: 10.1002/mrm.20868. [DOI] [PubMed] [Google Scholar]
- 6.Du J, Hamilton G, Takahashi A, Bydder M, Chung CB. Ultrashort echo time spectroscopic imaging (UTESI) of cortical bone. Magn Reson Med. 2007;58(5):1001–1009. doi: 10.1002/mrm.21397. [DOI] [PubMed] [Google Scholar]
- 7.Mansfield P. Spatial mapping of the chemical shift in NMR. Magn Reson Med. 1984;1(3):370–386. doi: 10.1002/mrm.1910010308. [DOI] [PubMed] [Google Scholar]
- 8.Posse S, DeCarli C, Le Bihan D. Three-dimensional echo-planar MR spectroscopic imaging at short echo times in the human brain. Radiology. 1994;192(3):733–738. doi: 10.1148/radiology.192.3.8058941. [DOI] [PubMed] [Google Scholar]
- 9.Du J, Pak BC, Takahashi A, Znamirowski R, Statum S, Bydder GM, Chung CB. Orientational effect on Achilles tendon investigated with ultrashort TE spectroscopic imaging (UTESI) sequence. Proc 16th Annual Meeting ISMRM; Toronto, Canada. 2008. p. 3670. [Google Scholar]
- 10.Du J, Carroll TJ, Wagner HJ, Vigen K, Fain SB, Block WF, Korosec FR, Grist TM, Mistretta CA. Time-resolved, undersampled projection reconstruction imaging for high-resolution CE-MRA of the distal runoff vessels. Magn Reson Med. 2002;48(3):516–522. doi: 10.1002/mrm.10243. [DOI] [PubMed] [Google Scholar]
- 11.Barger AV, Block WF, Toropov Y, Grist TM, Mistretta CA. Time-resolved contrast-enhanced imaging with isotropic resolution and broad coverage using an undersampled 3D projection trajectory. Magn Reson Med. 2002;48(2):297–305. doi: 10.1002/mrm.10212. [DOI] [PubMed] [Google Scholar]
- 12.Du J, Carroll TJ, Brodsky E, Lu A, Grist TM, Mistretta CA, Block WF. Contrast-enhanced peripheral magnetic resonance angiography using time-resolved vastly undersampled isotropic projection reconstruction. J Magn Reson Imaging. 2004;20(5):894–900. doi: 10.1002/jmri.20189. [DOI] [PubMed] [Google Scholar]
- 13.Keith L, Kecskemeti S, Velikina J, Mistretta C. Simulation of relative temporal resolution of time-resolved MRA sequences. Magn Reson Med. 2008;60(2):398–404. doi: 10.1002/mrm.21658. [DOI] [PMC free article] [PubMed] [Google Scholar]
- 14.Mistretta CA, Wieben O, Velikina J, Block W, Perry J, Wu Y, Johnson K, Wu Y. Highly constrained backprojection for time-resolved MRI. Magn Reson Med. 2006;55(1):30–40. doi: 10.1002/mrm.20772. [DOI] [PMC free article] [PubMed] [Google Scholar]
- 15.Johnson KM, Velikina J, Wu Y, Kecskemeti S, Wieben O, Mistretta CA. Improved waveform fidelity using local HYPR reconstruction (HYPR LR) Magn Reson Med. 2008;59(3):456–462. doi: 10.1002/mrm.21505. [DOI] [PMC free article] [PubMed] [Google Scholar]
- 16.Garden KL, Robb RA. 3-D Reconstruction of the Heart from Few Projections: A Practical Implementation of the McKinnon-Bates Algorithm. IEEE Trans Med Imaging. 1986;5(4):233–239. doi: 10.1109/TMI.1986.4307782. [DOI] [PubMed] [Google Scholar]
- 17.Liney GP, Bernard CP, Manton DJ, Turnbull LW, Langton CM. Age, gender, and skeletal variation in bone marrow composition: a preliminary study at 3.0 Tesla. J Magn Reson Imaging. 2007;26(3):787–793. doi: 10.1002/jmri.21072. [DOI] [PubMed] [Google Scholar]
- 18.Reeder SB, Pineda AR, Wen Z, Shimakawa A, Yu H, Brittain JH, Gold GE, Beaulieu CH, Pelc NJ. Iterative decomposition of water and fat with echo asymmetry and least-squares estimation (IDEAL): application with fast spin-echo imaging. Magn Reson Med. 2005;54(3):636–644. doi: 10.1002/mrm.20624. [DOI] [PubMed] [Google Scholar]
- 19.Yu H, McKenzie CA, Shimakawa A, Vu AT, Brau AC, Beatty PJ, Pineda AR, Brittain JH, Reeder SB. Multiecho reconstruction for simultaneous water-fat decomposition and T2* estimation. J Magn Reson Imaging. 2007;26(4):1153–1161. doi: 10.1002/jmri.21090. [DOI] [PubMed] [Google Scholar]
- 20.Brodsky EK, Holmes JH, Yu H, Reeder SB. Generalized k-space decomposition with chemical shift correction for non-Cartesian water-fat imaging. Magn Reson Med. 2008;59(5):1151–1164. doi: 10.1002/mrm.21580. [DOI] [PubMed] [Google Scholar]
- 21.Griswold M, Barkauskas K, Blaimer M, Moriguchi H, Sunshine J, Duerk J. More optimal HYPR reconstructions using a combination of HYPR and conjugate-gradient minimization. Proceedings of MRA Club; Basel, Switzerland. 2006. p. 29. [Google Scholar]
- 22.O’Halloran RL, Wen Z, Holmes JH, Fain SB. Iterative projection reconstruction of time-resolved images using highly-constrained back-projection (HYPR) Magn Reson Med. 2008;59(1):132–139. doi: 10.1002/mrm.21439. [DOI] [PubMed] [Google Scholar]
- 23.Samsonov A, Wieben O, Block W. HYPRIT: generalized HYPR reconstruction by iterative estimation. Proc ISMRM Non-Cartesian Workshop; Sedona, AZ. 2007. [Google Scholar]


