

Abstract
Anti-mouse thymocyte globulin (mATG) prevents, as well as reverses, type-1 diabetes (T1D) in NOD mice, through mechanisms involving modulation of the immunoregulatory activities of T lymphocytes. Dendritic cells (DC) play a pivotal role in the generation of T cell responses, including those relevant to the autoreactive T cells enabling T1D. As antibodies against DC are likely generated during production of mATG, we examined the impact of this preparation on the phenotype and function of DC in order to elucidate novel mechanism(s) underlying its beneficial activities. In vivo, mATG treatment transiently induced the trafficking of mature CD8− predominant DC into the pancreatic lymph node of NOD mice. Splenic DC from mATG treated mice also exhibited a more mature phenotype characterized by reduced CD8 expression and increased IL-10 production. The resultant DC possessed a potent capacity to induce Th2 responses when cultured ex vivo with diabetogenic CD4+ T cells obtained from BDC2.5 TCR transgenic mice. Co-transfer of these Th2 deviated CD4+ T cells with splenic cells from newly diabetic NOD mice into NOD.RAG−/− mice significantly delayed the onset of diabetes. These studies suggest the alteration of DC profile and function by mATG may skew the Th1/Th2 balance in vivo and through such actions, represent an additional novel mechanism by which this agent provides its beneficial activities.
Keywords: Dendritic cells, Antibodies, Diabetes, Rodent, Th1/Th2 Cells
INTRODUCTION
Type 1 diabetes (T1D) is an autoimmune disorder caused by Th1-mediated cellular destruction of insulin-producing pancreatic β cells (1,2). Dendritic cells (DC) are the most potent antigen-presenting cells (APC) of the immune system, with the unique capacity to initiate and to modulate effector T cell responses. DC prime a Th1 versus Th2 biased T cell repertoire, depending on complex factors such as the DC subset, co-stimulatory molecule expression, and cytokine milieu, during both antigen presentation and subsequent T cell activation (3,4). Alternatively, DC can induce regulatory T cells (Treg) and cross-present β cell antigens in a tolerogenic fashion to autoreactive T cells in the pancreatic lymph nodes (PLN) (5–7). Abnormalities in DC function, including defects in maturation and ability to activate immunoregulatory T cells, have been demonstrated in NOD mice, and may play an important role in eliciting the characteristic autoimmune reaction to β cells (8–10). Hence, manipulation of DC profile and/or function, with the purpose of reshaping the repertoire of T cells, represents a potential therapeutic option for the treatment of T1D (11–18) .
Polyclonal rabbit anti-thymocyte globulin (ATG) has been used in a wide variety of clinical settings, including renal transplantation, graft versus host disease, and aplastic anemia (19,20). ATG binds to multiple epitopes on the surface of T cells and induces a rapid lymphocytopenia by several mechanisms including complement-dependent cytolysis, cell-dependent phagocytosis and apoptosis (21,22). Recent clinical studies demonstrating the reversal of T1D following therapy with more “restrictive” anti-CD3 monoclonal antibodies have provided the impetus for planned clinical studies testing the efficacy of ATG in this disorder (23,24). Moreover, the recent development of rabbit polyclonal anti-mouse thymocyte globulin (mATG) has allowed for more precise study of the potential mechanisms of action for this agent. Recently, we demonstrated the ability of mATG to attenuate the development of T1D through a process that mechanistically was associated with an increased frequency of CD4+CD25+FOXP3+ T cells and enhanced immunoregulatory function as determined through in vitro suppression assay of effector T cell (Teff) responses (25). Polyclonal mATG is prepared by immunization with pooled thymus cells, which undoubtedly contain DC. Furthermore, DC and T cells share several common cell surface antigens. Thus, antibodies against DC likely exist within the mATG preparation. Given the pivotal role DC play in the generation of T cell responses responsible for T1D, we examined the impact of mATG on DC profile and function. Herein, we report a novel mechanism that contributes to the protection from T1D with this agent and may be active in other immune based disorders subject to similar immunomodulatory based treatment.
MATERIALS AND METHODS
Mice
Female NOD/LtJ, NOD.RAG−/−, NOD.BDC2.5 TCR transgenic mice were purchased from The Jackson Laboratory (Bar Harbor, ME) and housed under specific pathogen-free conditions, according to institutional guidelines. Protocols were approved by the Institutional Animal Care and Use Committees of The University of Florida and Johns Hopkins University.
In vivo mATG administration
mATG was prepared by immunizing rabbits with pooled thymus cells prepared from NOD, C3H/He, DBA/2, and C57BL/6 mice (Genzyme Corporation, Framingham, MA). Tests for quality control and quality assurance for functional activities were performed in accordance with standard procedures by the manufacturer. Twelve week old female NOD mice were administered intraperitoneal injections of 1.0 mg mATG or rabbit IgG (Jackson Immunologicals) diluted into saline or saline alone, and sacrificed 1, 7 or 14 days later. This amount of mATG was considered optimal, as it represented the minimal dose of mATG providing protection from T1D in NOD mice in our previous studies (25).
Dendritic cell phenotype
Cells harvested from spleen, pancreatic lymph node (PLN), inguinal lymph node (ILN), and thymus were subjected to flow cytometric analysis using a FACScalibur flow cytometer (Becton Dickinson). Data were analyzed using the FCS Express® analysis software (De Novo). The following antibodies (as well as relevant isotype controls) were used for staining (murine monoclonal from BD Pharmingen, unless otherwise noted): FITC anti-CD8α (53–6.7), FITC anti-CD8α (KT15, Serotec), APC anti-CD11c, PerCP-Cy5.5 anti-CD11b, PE anti-PDCA1 (Miltenyi Biotec), FITC anti-IAk, PE or biotin anti-CD86, and PE anti-CCR7 (eBioscience). Absolute cell numbers were calculated by multiplying the frequency of DC subset by the total cell number per organ.
Isolation and stimulation of splenic DC
Splenocytes were harvested from mice within each treatment group by collagenase D (Roche Diagnostics) digestion, with DC purified using a CD11c positive selection magnetic bead separation technique (Miltenyi Biotec) according to the manufacturer's protocol. The purity of splenic DC was >90%. Cells were then cultured in RPMI 1640 with 10% Fetal Bovine Serum (FBS), L-glutamine, penicillin-streptomycin (PSN), 500 U/ml murine GM-CSF, and stimulated with toll like receptor agonists (TLRA), including LPS (1 μg/ml) and CpG (ODN 1826; 5 μg/ml), or anti-CD40 (5 μg/ml) for 24 hours. Supernatants were harvested for cytokine measurement (described below). To measure intracellular cytokine production, purified splenic DC from ATG treated mice were stimulated with CpG and LPS for 24 hours in the presence of GolgiPlug™ for the last 4 hours. IL-10/IL-12 production by CD8+ and CD8− DC was then measured by flow cytometry.
Transgenic T cell response
CD4+ T cells from NOD.BDC 2.5 TCR transgenic mice were purified by negative selection using the CD4 magnetic bead separation technique (Miltenyi Biotec). CD4+ T cells (1 × 10⁵) were cultured in 96-well round bottom plates for 5 days with purified splenic DC from IgG or mATG treated mice at varying ratios (DC:T - 1:10; 1:20; 1:40; 1:80) in the presence of a mimetope peptide (termed 1040–55; 500 ng/ml), having the sequence RVRPLWVRME, as previously described (26). On day 4, 0.5 μCi H3 thymidine was added to each well. Following 16 hours of incubation, cells were lysed and the H3 incorporation was determined using a 1450 Microbeta Trilux® β-scintillation counter (Wallac). In addition, 2 × 10⁵ CD4+ T cells were cultured with 2 × 10⁴ purified splenic DC in the presence of peptide 1040–55. Supernatants were harvested at days 2 or 5 for cytokine measurement. On day 5, cells were stimulated with 5 ng/ml PMA and 500 ng/ml ionomycin (Sigma-Aldrich) for 4 hours in the presence of GolgiPlug™, followed by surface staining with mAb anti-CD4 and intracellular staining with FITC anti-IFNγ and PE anti-IL-4 using BD Cytofix/Cytoperm Plus™ (BD Pharmingen), per the manufacturer's protocol. In separate experiments, splenic CD8+ and CD8− DC were purified from naive NOD mice using flow sorting (BD VantageSE™), and cultured with purified CD4+ T cells (with or without CFSE labeling) at a ratio of 1:10. Cytokine production was assayed by Bio-Plex. T cell proliferation was determined as percentage of cells exhibiting CFSE fluorescence dilution.
Adoptive co-transfer of transgenic T cells
CD4+ T cells from NOD.BDC 2.5 TCR transgenic mice were purified and co-cultured with splenic DC from mATG or IgG treated NOD mice in the presence of the mimetope peptide (DC:T - 1:5), as described above. After five days, DC were depleted from these cultures using CD11c magnetic bead separation (positive selection), and remaining T cells (3 × 10⁶) were co-transferred with spleen cells (3 × 10⁶) from newly diabetic NOD mice by intraperitoneal injection into NOD.RAG−/− mice. All mice were followed daily for onset of diabetes, defined as three consecutive blood glucose levels greater than 250 mg/dl measured by blood glucose meter (Ascensia Contour).
Generation of bone marrow-derived DC and in vitro mATG administration
Bone marrow (BM) derived DCs were generated as described (10). Briefly, BM cells from 8–12 wk old NOD mice were cultured for 5 days in RPMI 1640 media with 10% FBS, L-glutamine, 2-ME, Penicillin-Streptomycin-Neomycin, 500 U/ml murine GM-CSF and 100 U/ml murine IL-4. On day 3, one-half of the supernatant was replaced with fresh cytokine-containing medium, and 1 to 100 μg/ml mATG was added. On day 4, 1.0 μg/ml LPS was added to stimulate DC activation/maturation. On day 5, supernatants were collected for cytokine measurement, and cells were harvested for flow cytometric analysis.
Endocytosis
Dendritic cell endocytosis was detected as previously described (27). Briefly, BM-derived DCs were treated with mATG on day 3 and harvested on day 5. A total of 5 × 10⁵ cells were incubated with 5 μg/ml FITC-albumin (Sigma) or 0.1 mg/ml FITC-dextran (MW 40000, Molecular Probes™) at either 37°C or 4°C (negative control) for 1 hour. Endocytosis was stopped by cold wash in 0.1% sodium azide/1% FBS/ PBS. Cells were stained with anti-CD11c and 7-AAD, followed by flow cytometric analysis.
Apoptosis and necrosis
Splenic DC were isolated from 8–12 week old NOD mice and cultured for 6 hours with RPMI 1640 containing 10% FBS, 500U/ml GM-CSF, L-glutamine and PSN, in the presence of 0.01 mg/ml mATG or IgG. Cells were harvested, stained with anti-CD11c, anti-CD8, anti-PDCA-1, Annexin V and 7-AAD, and analyzed by flow cytometry. Cells (gated on CD8+, CD8−, or PDCA1+ DC) that were Annexin V positive and 7-AAD negative staining were considered apoptotic, while double positive staining indicated necrosis.
Cytokine determination
Culture supernatants were subjected to cytokine analysis, by ELISA using OptEIA™ Set Mouse IL-12 and IL-10 kits (BD Biosciences), Luminex using Lincoplex® platform (Linco) or Bio-Plex multiplex cytokine detection system (Bio-Rad), according to the manufacturer's protocol.
mATG binding
Cells freshly isolated from NOD mice or BM derived DCs were incubated with 0.01 mg/mL mATG or IgG for 20 min and washed. Those cells, as well as cells directly isolated from in vivo mATG or IgG treated mice, were stained with FITC labeled donkey anti-rabbit IgG (Amersham) and APC labeled anti-CD11c, followed by flow cytometric analysis.
Statistical analysis
Statistical analysis was performed using Student's T and log rank tests, where appropriate. Data are presented as mean ± SD. P values <0.05 were deemed significant.
RESULTS
mATG binding to DC
To confirm the ability of mATG to bind DC, lymphoid tissues from mATG treated mice, as well as freshly isolated splenic DC and BM-derived DC treated with mATG in vitro, were investigated. Intensive binding was observed on splenic and BM DC obtained from mATG treated mice (i.e., 1 day following injection) with less binding demonstrated on thymic DC (Fig 1A). No binding was detected on any DC from mATG treated mice 14 days after injection. In vitro, mATG administration resulted in strong binding to both splenic and thymic DC, as well as BM-derived DC (Fig 1B). These findings are consistent with our previous studies demonstrating in vivo binding of rabbit polyclonal anti-human thymocyte globulin to peripheral blood DC in human subjects (28)
Figure 1. Binding of mATG to DC.

A. Antibody binding to splenic, thymic and bone marrow (BM) DC freshly isolated from NOD mice 1 day following injection with mATG or IgG (gate = CD11c+ cells). B. Antibody binding to splenic, thymic and BM-derived DC treated in vitro with mATG or IgG (gate = CD11c+ cells).
Accumulation of DC in PLN of mATG treated mice
Since trafficking of DC from peripheral tissue to regional LN is important to their tolerogenic function, we analyzed the DC frequency (i.e. % CD11c+ cells) in lymphoid organs of NOD mice 1 day following initiation of the various treatments. Administration of mATG significantly increased the DC frequency in spleen, PLN and ILN (Fig 2A) compared to the IgG treated group. To address whether this increase simply represented the relative reduction of T cells characteristic of mATG administration, the absolute DC number was calculated by multiplying the percentage of DC by the total number of cells from one organ. Results showed that the absolute number of DC was significantly increased only in PLN following mATG treatment (Fig 2B). In separate experiments, NOD mice were administered mATG or IgG and sacrificed 7 or 14 days later. The frequency of DC in PLN and ILN in the mATG treatment group remained significantly higher compared to the IgG group at both time points (Fig 2A). Although there was no significant increase in the absolute DC number in any of the lymphoid organs at these later time points, a non-significant trend in PLN did emerge (Fig 2B).
Figure 2. Accumulation of DC in PLN of mATG treated NOD mice.

Twelve week-old female NOD mice were injected intraperitoneally with 1 mg mATG or IgG, and sacrificed 1 (n=6), 7 (n=3) or 14 days (n=3) later. A. Frequency of DC (% CD11c+) in spleen, PLN and ILN of mATG or IgG treated mice, analyzed by flow cytometry. B. Absolute DC number per organ in mATG or IgG treated mice, calculated by multiplying the frequency of DC by the total cell number per organ. **P<0.01, *P<0.05 vs IgG treated group.
Administration of mATG alters DC subset ratio
Since a particular DC subset can influence the ultimate T cell response, the three recognized mouse DC subsets were characterized in spleen, thymus, PLN and ILN 1 day following the noted injection schemes: CD11c+CD8+CD11b−~lowPDCA1− conventional DC (CD8+DC); CD11c+CD8−CD11b+PDCA1− conventional DC (CD8−DC); CD11c+CD11b−PDCA1+ plasmacytoid DC (pDC) (Fig 3A,B). Injection of mATG resulted in a significant reduction of CD8+DC and increase of CD8−DC frequencies within the spleen, PLN and ILN, compared to the IgG treated group (Fig 3C). The frequency of pDC was also significantly reduced in PLN and ILN of mATG treated mice (Fig 3C). Analysis of absolute PLN DC subset numbers revealed that while all three subsets were significantly increased, the large majority of this increase represented CD8−DC (Fig 3D). To determine whether mATG induced cell death could contribute to the relative reduction of CD8+DC and pDC, purified splenic DC were treated with mATG or IgG control in vitro for 6 hours, and analyzed by flow cytometry. mATG induced an increase in both apoptosis and necrosis of CD8+DC but not CD8−DC compared to control wells (Fig 4). An increase in pDC necrosis was also demonstrated. Thus, while an absolute increase in CD8−DC explains the relative reduction of CD8+DC, at least in the PLN, increased cell death of other DC subsets may play a role.
Figure 3. Altered DC subset frequency in mATG-treated NOD mice 1 day following injection.

A & B. Representative identification of pDC (PDCA1+CD11b) and conventional DC (cDC): CD8+DC (PDCA1−CD8+CD11b−~low) or CD8−DC (PDCA1−CD8−CD11b+) from PLN of IgG or mATG treated mice (gate = CD11c+ cells). C. Frequency of three DC subsets in spleen, PLN and ILN (n=6). D. Absolute numbers of PLN DC subsets in mATG or IgG treated mice. **P<0.01, *P<0.05 vs IgG treated group.
Figure 4. mATG-induced apoptosis and necrosis of CD8+DC in vitro.

Purified splenic DC were treated with 0.01 mg/ml mATG or IgG for 6 hours in vitro and analyzed by flow cytometry. Cells (gated CD8+, CD8− or PDCA1+ DC) positive for Annexin V and negative for 7-AAD were considered apoptotic, with those double positive regarded as necrotic. *P<0.05 vs IgG treated group.
Administration of mATG induces DC maturation
Because defects in DC maturation are implicated in the pathogenesis of T1D, the maturational state of DC among lymphoid organs in different treatment groups was assessed. mATG induced DC maturation characterized by higher CD86 and MHC II expression in each of the aforementioned lymphoid organs except thymus 1 day following injection compared to IgG (Fig 5). These findings were consistent for all three DC subsets (data not shown). Similar upregulation of CCR7 expression was also demonstrated for total DC (Fig 5). However, subgroup analysis revealed that CCR7 expression was upregulated on CD8−DC (15±2.7% vs 10±2.4%, p<0.01) but not on CD8+DC in PLN, supporting migration of CD8−DC from the pancreas as an explanation for the increase in absolute number. No differences in CD86, MHC II, or CCR7 expression were found between IgG and mATG treated groups at 7 or 14 days after injection.
Figure 5. MHC II, CD86 and CCR7 expression on DC from spleen, PLN and ILN from NOD mice 1 day following mATG injection.

A. Representative flow cytometry plots showing MHC II, CD86 and CCR7 expression on DC (gate = CD11c+ cells). B. Mean fluorescence intensity (MFI) of CD86, MHC II and CCR7 staining on DC, and frequency of CD86+, MHC+ and CCR7+ DC in mATG or IgG treatment groups (n=5–6). **P<0.01 vs IgG treated group.
Splenic DC from mATG treated mice produce more IL-10
To assess the cytokine production of splenic DC from mATG or IgG treated mice, DC were stimulated ex vivo with various activation agents. mATG treatment induced more IL-10 production from splenic DC following stimulation with CpG, LPS and anti-CD40, and slightly reduced IL-12 production after stimulation with CpG (Fig 6A). No IL-12 production was detected in LPS or anti-CD40 stimulated groups. DC subtype analysis by intracellular staining revealed significantly higher IL-10 and lower IL-12 production by CD8− DC compared to CD8+ DC (Fig 6B). This cytokine pattern is consistent with a tolerogenic DC phenotype.
Figure 6. Cytokine production of splenic DC from mATG or IgG treatment groups.

A. Purified CD11c+ splenic DC isolated from different treatment groups (n=5–6) were stimulated with TLR agonists (CpG, LPS) and anti-CD40 for 24 hours. IL-10 and IL-12 production was measured by Luminex. B. Purified splenic DC isolated from mATG treated mice were stimulated with CpG and LPS for 24 hours. IL-10 and IL-12 production of CD8+ and CD8− DC were measured by intracellular staining. **P<0.01 vs IgG treated group.
Effects of mATG on BM derived DC in vitro
To address whether mATG has direct effects on DC in vitro, BM derived DC obtained from NOD mice were treated with escalating doses of mATG. No effect on DC generation (percentage of CD11c+ cells in live BM cells) or viability (measured by 7-AAD staining) was demonstrated when added early (Day 0) or late (Day 3) and with or without LPS stimulation (data not shown). When added late at day 3 of culture, however, mATG did inhibit LPS induced DC maturation, as evidenced by reduction of CD86 and MHC II expression (Fig 7A). No effect on endocytosis of albumin or dextran was observed by mATG treatment (data not shown). Regarding cytokine production, mATG significantly increased LPS stimulated IL-10 production, while reducing IL-12 production (Fig 7B).
Figure 7. Effects of mATG on BM-derived DCs in vitro.

BM cells were cultured for 5 d to generate DC. mATG (0.001, 0.01 and 0.1 mg/ml) was added at day 3, with LPS added at day 4. A. CD86 and MHC II expression on DC in a representative plot from three independent experiments (gate = CD11c+ cells). B. IL-10 and IL-12 production of BM-derived DC with or without mATG treatment. *P<0.05 vs IgG treated group.
Splenic DC from mATG treated mice induce a Th2 response
To investigate the ability of mATG treated DC to modulate T cell responses, CD4+ T cells from BDC2.5 TCR Tg mice were co-cultured ex vivo with splenic DC from different treatment groups in the presence of BDC2.5 specific peptide. Surprisingly, splenic DC from mATG treated mice induced more T cell proliferation compared with control DC from IgG treated mice (Fig 8A). Analysis of this response by intracellular staining revealed a large shift towards induction of IL-4 producing Th2 cells (Fig 8B). Analysis of cytokine secretion in supernatants from these cultures confirmed the predominant Th2 cytokine pattern characterized by increased IL-4, IL-5 and IL-10 production, as well as reduced IFN-γ production (Fig 8C). No difference in IL-2 production was observed after culture between the two treatment groups (IgG vs. mATG: 1612.64 ± 278.16 vs. 1699.53 ± 189.18 pg/ml; p=NS). Addition of IL-10 neutralizing antibody to mATG treated DC/T culture resulted in a slight but significant increase in IFN-γ (3240.7 ± 431.8 vs. 2549.8 ± 659.6 pg/ml; p<0.05) but no change in IL-4 or IL-5 levels (data not shown).
Figure 8. T cell response induced by splenic DC from mATG or IgG treated mice.
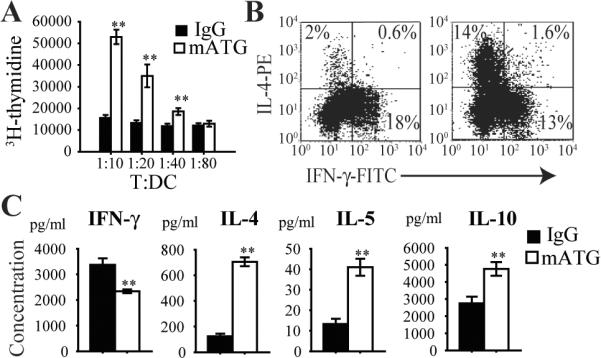
Purified CD11c+ splenic DC from different treatment groups were cultured with CD4+ T cells from BDC2.5 TCR Tg mice in the presence of peptide 1044–55 for 5 days at varying T:DC ratios. A. T cell proliferation measured by H3-thymidine incorporation. B. Representative flow cytometry plots showing IL-4 producing Th2 and IFN-γ producing Th1 CD4+ T cells by intracellular staining. C. Supernatant cytokine production measured by Luminex. **P<0.01 vs IgG treated group.
To determine whether alteration of the DC subset ratio following mATG treatment might contribute to the observed T cell response, purified CD8+ or CD8− DC from naïve NOD mice were cultured with CD4+ T cells from BDC2.5 TCR Tg mice, as previously described. A trend towards greater proliferation was noted after stimulation with CD8−DC (Fig 9A). Analysis of cytokine production revealed a Th2-biased repertoire, consistent with the experiments using CD8− predominant mATG treated DC (Fig 9B).
Figure 9. T cell response induced by splenic CD8+ or CD8− DC.

Purified CD8+ or CD8− splenic DC from naïve NOD mice were cultured with CD4+ T cells from BDC2.5 TCR Tg mice in the presence of peptide 1044–55 for 5 days at a 1:10 ratio A. T cell proliferation is expressed as percentage mitosis, as determined by loss of CFSE fluorescence by flow cytometric analysis. B. Supernatant cytokine production measured by Bio-Plex. **P<0.01, *P<0.05 CD8+DC vs CD8−DC.
Adoptive co-transfer of T cells expanded ex vivoby mATG treated DC delays the onset of diabetes
Because T1D is regarded as a Th1-mediated disease, and mATG-treated splenic DC induced a Th2 response ex vivo in BDC2.5 T cell culture, we sought to determine whether this immune deviation would alter diabetogenic activities in vivo. For these experiments, BDC2.5 T cells were isolated after culture with in vivo mATG vs IgG treated splenic DC plus peptide and co-transferred with spleen cells from newly diabetic NOD mice by intraperitoneal injection into NOD.RAG−/− mice. Type 1 diabetes onset was significantly delayed in mice that received T cells stimulated by mATG versus IgG treated splenic DC, respectively (Fig. 10). These in vivo data support our hypothesis that mATG modulation of DC phenotype and function alters the T cell response to suppress diabetogenic responses.
Figure 10. Adoptive co-transfer of T cells stimulated ex vivo by splenic DC from mATG or IgG treated mice.
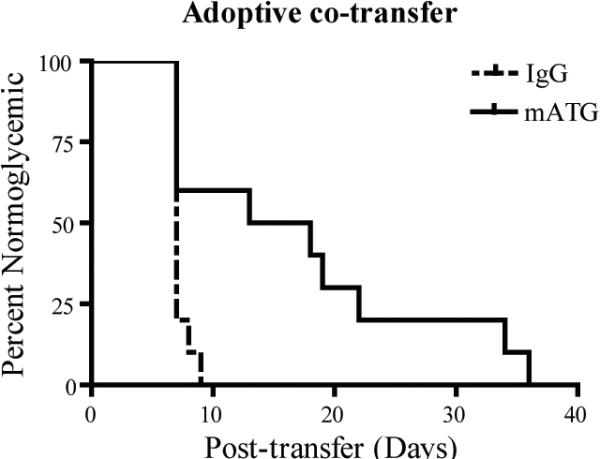
BDC2.5 T cells isolated from culture with in vivo treated mATG or IgG splenic DC as described in Figure 8 were co-transferred with splenocytes from newly diabetic mice by intraperitoneal injection into NOD.RAG−/− mice (n=10 per group). **P<0.01 mATG vs IgG treated group.
DISCUSSION
Similar to earlier reports using anti-lymphocyte serum (29,30), our previous study demonstrated the ability of mATG to inhibit the development of T1D in NOD mice, however, not only by a transient reduction of lymphocytes but also through the enhancement of CD4+CD25+ Treg functional activity (25). Our current study provides in vitro and in vivo evidence for an additional novel mechanism, whereby mATG alters DC phenotype and function to shape the subsequent T cell response.
DC comprise a heterogeneous population of cells with divergent effects on the immune response. In the mouse, at least three subtypes are identified in the spleen: CD8+CD11b−PDCA1− conventional DC (CD8+DC), CD8−CD11b+PDCA1− conventional DC (CD8−DC), and CD11b−PDCA1+B220+ plasmacytoid DC (pDC). The CD8+DC subset is considered the major source of IL-12 secretion, with the capacity to promote Th1 biased immune responses and to cross-prime cytotoxic T lymphocytes, while CD8−DC produce more IL-10 and preferentially induce Th0 or Th2 like responses (31). DC subset function, however, exhibits considerable plasticity. For example, treatment of DC with IL-10 in vitro induces a selective decrease in CD8+DC viability while incubation with IFN-γ down-regulates the Th2 promoting capacities of CD8−DC and increases the Th1 skewing properties of both subsets (3).
In the current study, in vivo mATG administration resulted in a relative reduction of the CD8+DC population in various lymphoid tissues. Although the precise mechanisms by which this reduction occurred are unclear, in vitro mATG treatment of isolated splenic DC induced necrosis and apoptosis of CD8+ but not CD8− DC, suggesting a possible direct cellular effect. However, when cultured with various activation stimuli, splenic DC from mATG treated mice produced higher levels of IL-10, with greater production from the CD8− DC subset. Similarly, BM derived DC cultured with mATG also produced increased IL-10. Thus, DC IL-10 production after mATG administration may have contributed further to selective reduction of the CD8+DC subset in vivo (3). Reduction of the CD8+DC population also likely underlies the ensuing Th2 response after mATG treated splenic DC were co-cultured with BDC2.5 TCR Tg CD4+ cells, as purified CD8−DC from naïve NOD mice in this system yielded a similar Th2 deviation. Finally, absolute DC number was increased in PLN, with the majority of this increase identified as CD8−DC. Other studies have demonstrated a similar increase of this DC phenotype in PLN of NOD mice after treatment with α-galactosylceramide (α-Gal-cer), which also conferred protection from T1D. The authors of those studies suggested that the increase in PLN CD8−DCs represented an increased migration from the pancreas (16, 17). However, ascribing tolerogenic function solely to one individual DC subtype is still controversial, since some groups have reported that CD8+DC can also induce tolerance to tissue-associated antigens (32,33).
Traditionally, immature DC with low-level expression of MHC II and costimulatory molecules are considered important for maintenance of tolerance under basal conditions. However, recent studies have shown that tolerance induction in NOD mice may require DC to express high levels of these surface molecules (i.e, mature phenotype) for cross-tolerization of antigen-specific T cells (9,12,34,35). In addition, DC migration to draining LN is essential to generate and/or activate Treg cells where these T cells first encounter cognate antigen. Previous studies have demonstrated that mature DC migration to the draining LN is up to 8 fold higher than immature DC (36). A recent report suggests that disruption of E-cadherin adhesions between peripheral tissue DC and neighboring cells, which occurs concomitant with tissue emigration, may be responsible for inducing DC maturation during steady-state conditions (37). DC maturation in this study was characterized by typical upregulation of costimulatory molecules, MHC class II, and chemokine receptors. However, unlike maturation induced by microbial products or inflammation, no immunostimulatory cytokine release occurred and T cells with a regulatory as opposed to an effector phenotype were generated. In NOD mice, DC maturation is reportedly impaired and may limit DC migration to PLN, leading to insufficient immunoregulation induction (9,10). Herein we report the accumulation of more mature CD8− predominant DC in PLN of mATG treated NOD mice. Furthermore, we noted a significant increase in the percentage of CD8−DC expressing CCR7, the molecule directing the migration of DC to lymphoid tissues (38). Taken together, these findings suggest that mATG administration induces the maturation and subsequent migration of a predominant CD8−DC population to the PLN of NOD mice to activate immunoregulatory mechanisms. Our findings are consistent with the α-Gal-cer studies mentioned previously, which demonstrated protection from T1D associated with NKT cell induced maturation and migration of DC to PLN (16,17). Whether mATG induced DC maturation represents an indirect effect, as with α-Gal-cer, is presently unclear. Our in vitro BM-derived DC culture experiments, which lack the DC interactions with other cellular elements present in vivo, failed to demonstrate maturation after mATG treatment. This discrepancy may indicate involvement of an intermediary cell type in vivo, such as NKT cells, or perhaps disruption of E-cadherin adhesions not present in vitro.
In our previous report, we demonstrated a relative increase in CD4+CD25+FoxP3+ Treg frequency and suppressive function following in vivo administration of mATG (25). Ruzek et al demonstrated the induction of Treg after treatment of splenocytes from C57BL/6 mice in vitro with mATG, although the addition of exogenous IL-2 was required (39). Contrary to our initial expectations, a Th2 and not a Treg response ensued when in vivo mATG treated NOD DC were cultured ex vivo with BDC2.5 cells. Luo et al were able to generate Treg by β-cell peptide-pulsed DC using a similar culture system (40). However, in their report, the addition of TGF-β1 to culture was required. Furthermore, as mentioned previously, the mATG treated splenic DC used in our experiments represent a CD8−DC predominant population, which in most reports skews towards a Th2 response. Our adoptive co-transfer studies demonstrated the ability of these Th2 cells to delay the onset of diabetes, confirming the in vivo relevance of the altered DC phenotype in shaping the T cell repertoire toward suppression of diabetogenic activity. Interestingly, Lopez et al found that induction of Treg from human peripheral blood lymphocytes during in vitro treatment with anti-human thymocyte globulin was dependent on the presence of Th2 cytokines (41). Thus, our findings do not rule out the possibility that mATG alteration of DC profile and function promoted the relative sparing of Tregs observed in vivo and augmentation of their suppressive function following administration of mATG in our previous study (25). Finally, we noted higher proliferation in T cell cultures stimulated with mATG treated DC (CD8− predominant) or purified CD8−DC from naïve NOD. These findings are consistent with reports by the Shortman group (32,33) which noted a reduced capacity of quiescent splenic CD8+DC versus CD8−DC to stimulate T cell proliferation.
In summary, we demonstrate that in vivo mATG administration transiently recruited a mature CD8− predominant DC population into PLN of NOD mice. In addition, splenic DC from mATG treated mice exhibited a more mature phenotype with increased IL-10 production and the potent capacity to induce a Th2 response ex vivo that upon adoptive transfer significantly delayed the onset of diabetes in vivo. These studies suggest the alteration of DC profile and function by mATG may similarly skew the Th1/Th2 balance in vivo and through such actions, represent an additional mechanism by which this agent provides its beneficial effect.
ACKNOWLEDGEMENTS
The authors wish to thank Neal Benson and the staff of the Flow Cytometry Core Laboratory at the University of Florida's Interdisciplinary Center for Biotechnology Research for assistance with flow cytometry. The FACSCalibur™ flow cytometer was purchased by the Center for Immunology.
This work was supported by NIH grants (2K08DK66319-2, 394288, 394210, DK063422), the Medical Research Service of the Department of Veterans Affairs, the Keene Family Professorship, Genzyme Corporation, and the Juvenile Diabetes Research Foundation International.
Footnotes
DISCLOSURES John Williams serves as Vice President of Immune Mediated Diseases Research for Genzyme Corporation, the company providing the rabbit anti-mouse thymocyte globulin and research funding for these studies.
Reference List
- 1.Goudy KS, Tisch R. Immunotherapy for the prevention and treatment of type 1 diabetes. Int.Rev.Immunol. 2005;24:307–326. doi: 10.1080/08830180500379721. [DOI] [PubMed] [Google Scholar]
- 2.Mallone R, Nepom GT. Targeting T lymphocytes for immune monitoring and intervention in autoimmune diabetes. Am.J.Ther. 2005;12:534–550. doi: 10.1097/01.mjt.0000178772.54396.38. [DOI] [PMC free article] [PubMed] [Google Scholar]
- 3.Maldonado-Lopez R, Maliszewski C, Urbain J, Moser M. Cytokines regulate the capacity of CD8alpha(+) and CD8alpha(−) dendritic cells to prime Th1/Th2 cells in vivo. J.Immunol. 2001;167:4345–4350. doi: 10.4049/jimmunol.167.8.4345. [DOI] [PubMed] [Google Scholar]
- 4.de Jong EC, Smits HH, Kapsenberg ML. Dendritic cell-mediated T cell polarization. Springer Semin.Immunopathol. 2005;26:289–307. doi: 10.1007/s00281-004-0167-1. [DOI] [PubMed] [Google Scholar]
- 5.Kurts C, Cannarile M, Klebba I, Brocker T. Dendritic cells are sufficient to cross-present self-antigens to CD8 T cells in vivo. J.Immunol. 2001;166:1439–1442. doi: 10.4049/jimmunol.166.3.1439. [DOI] [PubMed] [Google Scholar]
- 6.Kurts C, Kosaka H, Carbone FR, Miller JF, Heath WR. Class I-restricted cross-presentation of exogenous self-antigens leads to deletion of autoreactive CD8(+) T cells. J.Exp.Med. 1997;186:239–245. doi: 10.1084/jem.186.2.239. [DOI] [PMC free article] [PubMed] [Google Scholar]
- 7.Penna G, Giarratana N, Amuchastegui S, Mariani R, Daniel KC, Adorini L. Manipulating dendritic cells to induce regulatory T cells. Microbes.Infect. 2005;7:1033–1039. doi: 10.1016/j.micinf.2005.03.025. [DOI] [PubMed] [Google Scholar]
- 8.Vasquez AC, Feili-Hariri M, Tan RJ, Morel PA. Qualitative and quantitative abnormalities in splenic dendritic cell populations in NOD mice. Clin.Exp.Immunol. 2004;135:209–218. doi: 10.1111/j.1365-2249.2003.02359.x. [DOI] [PMC free article] [PubMed] [Google Scholar]
- 9.Morel PA, Vasquez AC, Feili-Hariri M. Immunobiology of DC in NOD mice. J.Leukoc.Biol. 1999;66:276–280. doi: 10.1002/jlb.66.2.276. [DOI] [PubMed] [Google Scholar]
- 10.Peng R, Bathjat K, Li Y, Clare-Salzler MJ. Defective maturation of myeloid dendritic cell (DC) in NOD mice is controlled by IDD10/17/18. Ann.N.Y.Acad.Sci. 2003;1005:184–186. doi: 10.1196/annals.1288.023. [DOI] [PubMed] [Google Scholar]
- 11.Belz GT, Heath WR, Carbone FR. The role of dendritic cell subsets in selection between tolerance and immunity. Immunol.Cell Biol. 2002;80:463–468. doi: 10.1046/j.1440-1711.2002.01116.x. [DOI] [PubMed] [Google Scholar]
- 12.Lo J, Clare-Salzler MJ. Dendritic cell subsets and type I diabetes: focus upon DC-based therapy. Autoimmun.Rev. 2006;5:419–423. doi: 10.1016/j.autrev.2005.12.001. [DOI] [PubMed] [Google Scholar]
- 13.Adams S, O'Neill DW, Bhardwaj N. Recent advances in dendritic cell biology. J.Clin.Immunol. 2005;25:177–188. doi: 10.1007/s10875-005-4086-2. [DOI] [PubMed] [Google Scholar]
- 14.Clare-Salzler MJ, Brooks J, Chai A, Van Herle K, Anderson C. Prevention of diabetes in nonobese diabetic mice by dendritic cell transfer. J.Clin.Invest. 1992;90:741–748. doi: 10.1172/JCI115946. [DOI] [PMC free article] [PubMed] [Google Scholar]
- 15.Feili-Hariri M, Falkner DH, Morel PA. Regulatory Th2 response induced following adoptive transfer of dendritic cells in prediabetic NOD mice. Eur.J.Immunol. 2002;32:2021–2030. doi: 10.1002/1521-4141(200207)32:7<2021::AID-IMMU2021>3.0.CO;2-J. [DOI] [PubMed] [Google Scholar]
- 16.Naumov YN, Bahjat KS, Gausling R, Abraham R, Exley MA, Koezuka Y, Balk SB, Strominger JL, Clare-Salzer M, Wilson SB. Activation of CD1d-restricted T cells protects NOD mice from developing diabetes by regulating dendritic cell subsets. Proc.Natl.Acad.Sci.U.S.A. 2001;98:13838–13843. doi: 10.1073/pnas.251531798. [DOI] [PMC free article] [PubMed] [Google Scholar]
- 17.Chen YG, Choisy-Rossi CM, Holl TM, Chapman HD, Besra GS, Porcelli SA, Shaffer DJ, Roopenian D, Wilson SB, Serreze DV. Activated NKT cells inhibit autoimmune diabetes through tolerogenic recruitment of dendritic cells to pancreatic lymph nodes. J.Immunol. 2005;174:1196–1204. doi: 10.4049/jimmunol.174.3.1196. [DOI] [PubMed] [Google Scholar]
- 18.Papaccio G, Nicoletti F, Pisanti FA, Bendtzen K, Galdieri M. Prevention of spontaneous autoimmune diabetes in NOD mice by transferring in vitro antigen-pulsed syngeneic dendritic cells. Endocrinology. 2000;141:1500–1505. doi: 10.1210/endo.141.4.7437. [DOI] [PubMed] [Google Scholar]
- 19.Bacigalupo A. Antithymocyte globulin for prevention of graft-versus-host disease. Curr.Opin.Hematol. 2005;12:457–462. doi: 10.1097/01.moh.0000183726.42063.ec. [DOI] [PubMed] [Google Scholar]
- 20.Colby C, Stoukides CA, Spitzer TR. Antithymocyte immunoglobulin in severe aplastic anemia and bone marrow transplantation. Ann.Pharmacother. 1996;30:1164–1174. doi: 10.1177/106002809603001016. [DOI] [PubMed] [Google Scholar]
- 21.Michallet MC, Saltel F, Preville X, Flacher M, Revillard JP, Genestier L. Cathepsin-B-dependent apoptosis triggered by antithymocyte globulins: a novel mechanism of T-cell depletion. Blood. 2003;102:3719–3726. doi: 10.1182/blood-2003-04-1075. [DOI] [PubMed] [Google Scholar]
- 22.Preville X, Flacher M, LeMauff B, Beauchard S, Davelu P, Tiollier J, Revillard JP. Mechanisms involved in antithymocyte globulin immunosuppressive activity in a nonhuman primate model. Transplantation. 2001;71:460–468. doi: 10.1097/00007890-200102150-00021. [DOI] [PubMed] [Google Scholar]
- 23.Herold KC, Hagopian W, Auger JA, Poumian-Ruiz E, Taylor L, Donaldson D, Gitelman SE, Harlan DM, Xu D, Zivin RA, Bluestone JA. Anti-CD3 monoclonal antibody in new-onset type 1 diabetes mellitus. N.Engl.J.Med. 2002;346:1692–1698. doi: 10.1056/NEJMoa012864. [DOI] [PubMed] [Google Scholar]
- 24.Keymeulen B, Vandemeulebroucke E, Ziegler AG, Mathieu C, Kaufman L, Hale G, Gorus F, Goldman M, Walter M, Candon S, Schandene L, Crenier L, De Block C, Seigneurin JM, De Pauw P, Pierard D, Weets I, Rebello P, Bird P, Berrie E, Frewin M, Waldmann H, Bach JF, Pipeleers D, Chatenoud L. Insulin needs after CD3-antibody therapy in new-onset type 1 diabetes. N.Engl.J.Med. 2005;352:2598–2608. doi: 10.1056/NEJMoa043980. [DOI] [PubMed] [Google Scholar]
- 25.Simon G, Parker M, Ramiya V, Wasserfall C, Huang Y, Bresson D, Schwartz RF, Campbell-Thompson M, Tenace L, Brusko T, Xue S, Scaria A, Lukason M, Eisenbeis S, Williams J, Clare-Salzler M, Schatz D, Kaplan B, Von Herrath M, Womer K, Atkinson MA. Murine antithymocyte globulin therapy alters disease progression in NOD mice by a time-dependent induction of immunoregulation. Diabetes. 2008;57:405–414. doi: 10.2337/db06-1384. [DOI] [PubMed] [Google Scholar]
- 26.Tarbell KV, Yamazaki S, Olson K, Toy P, Steinman RM. CD25+ CD4+ T cells, expanded with dendritic cells presenting a single autoantigenic peptide, suppress autoimmune diabetes. J.Exp.Med. 2004;199:1467–1477. doi: 10.1084/jem.20040180. [DOI] [PMC free article] [PubMed] [Google Scholar]
- 27.Hackstein H, Taner T, Logar AJ, Thomson AW. Rapamycin inhibits macropinocytosis and mannose receptor-mediated endocytosis by bone marrow-derived dendritic cells. Blood. 2002;100:1084–1087. doi: 10.1182/blood.v100.3.1084. [DOI] [PubMed] [Google Scholar]
- 28.Womer KL, Peng R, Patton PR, Murawski MR, Bucci M, Kaleem A, Schold J, Efron PA, Hemming AW, Srinivas TR, Meier-Kriesche HU, Kaplan B, Clare-Salzler MJ. The effects of renal transplantation on peripheral blood dendritic cells. Clin.Transplant. 2005;19:659–667. doi: 10.1111/j.1399-0012.2005.00405.x. [DOI] [PubMed] [Google Scholar]
- 29.Maki T, Ichikawa T, Blanco R, Porter J. Long-term abrogation of autoimmune diabetes in nonobese diabetic mice by immunotherapy with anti-lymphocyte serum. Proc.Natl.Acad.Sci.U.S.A. 1992;89:3434–3438. doi: 10.1073/pnas.89.8.3434. [DOI] [PMC free article] [PubMed] [Google Scholar]
- 30.Ogawa N, List JF, Habener JF, Maki T. Cure of overt diabetes in NOD mice by transient treatment with anti-lymphocyte serum and exendin-4. Diabetes. 2004;53:1700–1705. doi: 10.2337/diabetes.53.7.1700. [DOI] [PubMed] [Google Scholar]
- 31.Maldonado-Lopez R, De Smedt T, Michel P, Godfroid J, Pajak B, Heirman C, Thielemans K, Leo O, Urbain J, Moser M. CD8alpha+ and CD8alpha- subclasses of dendritic cells direct the development of distinct T helper cells in vivo. J.Exp.Med. 1999;189:587–592. doi: 10.1084/jem.189.3.587. [DOI] [PMC free article] [PubMed] [Google Scholar]
- 32.Rizzitelli A, Vremec D, Villadangos JA, Mavaddat N, Wright MD, Shortman K. Switching from a restricted to an effective CD4 T cell response by activating CD8+ murine dendritic cells with a Toll-like receptor 9 ligand. Eur.J.Immunol. 2005;35:3209–3220. doi: 10.1002/eji.200526231. [DOI] [PubMed] [Google Scholar]
- 33.Rizzitelli A, Hawkins E, Todd H, Hodgkin PD, Shortman K. The proliferative response of CD4 T cells to steady-state CD8+ dendritic cells is restricted by post-activation death. Int.Immunol. 2006;18:415–423. doi: 10.1093/intimm/dxh382. [DOI] [PubMed] [Google Scholar]
- 34.Lutz MB, Schuler G. Immature, semi-mature and fully mature dendritic cells: which signals induce tolerance or immunity? Trends Immunol. 2002;23:445–449. doi: 10.1016/s1471-4906(02)02281-0. [DOI] [PubMed] [Google Scholar]
- 35.Sousa Reis e. Dendritic cells in a mature age. Nat.Rev.Immunol. 2006;6:476–483. doi: 10.1038/nri1845. [DOI] [PubMed] [Google Scholar]
- 36.Ridolfi R, Riccobon A, Galassi R, Giorgetti G, Petrini M, Fiammenghi L, Stefanelli M, Ridolfi L, Moretti A, Migliori G, Fiorentini G. Evaluation of in vivo labelled dendritic cell migration in cancer patients. J.Transl.Med. 2004;2:27. doi: 10.1186/1479-5876-2-27. [DOI] [PMC free article] [PubMed] [Google Scholar]
- 37.Jiang A, Bloom O, Ono S, Cui W, Unternaehrer J, Jiang S, Whitney JA, Connolly J, Banchereau J, Mellman I. Disruption of E-cadherin-mediated adhesion induces a functionally distinct pathway of dendritic cell maturation. Immunity. 2007;27:610–624. doi: 10.1016/j.immuni.2007.08.015. [DOI] [PMC free article] [PubMed] [Google Scholar]
- 38.Sanchez-Sanchez N, Riol-Blanco L, Rodriguez-Fernandez JL. The multiple personalities of the chemokine receptor CCR7 in dendritic cells. J.Immunol. 2006;176:5153–5159. doi: 10.4049/jimmunol.176.9.5153. [DOI] [PubMed] [Google Scholar]
- 39.Ruzek MC, Waire JS, Hopkins D, Lacorcia G, Sullivan J, Roberts BL, Richards SM, Nahill SR, Williams JM, Scaria A, Dzuris J, Shankara S, Garman RD. Characterization of in vitro antimurine thymocyte globulin-induced regulatory T cells that inhibit graft-versus-host disease in vivo. Blood. 2008;111:1726–1734. doi: 10.1182/blood-2007-08-106526. [DOI] [PubMed] [Google Scholar]
- 40.Luo X, Tarbell KV, Yang H, Pothoven K, Bailey SL, Ding R, Steinman RM, Suthanthiran M. Dendritic cells with TGF-beta1 differentiate naive CD4+ Proc.Natl.Acad.Sci.U.S.A. 2007;104:2821–2826. doi: 10.1073/pnas.0611646104. [DOI] [PMC free article] [PubMed] [Google Scholar]
- 41.Lopez M, Clarkson MR, Albin M, Sayegh MH, Najafian N. A novel mechanism of action for anti-thymocyte globulin: induction of CD4+CD25+Foxp3+ regulatory T cells. J.Am.Soc.Nephrol. 2006;17:2844–2853. doi: 10.1681/ASN.2006050422. [DOI] [PubMed] [Google Scholar]