Abstract
A model nanometer-sized hydrophobic receptor-ligand system in aqueous solution is studied by the recently developed level-set variational implicit solvent model (VISM). This approach is compared to all-atom computer simulations. The simulations reveal complex hydration effects within the (concave) receptor pocket, sensitive to the distance of the (convex) approaching ligand. The ligand induces and controls an intermittent switching between dry and wet states of the hosting pocket, which determines the range and magnitude of the pocket-ligand attraction. In the level-set VISM, a geometric free-energy functional of all possible solute-solvent interfaces coupled to the local dispersion potential is minimized numerically. This approach captures the distinct metastable states that correspond to topologically different solute-solvent interfaces, and thereby reproduces the bimodal hydration behavior observed in the all-atom simulation. Geometrical singularities formed during the interface relaxation are found to contribute significantly to the energy barrier between different metastable states. While the hydration phenomena can thus be explained by capillary effects, the explicit inclusion of dispersion and curvature corrections seems to be essential for a quantitative description of hydrophobically confined systems on nanoscales. This study may shed more light onto the tight connection between geometric and energetic aspects of biomolecular hydration and may represent a valuable step toward the proper interpretation of experimental receptor-ligand binding rates.
INTRODUCTION
Hydrophobic interactions drive apolar molecules to stick together in an aqueous solution.1, 2, 3, 4 Such interactions occur in many biological processes, ranging from the formation of large molecular complexes1 and protein folding5 to the conduction through transmembrane channels,6 and recognition between drug compounds and their molecular targets.7 In particular, the solvent-mediated interaction between a ligand and a hydrophobic receptor plays a key role in biomolecular assembly processes, such as protein-ligand recognition,7, 8, 9, 10, 11, 12 the binding of the human immunodeficiency virus13 or the dengue virus14 to human cells, the inhibition of influenza virus infectivity,15 or in synthetic host-guest systems.16 Experiments and explicit-water molecular dynamics (MD) simulations suggest that the concave nature of the host geometry imposes a strong hydrophobic constraint and can lead to very weakly hydrated pockets,2, 7, 8, 9, 10, 11, 12, 17 prone to nanoscale capillary evaporation triggered by an approaching ligand.7, 11, 18 This so-called dewetting transition has been also observed in other protein geometries, such as hydrophobic protein cores and ion channels.2, 17 It has been speculated that dewetting may lead to a fast host-guest recognition accelerating the hydrophobic collapse and binding rates of the ligand into its pocket.7, 8, 11 But a deeper physical understanding of these sensitive hydration effects in hydrophobic recognition seems to be still elusive.
A theoretical description of molecular hydration, and in particular hydrophobic effects, can allow for fast and accurate prediction of free-energy changes, and hence the structure, dynamics, and function of an underlying biological system. While MD computer simulations with the use of explicit solvent provide a good insight into hydration effects, they are computationally expensive, in particular, when it comes to obtaining thermodynamic quantities. In contrast, implicit solvent models19, 20 are generally more efficient, though less accurate. In such models, water is treated as a continuum and its description is reduced to that of a solute-solvent interface and related macroscopic quantities, such as the surface tension and the position-dependent dielectric constant.
Nearly all of the existing implicit solvent models are based on the concept of solvent accessible surfaces (SASs), solvent excluded surfaces (SESs), or molecular surfaces (MSs).20, 21, 22, 23, 24, 25 In these models, the hydration free energy ΔG is usually calculated as the sum of two components: nonpolar (ΔGnp) and polar (ΔGp). The nonpolar term is often assumed to be proportional to a given surface area S, i.e., ΔGnp∼γS, with γ being an effective surface tension. In some approaches,26, 27 the nonpolar term is further decomposed into a surface area dependent cavity component, representing a work necessary to create an empty cavity within a solvent that would accommodate the solute, and a term describing solute-solvent van der Waals interactions. Accounting for electrostatic interactions, the polar term is usually approximated with the use of Poisson–Boltzmann28, 29, 30, 31, 32, 33, 34, 35 or generalized Born36, 37, 38 models. Although successful in many cases, these models often lack generality, since they rely on many system-dependent, adjustable parameters (e.g., individual atomic surface tensions). Furthermore, with an a priori defined solute-solvent interface, they cannot account for drying effects whose eventual occurrence would change both the surface area and interface position, hence affecting both nonpolar and polar components of the free energy. It was also shown that the occurrence of drying transition may depend equally on confinement radius,39 strength of surface-water dispersive interactions,40 as well as on electric field acting on water molecules.41, 42 In order to successfully account for such dependences, the model should explicitly couple solute topography and solute-solvent interactions.
Recently, Dzubiella et al.43, 44 developed a variational implicit solvent model (VISM). The basic idea of this approach is to introduce a free-energy functional of the solute-solvent interface geometry, coupling both the nonpolar and polar contributions, as well as allowing for curvature correction of the surface tension in order to approximate the length-scale dependence of molecular hydration.45 Minimizing the functional determines a stable equilibrium solute-solvent interface, providing at the same time the hydration free energy of the system. This way, a solute-solvent interface is an output of the theory, resulting automatically from balancing the different contributions to the free energy. Cheng et al.46 first developed a level-set method47, 48, 49 for the robust numerical realization of the variational modeling and thus for a versatile description of arbitrarily shaped solute-solvent interfaces. (See also the related work in Ref. 50.) Importantly, level-set interface evolution easily captures topological changes, e.g., surface fusions and breakups which are directly related to molecular binding and unbinding.
In this work we apply the level-set VISM to a generic receptor-ligand model that consists of a hemispherical nanoscopic pocket embedded in a paraffin wall and a methane molecule allowed to move in and out of the pocket. Previously reported, detailed MD explicit solvent simulations18, 51, 52 revealed strong hydrophobic interactions between the solutes, augmented by the occurrence of drying inside the pockets. A proper description of hydrophobic effects in the considered system is challenging for an implicit solvent model due to the simultaneous presence of solutes involving three different hydration regimes, representative for small, large, and concave objects (methane molecule, flat wall, and concave pockets, respectively).
Our extensive numerical results show good agreement with the reported MD calculations. In particular, level-set VISM has been able to (1) calculate efficiently and quantitatively the free energy of the system; (2) locate the equilibrium solute-solvent interface accurately compared with MD simulations extracted from water density profiles; and (3) capture the bimodal hydration behavior of the system that is characterized by the coexistence of two local minima of the free energy. All of our results indicate that the variational solvation theory and the related level-set method have the potential to capture hydrophobic interactions of relatively large systems even quantitatively. We believe this is a promising start to understand such important interactions in the context of implicit solvent.
The rest of the paper is organized as follows: In Sec. 2, we introduce the generic system under consideration and briefly review the VISM and its numerical evaluation by the level-set method developed previously.43, 44, 46, 50 In Sec. 3, we report simulation and numerical results of our level-set VISM calculations of the model system and discuss and interpret the findings. Finally, in Sec. 4, we draw conclusions and present an outlook to further necessary extensions of our approaches.
SYSTEM AND METHODS
Hydrophobic receptor-ligand system
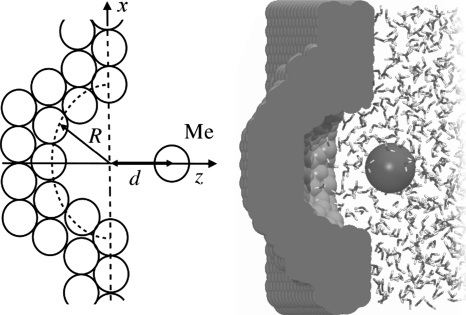
We consider a simple model of a hydrophobic receptor-ligand system consisting of a hemispherical nanoscopic pocket and a methanelike molecule (see Fig. 1). The solvent distribution, and the potential of mean force (PMF) between the two solvated objects, were previously examined in a series of MD simulations18, 51, 52 with the use of the TIP4P explicit solvent model.
Figure 1.
Schematic view of the pocket-ligand system, showing a methane molecule (Me) at distance d from pocket of radius R (left). Snapshot from MD simulation of the R8 system (right).
The pocket is embedded in a rectangular wall, composed of neutral particles aligned in a hexagonal close packed grid of 1.25 Å lattice constant interacting with the Lennard-Jones (LJ) potential. The LJ parameters of the wall particles, ϵ=0.010 kJ∕mol and σ=4.152 Å, are adjusted in such a way that the resultant material corresponds to paraffin. Those parameters are the same as in the work by Setny and Geller51 and Setny.52 It should be noted that even though the value of ϵ parameter, governing the strength of attractive part of LJ potential, is rather small, the resulting well depth in wall-water interaction potential is of 2.93 kJ∕mol due to tight packing of wall particles. Accordingly, the wall-water attractive forces should be regarded as representative for realistic hydrophobic material.
The wall surface is oriented in xy-plane, with a hemispherical pocket of radius R centered at (0, 0, 0). We consider pockets of two different radii: R=8 Å (system R8) and R=5 Å (system R5). The ligand, a single neutral LJ sphere representing a methane molecule (with the use of united atom optimized potentials for liquid simulations parameters ϵ=0.4983 kJ∕mol and σ=3.730 Å),53 is allowed to move perpendicular to the wall surface along the pocket symmetry axis (the z-axis). Its position with respect to wall surface is denoted as d (see Fig. 1).
MD simulations
MD simulations are carried out with the use of CHARMM program. Temperature and the pressure of the system corresponds to 298 K and 1 bar. Periodic boundary conditions were applied in xy-direction with the use of particle mesh Ewald summation for electrostatic interactions. A cutoff of 12 Å is used for van der Waals interactions. In order to obtain potentials of mean force, an umbrella sampling with subsequent weighted histogram analysis method is used. Methane positions along the z-axis, ranging from d=12 Å to the pocket bottom (defined as the distance where methane-wall repulsion reaches 1kBT, and being d=−3.8 Å and d=−1.8 Å in R8 and R5 systems, respectively) are sampled in series of consecutive windows, evenly spaced by 0.5 Å. The simulation time for each window is 2 ns. A more detailed description of the system setup and MD simulations can be found in previous work.18
Variational implicit solvent models
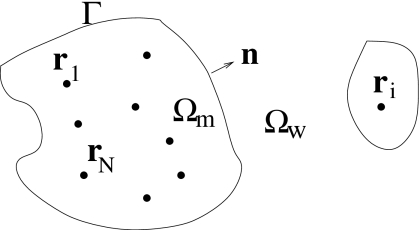
We denote by Ω the region of the entire solvation system. It is divided into the solute region Ωm (m means molecule), the solvent region Ωw (w means water), and the solute-solvent interface Γ that separates the solute region Ωm from the solvent region Ωw (see Fig. 2). The solute-solvent interface can possibly have many separated components. We assume that there are N solute atoms in the system that are located at r1,…,rN inside Ωm. In this continuum-solvent model, the solvent density distribution is simply ρ(r)=ρ0 in the solvent region Ωw, where ρ0 is the bulk density of the solvent, and ρ(r)=0 in the solute region Ωm. For our underlying receptor-ligand system, the region Ωm consists of both the wall and methane molecular regions.
Figure 2.
Geometry of a solute-solvent system. Solute atoms are at positions r1,…,rN in the volume Ωm separated by the interface Γ from the solvent region Ωw. Here n denotes the unit normal at the interface Γ.
In VISMs, the solvation free energy G is defined as a functional of a possible solute-solvent interface Γ (or the volume-exclusion function of Ωm defined to be 0 in Ωm and 1 elsewhere) in the form43
| (1) |
where P is the difference in bulk pressure between the liquid and vapor phase, Vol(Ωm) the volume of Ωm, γlv the liquid-vapor interface tension, τ a coefficient for the curvature correction of γlv in mean curvature H(r), and
| (2) |
sums over the LJ interactions of all N solute atoms (ligand and wall atoms) with the water, where is the LJ potential corresponding to the ith solute atom at ri. The curvature correction term in Eq. 1,
has been used in the scaled-particle theory54, 55, 56, 57 for spherical solutes only, in a generalized theory of capillarity,58 and in the same mathematical form in the morphometric approach which has been applied to fluids and the solvation of model proteins.59, 60
A necessary condition for an interface Γ to be an energy-minimizing solute-solvent interface is that the first variation in the free-energy functional [Eq. 1] with respect to the location change of the interface vanishes at Γ, i.e., δΓG[Γ]=0 at every point of the boundary Γ. This leads to the partial differential equation (PDE)43
| (3) |
where K(r) in Eq. 2 is the local Gaussian curvature. This equation is a generalization of the classical Laplace equation of capillarity,58, 61 extrapolated to microscales by the local curvature and explicit consideration of local dispersion interactions.
The geometrical PDE Eq. 3 is in general extremely difficult to solve analytically and numerically. To find the free-energy minimizing solute-solvent interface Γmin, we then turn to numerical optimization using the level-set method that is described below.
For our level-set VISM calculations, we use a set of parameters matching or approximating the MD conditions: P=0 bar, γlv=59 mJ∕m2 for TIP4P water,62 and ρ0=0.033 Å−3. The pressure difference P between the water liquid and gas state is ≃1 bar at the normal conditions studied here. On a nanometer scale (V∼nm3) this term is very small and can be safely neglected when compared to the interfacial and dispersion energy terms. The value of the τ parameter, governing the magnitude of curvature correction term, is usually estimated to be between 0.8 and 1.0 Å.63, 64, 65 In our previous calculations utilizing the VISM approach, we found that τ=1.0 Å provided the best agreement with hydration free energies of simple solutes.46 For the current MD simulation settings, however, hydration free energy of methane molecule was best reproduced for τ=0.8 Å. As, in principle, τ is the only freely adjustable parameter in our model, we decided to consider both the mentioned values in subsequent calculations, thus obtaining the ability to evaluate the influence of curvature correction term on the model performance.
The level-set method for free-energy minimization
We have developed a level-set method to numerically find the free-energy minimizing solute-solvent interface for the functional Eq. 1.46, 50 In this method, we begin with an initial guess of the surface surrounding all the solute atoms, and then move the surface in the direction of the steepest descent of the free energy to relax the system to a minimum.
The starting point of the level-set method is to identify a surface Γ in three-dimensional (3D) space as the zero level-set (i.e., the zero level surface) of a function ϕ=ϕ(r):47, 48, 49 Γ={r:ϕ(r)=0}. The function ϕ=ϕ(r) is called a level-set function of the surface Γ. The unit normal vector n at the interface Γ, the mean curvature H, and the Gaussian curvature K can all be expressed in terms of the level-set function ϕ
| (4) |
where He(ϕ) is the 3×3 Hessian matrix of the function ϕ whose entries are all the second order partial derivatives of the level-set function ϕ, and adj(He(ϕ)) is the adjoint matrix of the Hessian He(ϕ). The level-set function is determined by the so-called level-set equation
| (5) |
where vn is the normal velocity at the point r on the surface Γ(t). This normal velocity vn=vn(r(t)) of each point r=r(t) on the surface Γ=Γ(t) at time t is defined by
The velocity is usually extended away from the surface so that the level-set Eq. 5 can be solved in a finite computational box.
To apply the level-set method to VISM, we begin with an initial surface that contains all the solute particles. We then evolve this initial surface to an equilibrium solute-solvent interface by relaxing the total free energy of the system. As in common practice, we define the normal velocity vn of level-set evolution to be the negative of the first variation of the system free energy with respect to the location change of surface
| (6) |
This can be identified as a distribution over the interface Γ. Here, we choose the unit normal n at Γ to point from the solute to the solvent region (see Fig. 2).
Our level-set algorithm consists mainly of the following steps: surface initialization; calculation of the normal vector, mean, and Gaussian curvatures using Eq. 4; computing the normal velocity using Eq. 6; and solving the level-set Eq. 5. We choose our level-set computational box to be of size 50×50×50 Å3. We also choose our finite-difference grid size to be 1 or 0.5 Å. We use central differencing to discretize the level-set equation using a Courant–Friedrich–Lewy condition66 Δt∕(Δx)m≤Constant with m=2 or 3. The level-set equation with the normal velocity Eq. 6 is not always a parabolic equation. We numerically change the value of τ to enforce the parabolicity when it is lost.
In addition to these details that can be found in our previous work,46, 50 we have developed several new numerical techniques in this work. First, we precompute the values of potential U(r) defined in Eq. 2 at all the grid points, and store such values for use in each of the level-set iterations. Such precomputing allows us to efficiently treat large biomolecules of any number of fixed solute atoms for equilibrium calculations. Second, we have implemented a local level-set method. In this method, the level-set Eq. 5 is only solved on a narrow band around the interface rather than the entire computational box. This is rational, since the values of a level-set function, a solution to the Eq. 5, at points in such a band determine completely the location of the interface. The width of the band depends on the step size of the underlying grid. Constant recasting of the level-set function into signed distance form67 is further used to eliminate boundary effects of the band that may affect accuracy. The end result combines the advantages of the level-set approach with near perfect computational complexity. Finally, we have developed a semianalytical technique of numerical integration for calculating the free energy. In this technique, we convert a 3D integral over part of the region outside the computational box into a repeated integral of three one-dimensional integrals, using the spherical coordinate system. Some of these one-dimensional integrals can then be evaluated analytically. All these new techniques enable us to speed up much of our calculations. For instance, for the underlying receptor-ligand system with more than 4000 solute atoms, one level-set calculation only takes about 5–10 min on a serial computing processor unit, depending on the resolution of the numerical grid and initial guess of the interface.
RESULTS AND DISCUSSION
MD simulation results
MD simulations reveal a nontrivial solvent behavior in the considered systems. It can be attributed to changes in topography of hydrophobic confinement resulting from ligand translocations. In order to quantify the observed effects, we consider a probability distribution pN of finding exactly N water molecules inside the given pocket (a water molecule is regarded as being “inside” when the center of its oxygen atom is located at z<0). This allows us to express the free energy of the system as a function of the pocket occupancy
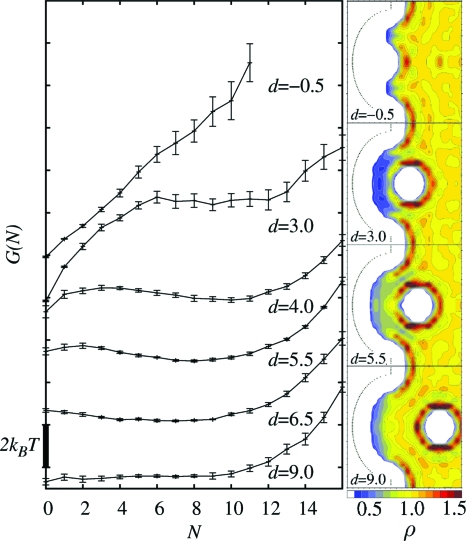
The resulting free-energy profiles, obtained for selected ligand positions in the R8 system, are presented in Fig. 3, along with representative examples of the water density distribution around the solvated objects.
Figure 3.
Left side: free energy G(N) of the R8 system as a function of pocket occupancy for different ligand distances d from the wall, where N is the number of water molecules inside the pocket. The error bars are obtained by block averaging of pN distribution. Right side: scaled water density (ρ) distribution for selected ligand positions (intersections of the system along the z-axis). ρ=1.0 equals bulk water density of 0.033 Å−3.
In the absence of the ligand (effectively for d≳9 Å), the R8 pocket triggers intermittent expansions and retractions of the fluidlike phase in its area, characteristic for wetting-drying transitions. Interestingly, those fluctuations cover a broad range of metastable states with no apparent free-energy minimum between N=0 (empty pocket) and bulklike density, which corresponds to N≈11.
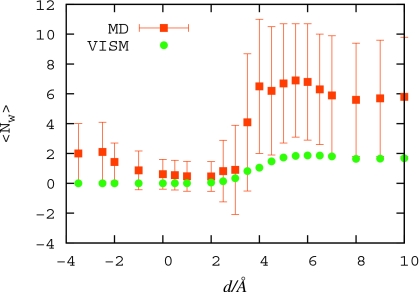
The pocket occupancy is significantly affected by the approaching ligand. For distances 4<d<9 Å, a slight stabilization of the wet state is observed, probably due to proximity of methane hydration shell that provides relatively stable interactions for water molecules inside the pocket (see the water density distribution in Fig. 3). Around d=5.5 Å, there forms a second shallow minimum in free-energy distribution, corresponding to a dry state. As the ligand approaches further, the dry state minimum becomes gradually more stable, turning to a global minimum for d<4 Å. The now metastable wet state minimum vanishes completely for d<0 Å. At this point, the pocket region becomes dry (see the water density distribution in Fig. 3) even though it could easily accommodate the methane hydration shell: under normal conditions, the first maximum in the water radial distribution function around the methane molecule is at 3.5 Å from its center, which would correspond to its position at z≃−0.5 Å (for methane center at d=0 Å), leaving more than 3 Å of water accessible space above the pocket bottom. We can describe all this behavior also from a more global view by looking at the average occupancy ⟨Nw⟩ versus d. This quantity is plotted in Fig. 4; it exhibits a maximum at d=6.5 Å while it jumps down from wet (⟨Nw⟩≃6) to dry (⟨Nw⟩≃0) at d≃dc with a stable dry state for d≲dc.
Figure 4.
Average water occupancy ⟨Nw⟩ in the R8 pocket from MD simulations (squares) and the level-set VISM approach (circles) estimated by the ensemble average [Eq. 8].
The hydration behavior is much simpler in the small R5 system. The R5 pocket, which can accommodate a few water molecules, stays preferably dry through most of the simulation time, with G(N) having a single minimum at N=0, irrespective of ligand position. This is consistent with experiments on the similarly sized ligand-binding pocket of the bovine β-lactoglobuline protein, which has been found to be always empty of water.12
We note here that an intermittent switching behavior between dry and wet states has been observed directly in other geometries such as plate-like68 or channel-like confinements.39, 41, 42, 69 The height of the energy (activation) barrier for nucleation of a bubble governs the kinetics of the transition.70, 71, 72
Results of level-set variational implicit solvent calculations
Initial solute-solvent interfaces
The solvent fluctuations observed in the R8 system pose a significant challenge to our model, since minimization of a free-energy functional with a given initial guess can only provide one solution describing a static solvent distribution. In order to address this issue we consider various different initial solvent boundaries. Provided the ability of VISM to efficiently describe interface fusions and breakups during its propagation, relaxation of the solute-solvent interface should either converge to a single solution, independent of the initial state and thus indicating a single global free-energy minimum, or to few distinct, metastable states, each reached from a different pool of initial conditions, indicating possible fluctuations of the solvent.
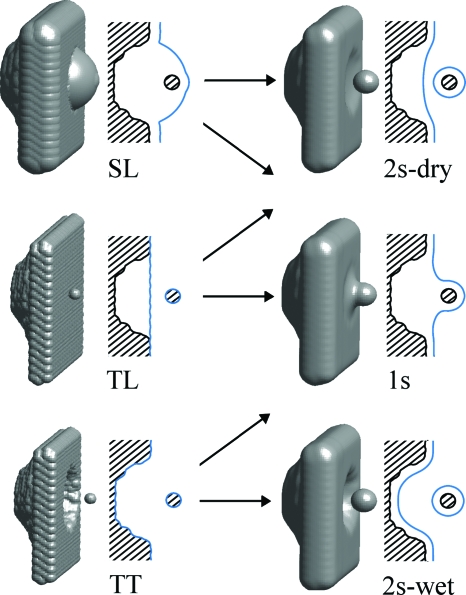
We found that all relevant solutions can be reached from three classes of initial solute-solvent interfaces (Fig. 5): (a) a single surface that loosely wraps the wall and the ligand together; (b) two separate surfaces that tightly follow the van der Waals surface of the solutes; (c) two separate surfaces, one enveloping the wall but not penetrating into the pocket and the other being equivalent to the methane van der Waals surface. Those three initial conditions are further referred to as single loose (SL) surface, two tight (TT) surfaces, and two loose (TL) surfaces, respectively.
Figure 5.
Examples of initial (left) and finally converged (right) solute-solvent interfaces in the R8 system. The shown 3D interfaces on the right are level-set solutions of the VISM Eq. 3. We also show a 2D view by intersecting through the system’s symmetry axis (shaded area: pocketed wall; blue lines: interfaces). Arrows indicate directions of the observed topological changes. The occurrence of a given topological change depends on methane-pocket distance d (see text for details).
Final solute-solvent interfaces
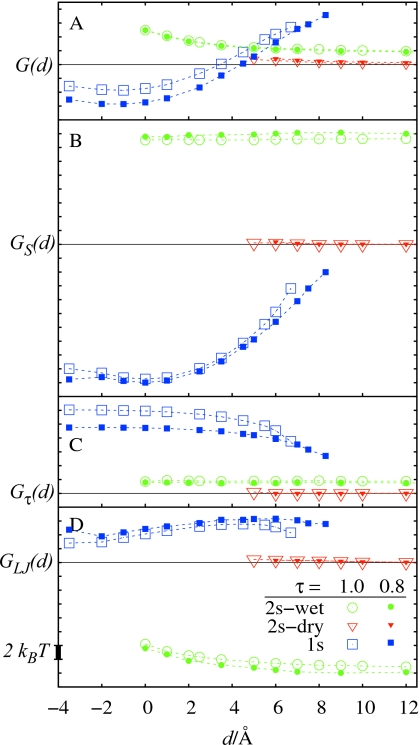
Starting our analysis with the R8 case, we note that the number of existing solutions depends on the ligand position (distance d). It gives rise to three distinct free-energy branches for G(d), which are plotted in Fig. 6, along with its individual contributions GS, Gτ, and GLJ [see Eq. 1]. Illustrative examples of the corresponding final solute-solvent interfaces are presented in Fig. 5. At first, let us focus on the results obtained with a curvature correction parameter τ=1.0 Å, leaving the discussion of effects related to its changes for the next section.
Figure 6.
Solvation free-energy branches for the R8 system and the contributions from the individual free-energy functional components vs d, obtained for two values of the curvature correction parameter τ=1.0 Å (empty symbols) and τ=0.8 Å (filled symbols). All curves are shifted with respect to the reference 2s-dry state. Notation: G(d)=total solvation free energy; GS(d)=surface area term; Gτ(d)=curvature correction term; GLJ(d)=LJ term.
For d>7 Å, two solutions are observed, each describing two separate solute-solvent surfaces. In both cases the interface around the methane molecule closely follows its van der Waals surface (when starting from the SL type of initial solute-solvent interface it requires surface to breakup during its subsequent relaxation). The pocketed wall is surrounded either by (a) solute-solvent interface that remains outside the pocket and corresponds to its dry state (2s-dry in Fig. 5) or (b) the solute-solvent interface that closely follows the pocket contours and corresponds to its wet state (2s-wet in Fig. 5). The former solution is reached from both SL and TL initial states while the latter from TT.
The existence of two different solutions indicates possible wetting-dewetting transitions within the pocket. However, contrary to the MD-derived free-energy dependence G(N), the dry state is favored over the wet by about 2 kBT. Also, unlike in G(N), there seems to be a free-energy barrier between the two, as otherwise the wet state would relax to the dry state.
It is interesting to note that the 2 kBT difference is relatively small compared to differences in the individual free-energy components. The surface energy GS of the 2s-wet state is about 15 kBT greater than of 2s-dry, but is ideally compensated by a lower solute-solvent dispersion energy GLJ. The 2 kBT offset turns out to be identical to the difference in the surface correction term, Gτ. While the perfect compensation of GS and Gτ may be coincidental, such result may also indicate that the energy penalty for a concave surface is overestimated by the form of Gτ used here, thus disfavoring the wet pocket state.
For d<7 Å, there appears a third solution, reached from the SL type of initial solute-solvent interface, which describes a single solvent surface enveloping both the pocket and the ligand together (1s in Fig. 5). Initially, this kind of solution has the highest free energy due to the large penalty for its concave curvature and relatively unfavorable dispersion energy arising from solvent expulsion from the region between the solutes. However, as the pocket-methane separation decreases, it gradually becomes the most favorable solution, predominantly owing to its smallest surface area.
The 2s-dry solution exists only until d≈4 Å, where the final solute-solvent interface corresponding to the TL type initial solute-solvent interface merges together into a 1s solution. Also at this point the 1s solution becomes more stable than the 2s-wet, which indicates that the region between the two solvated objects becomes preferably dry. It perfectly reproduces the trend observed in the MD-derived G(N) distributions (Fig. 3), where the preference toward dry over wet state is observed, starting at the critical distance of 4 Å.
As d decreases further, the 2s-wet solution becomes even more unfavorable. It is caused by increase in dispersion energy, arising from partial loss of pocket-solvent interactions due to the proximity of the region void of solvent occupied by the methane molecule. At d≈0 Å, the 2s-wet state collapses to the 1s-dry state, which remains the only solution for d<0 Å. Again, those changes in topology of the solvent distribution are in close agreement with MD results that indicate a complete extinction of the wet state as the methane molecule passes through d=0 Å.
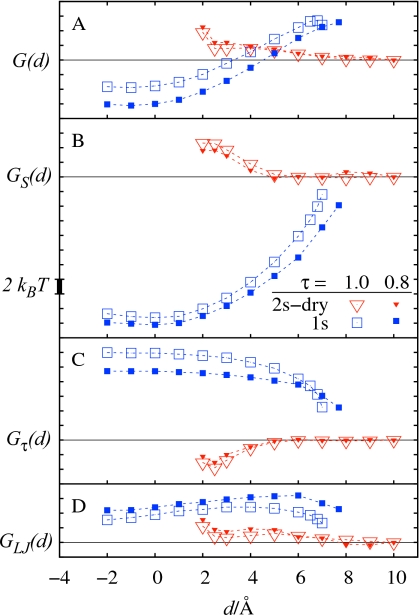
In the R5 system, irrespective of the considered initial solvent boundaries, all observed final solutions describe a dry pocket (see Fig. 7) consistent with the experiments.12 For large ligand distances there is only a single solution that represents two separate surfaces (2s-dry state). For d<7 Å, the initial SL interface relaxes to the 1s state, while the initial TT interface still results in the 2s-dry solution. Similarly as in the R8 system, the 1s state has initially a higher free energy than the 2s-dry state, due to the penalty for its concave curvature and relatively unfavorable dispersion energy. As the ligand separation decreases, a large decrease in surface area allows the 1s state to become more stable than 2s-dry. The crossover, which may be interpreted as expulsion of a water layer from the region between methane and the pocket, occurs at d≈4 Å. The now metastable 2s-state exists until d≈2 Å, and for smaller separations the only observed solution is 1s.
Figure 7.
Same as Fig. 6 but now for the R5 system.
Influence of curvature correction
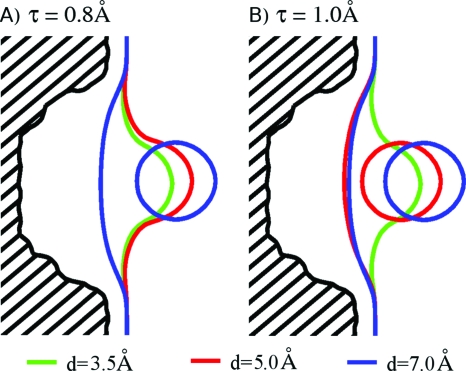
The most notable influence of changing the curvature correction parameter τ is on the stabilization of the 1s state with respect to the 2s-dry state (Figs. 678). For τ=0.8 Å, in both R8 and R5 systems, the 1s state exists at a relative larger solute separation and has relatively lower free energy than for τ=1.0 Å. At a relatively large intersolute distance, this stabilization is mostly due to the difference in the surface area term, as with smaller τ the relaxing interface tends to optimize (decrease) its surface area rather than curvature. The surface area effect is counterbalanced to some extent by a more favorable dispersion energy for the case of τ=1.0 Å. It is due to the fact that for a larger τ the interface exhibits the tendency to remain close to methane molecule owing to a greater benefit from maintaining a convex surface shape. This simultaneously leads to a greater solvent-occupied volume and more favorable solute-solvent interactions. Figure 8 displays two-dimensional (2D) projections of the final, equilibrium solute-solvent interface for the R8 system at various distances and with τ=0.8 Å and τ=1.0 Å, respectively. Notice that for d=5.0 Å the solute-solvent interface is 1s for τ=0.8 Å but is 2s-dry for τ=1.0 Å.
Figure 8.
Bisected view of the final solute-solvent interfaces corresponding to the minimum in the free energy Eq. 1 for the R8 system at various ligand distances and τ=0.8 and 1.0 Å, respectively.
At small d, the relative stabilization of 1s state for τ=0.8 Å is almost entirely due to the curvature correction term Gτ. It can be explained by noting that transferring the methane molecule deep into the pocket corresponds to its removal from the solvent during which changes in surface area and dispersion energy relative to the 2s-dry state are the same for both τ values. On the contrary, the effective surface tension associated with the convex methane surface is larger for τ=0.8 Å, hence leading to a larger free-energy gain upon the change in solvent interface area.
Surprisingly, the free-energy difference between the 2s-wet and 2s-dry states in the R8 system, governing the physically interesting balance between pocket wetting and dewetting, appears to be not particularly sensitive to the considered change in the τ value. A detailed analysis of the free-energy components plotted in Fig. 6 reveals that the almost perfect compensation of differences in GS and GLJ between the 2s-wet and 2s-dry states, described above for τ=1.0 Å, holds also for τ=0.8 Å.
Indicated by the higher surface area energy GS, the 2s-wet interface penetrates deeper into the pocket for τ=0.8 Å (such behavior is expected due to the smaller energy penalty associated with the concave interface for smaller τ). At the same time, however, it gains more favorable dispersion energy GLJ than in the corresponding 2s-wet state for τ=1.0 Å, which accounts for a similar GS-GLJ compensation. In both cases also Gτ has almost the same value when compared to the 2s-dry state. Based on those observations, it seems, that the metastable solvent behavior observed in MD for large solute separations could have been at least partially reproduced with a τ value close to 0.
It is worth stressing that the derivation of the curvature correction term is typically based on the assumption of convex and weakly curved solute geometries,55, 58, 59 and its symmetry with respect to the sign of the mean curvature should not be expected. The obtained results indicate the need for asymmetric higher order terms in the general curvature expansion of the surface tension for larger curvatures if possible.73 A heuristic but perhaps more feasible approach may just rely on two different τ coefficients used for positive and negative curvatures, respectively.
Potentials of mean force
The changes in the hydration free energy of the system, resulting from different placements of methane molecule along the z-axis, correspond to the solvent-mediated contributions to the methane-pocket interaction. It can be directly compared to the simulation results after subtracting the intersolute (vacuum) interaction from the total MD-derived PMF.
As described above, for most pocket-methane separations, the level-set VISM results provide multiple local free-energy minima that for a given d correspond to an ensemble {Γ}m of the most probable solvent configurations. Accounting for this fact, we express the actual free energy of the system as
| (7) |
where G″ is an arbitrary constant chosen to satisfy the condition that G(d→∞)=0.
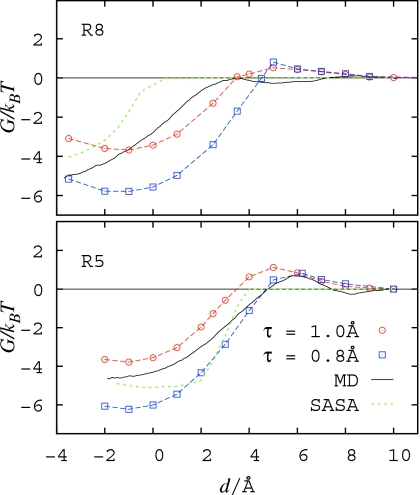
The obtained PMFs are presented in Fig. 9 together with MD simulation results and predictions of a simple model based on solvent accessible surface area (SASA). For the SASA model we used the effective surface tension parameter of 0.73 kJ∕mol∕Å2 that provides agreement with methane hydration free energy obtained in our MD simulations.
Figure 9.
Solvent-mediated PMF between the pocket and the ligand at a distance d for the systems R8 (top) and R5 (bottom). Level-set VISM results are calculated from the ensemble-average Eq. 7 over all existing free-energy branches (see Figs. 56) and are shown for τ=1.0 Å (circles) and τ=0.8 Å (squares). Notation: MD=MD simulation results and SASA=solvation free energy from SASA model.
The level-set VISM results are in overall good, semiquantitative agreement with MD. In both R8 and R5 systems, the onset of strong pocket-methane attraction around d≈4 Å, accompanied by expulsion of solvent from between the two objects, corresponds well to the distance where the 1s state becomes the most favorable one. Such a good agreement was not achieved by the SASA model in the R8 case, because the larger pocket can easily accommodate a methane molecule together with its associated SAS. Again, it underlines the ability of VISM to predict drying even though the solvent is sterically able to remain in the considered area. An ensemble averaging performed to estimate the average water occupancy in the R8 system from our level-set VISM approach
| (8) |
yields qualitative agreement with the MD as shown in Fig. 4, i.e., a maximum at d≃6.0 and 0 values for d<dc.
In contrast to the SASA based model, VISM successfully reproduces a ∼1kBT free-energy barrier for pocket-methane association in the R5 system. A close inspection of individual free-energy branches and their components (Fig. 7) indicates that this barrier can be attributed to increase in dispersion energy resulting from displacement of water from vicinity of R5 pocket, as well as to the development of concave solvent boundary bridging the two solutes. These correspond to the formation of surface singularities in the level-set relaxation of interface. The free-energy barrier occurs at the transition from the most favorable 2s-dry state to 1s state. By looking at the corresponding topological changes in the solvent distribution, it can be interpreted as the onset of methane dehydration which agrees well with previous analysis of the MD results.18 The free-energy barrier in the R5 system can thus be attributed to the disruption of the methane hydration shell.
The free-energy barrier predicted by VISM in the R8 system, although smaller than in R5 case, is overestimated relative to MD. As observed in MD simulations, the lack of a barrier in the R8 system may be related to a more efficient arrangement of solvent around the methane molecule; when it approaches the larger pocket, there is less constraining geometry of hydrophobic medium in this case. Thus, possibly depending on subtle solvent-solvent interactions, this effect is not accounted for in the VISM calculations.
The comparison of the results obtained for both values of the τ-parameter highlights the important role of curvature corrections in predicting the onset of drying and attraction. Surprisingly, the smaller τ value seems to promote and stabilize the dry state, even though it provides a lower energetic cost of maintaining a concave solvent boundary and hence the wet pocket state. It indicates that the dominant influence on the observed wetting-drying transition and the associated free-energy values stems from changes in the methane hydration. Indeed, dehydration of its convex surface, necessary for solvent expulsion from the region between methane and the pocket, is more favorable for smaller τ, thus likely explaining the observed trend. Those conclusions are also supported by MD simulations18, 52 which indicate that the convex solvent boundary is more stable than a planar or concave one, and that the major contribution to the methane—pocket PMF comes from methane dehydration rather than pocket dewetting.
CONCLUSIONS AND OUTLOOK
We have applied our level-set VISM to analyze hydration effects associated with ligand binding in a generic hydrophobic receptor-ligand system. Using explicit solvent MD simulations as a reference, we managed to reproduce the key aspects of the nontrivial solvent behavior: (1) wetting-dewetting transitions in the larger R8 binding pocket and their dependence on receptor-ligand separation, (2) a complete dewetting of the smaller R5 binding pocket consistent with experiments,12 and (3) solvent expulsion from the intersolute region governing the critical distance of strong attraction and binding. Reproduction of these effects remains beyond the reach of simple surface area based models, while it appears to be crucial for proper description of systems involving complex geometry of hydrophobic constraints.
The predicted free-energy changes remain in a good, almost quantitative agreement with MD-derived solvent contribution to ligand-receptor interactions. In particular, VISM reproduces well the free-energy barrier for pocket-ligand association in the R5 case, however at the same time, overestimates the barrier in R8 case. While still requiring further investigation, such ability may represent the first step toward obtaining a method that provides a means for proper interpretation of experimental receptor-ligand binding rates.8
Analysis of distinct contributions to the free-energy functional reveals an interesting interplay between the surface area term GS and the dispersion energy term GLJ in the regions enclosed by the hydrophobic medium. The surface term favors contraction of the solvent interface while the dispersion term promotes expansion of the wet phase, which results in a subtle balance necessary to reproduce wetting-dewetting transitions. Strikingly, such balance seems to exist even though neither of the two free-energy components depend directly on fitted parameters.
In turn, the adjustable magnitude of the curvature correction term Gτ appears to determine the onset of topological changes in the solvent distribution occurring upon ligand translocation. It is still unclear how to choose the relevant τ parameter value, however, the range between 0.8 and 1.0 Å considered here seems to be reasonable. The current form of Gτ is justified on the ground of previous theories,55, 58, 59 nonetheless, its applicability to concave interfaces is questionable. Accordingly, a formal derivation of curvature expansion of surface tensions that remains valid in a negative curvature range is an open, interesting problem.
Despite its simplicity, the considered model system is particularly challenging for an implicit solvent approach as it contains convex, flat, and concave hydrophobic surfaces involving different hydration regimes in explicit solvent. A close agreement with MD simulation results observed for both considered pocket sizes and for the whole range of receptor-ligand separations, indicates a sound physical basis of the VISM. The level-set method proved to be a suitable numerical approach to solve the underlying problem of free-energy functional minimization, owing to its ability to robustly describe topological changes in the solvent distribution such as volume fusions or breakups.
As a minimization based method, VISM is prone to finding local hydration free-energy minima that apparently exist even in relatively simple model systems like the ones considered here. The only stable solutions of the VISM partial differential Eq. 3 are global or local minima in the free-energy landscape of all existing interfaces. Currently our method does not allow fluctuations or trial moves of the interface or parts of the interfaces. Thus, minima mining or importance sampling, as employed in Monte Carlo schemes, are currently not possible, but are vital directions for the future development of level-set VISM. However, as the local minima are high probability equilibrium states, the ensemble average sampling Eq. 7 gives a good and representative account for the “real” free-energy systems as we have demonstrated in the comparison to the atomistic computer simulations.
Encountering the local minima may be problematic in some applications due to the need of exhaustive search of the available solution space. A necessary further step which expands the usability of VISM is the inclusion of thermal interface fluctuations (maybe as used for membranes74) and the true dynamical propagation of the interface75, 76 driven by the free-energy landscape Eq. 1. Ideally, such extension would allow for a true implicit solvent MD approach.
ACKNOWLEDGMENTS
This work was supported by the National Science Foundation (NSF) through Grant No. DMS-0511766 (L.-T.C.), DMS-0811259 (B.L.), by the Center for Theoretical Biological Physics (B.L., J.A.M, and Z.W.) (Grant No. NSF PHY-0822283), by the Department of Energy through Grant No. DE-FG02-05ER25707 (B.L.), and by a Sloan Fellowship (L.-T.C.). J.D. thanks the Deutsche Forschungsgemeinschaft (DFG) for support within the Emmy-Noether Programme and the Bavaria California Technology Center (BaCaTeC) for travel grants. Work in the McCammon group is supported in part by NSF, NIH, HHMI, CTBP, NBCR, and Accelrys.
References
- Tanford C., Hydrophobic Effect: Formation of Micelles and Biological Membranes (Wiley, New York, 1973). [Google Scholar]
- Chandler D., Nature (London) 437, 640 (2005). 10.1038/nature04162 [DOI] [PubMed] [Google Scholar]
- Meyer E. E., Rosenberg K. J., and Israelachvili J., Proc. Natl. Acad. Sci. U.S.A. 103, 15739 (2006). 10.1073/pnas.0606422103 [DOI] [PMC free article] [PubMed] [Google Scholar]
- Ball P., Nature (London) 423, 25 (2003). 10.1038/423025a [DOI] [PubMed] [Google Scholar]
- Kauzmann W., Adv. Protein Chem. 14, 1 (1959). 10.1016/S0065-3233(08)60608-7 [DOI] [PubMed] [Google Scholar]
- Sui H., Han B. G., Lee J. K., Walian P., and Jap B. K., Nature (London) 414, 872 (2001). 10.1038/414872a [DOI] [PubMed] [Google Scholar]
- Young T., Abel R., Kim B., Berne B. J., and Friesner R. A., Proc. Natl. Acad. Sci. U.S.A. 104, 808 (2007). 10.1073/pnas.0610202104 [DOI] [PMC free article] [PubMed] [Google Scholar]
- Uchida T., Ishimori K., and Morishima I., J. Biol. Chem. 272, 30108 (1997). 10.1074/jbc.272.48.30108 [DOI] [PubMed] [Google Scholar]
- Carey C., Cheng Y. K., and Rossky P. J., Chem. Phys. 258, 415 (2000). 10.1016/S0301-0104(00)00178-6 [DOI] [Google Scholar]
- Levy Y. and Onuchic J. N., Annu. Rev. Biophys. Biomol. Struct. 35, 389 (2006). 10.1146/annurev.biophys.35.040405.102134 [DOI] [PubMed] [Google Scholar]
- Ahmad M., Gu W., and Helms V., Angew. Chem. Int., Ed. 47, 7626 (2008). 10.1002/anie.200801856 [DOI] [PubMed] [Google Scholar]
- Qvist J., Davidovic M., Hamelberg D., and Halle B., Proc. Natl. Acad. Sci. U.S.A. 105, 6296 (2008). 10.1073/pnas.0709844105 [DOI] [PMC free article] [PubMed] [Google Scholar]
- Braaten D., Ansari H., and Luban J., J. Virol. 71, 2107 (1997). [DOI] [PMC free article] [PubMed] [Google Scholar]
- Modis Y., Ogata S., Clements D., and Harrison S., Proc. Natl. Acad. Sci. U.S.A. 100, 6986 (2003). 10.1073/pnas.0832193100 [DOI] [PMC free article] [PubMed] [Google Scholar]
- Modis Y., Proc. Natl. Acad. Sci. U.S.A. 105, 18647 (2008). 10.1073/pnas.0810508106 [DOI] [PMC free article] [PubMed] [Google Scholar]
- Gibb C. L. D., Xi H., Politzer P. A., Concha M., and Gibb B. C., Tetrahedron 58, 673 (2002). 10.1016/S0040-4020(01)01104-8 [DOI] [Google Scholar]
- Berne B. J., Weeks J. D., and Zhou R., Annuv. Rev. Phys. Chem. 60, 85 (2009). 10.1146/annurev.physchem.58.032806.104445 [DOI] [PMC free article] [PubMed] [Google Scholar]
- Setny P., J. Chem. Phys. 127, 054505 (2007). 10.1063/1.2749250 [DOI] [PubMed] [Google Scholar]
- Roux B. and Simonson T., Biophys. Chem. 78, 1 (1999). 10.1016/S0301-4622(98)00226-9 [DOI] [PubMed] [Google Scholar]
- Feig M. and C. L.BrooksIII, Curr. Opin. Struct. Biol. 14, 217 (2004). 10.1016/j.sbi.2004.03.009 [DOI] [PubMed] [Google Scholar]
- Lee B. and Richards F. M., J. Mol. Biol. 55, 379 (1971). 10.1016/0022-2836(71)90324-X [DOI] [PubMed] [Google Scholar]
- Richards F. M., Annu. Rev. Biophys. Bioeng. 6, 151 (1977). 10.1146/annurev.bb.06.060177.001055 [DOI] [PubMed] [Google Scholar]
- Connolly M. L., J. Appl. Crystallogr. 16, 548 (1983). 10.1107/S0021889883010985 [DOI] [Google Scholar]
- Connolly M. L., J. Mol. Graphics 11, 139 (1993). 10.1016/0263-7855(93)87010-3 [DOI] [PubMed] [Google Scholar]
- Richmond T. J., J. Mol. Biol. 178, 63 (1984). 10.1016/0022-2836(84)90231-6 [DOI] [PubMed] [Google Scholar]
- Gallicchio E. and Levy R. M., J. Comput. Chem. 25, 479 (2004). 10.1002/jcc.10400 [DOI] [PubMed] [Google Scholar]
- Wagoner J. A. and Baker N. A., Proc. Natl. Acad. Sci. U.S.A. 103, 8331 (2006). 10.1073/pnas.0600118103 [DOI] [PMC free article] [PubMed] [Google Scholar]
- Fixman F., J. Chem. Phys. 70, 4995 (1979). 10.1063/1.437340 [DOI] [Google Scholar]
- Davis M. E. and McCammon J. A., Chem. Rev. (Washington, D.C.) 90, 509 (1990). 10.1021/cr00101a005 [DOI] [Google Scholar]
- Sharp K. A. and Honig B., J. Phys. Chem. 94, 7684 (1990). 10.1021/j100382a068 [DOI] [Google Scholar]
- Fogolari F., Brigo A., and Molinari H., J. Mol. Recognit. 15, 377 (2002). 10.1002/jmr.577 [DOI] [PubMed] [Google Scholar]
- Grochowski P. and Trylska J., Biopolymers 89, 93 (2008). 10.1002/bip.20877 [DOI] [PubMed] [Google Scholar]
- Che J., Dzubiella J., Li B., and McCammon J. A., J. Phys. Chem. B 112, 3058 (2008). 10.1021/jp7101012 [DOI] [PubMed] [Google Scholar]
- Li B., SIAM J. Math. Anal. 40, 2536 (2009). 10.1137/080712350 [DOI] [Google Scholar]
- Li B., Nonlinearity 22, 811 (2009). 10.1088/0951-7715/22/4/007 [DOI] [Google Scholar]
- Still W. C., Tempczyk A., Hawley R. C., and Hendrickson T., J. Am. Chem. Soc. 112, 6127 (1990). 10.1021/ja00172a038 [DOI] [Google Scholar]
- Bashford D. and Case D. A., Annu. Rev. Phys. Chem. 51, 129 (2000). 10.1146/annurev.physchem.51.1.129 [DOI] [PubMed] [Google Scholar]
- Baker N. A., Curr. Opin. Struct. Biol. 15, 137 (2005). 10.1016/j.sbi.2005.02.001 [DOI] [PubMed] [Google Scholar]
- Beckstein O. and Sansom M. S. P., Proc. Natl. Acad. Sci. U.S.A. 100, 7063 (2003). 10.1073/pnas.1136844100 [DOI] [PMC free article] [PubMed] [Google Scholar]
- Hummer G., Rasaiah J. C., and Noworyta J. P., Nature (London) 414, 188 (2001). 10.1038/35102535 [DOI] [PubMed] [Google Scholar]
- Dzubiella J., Allen R. J., and Hansen J. -P., J. Chem. Phys. 120, 5001 (2004). 10.1063/1.1665656 [DOI] [PubMed] [Google Scholar]
- Dzubiella J. and Hansen J. -P., J. Chem. Phys. 122, 234706 (2005). 10.1063/1.1927514 [DOI] [PubMed] [Google Scholar]
- Dzubiella J., Swanson J. M. J., and McCammon J. A., Phys. Rev. Lett. 96, 087802 (2006). 10.1103/PhysRevLett.96.087802 [DOI] [PubMed] [Google Scholar]
- Dzubiella J., Swanson J. M. J., and McCammon J. A., J. Chem. Phys. 124, 084905 (2006). 10.1063/1.2171192 [DOI] [PubMed] [Google Scholar]
- Chen J. and C. L.BrooksIII, J. Am. Chem. Soc. 129, 2444 (2007). 10.1021/ja068383+ [DOI] [PMC free article] [PubMed] [Google Scholar]
- Cheng L. -T., Dzubiella J., McCammon J. A., and Li B., J. Chem. Phys. 127, 084503 (2007). 10.1063/1.2757169 [DOI] [PubMed] [Google Scholar]
- Osher S. and Sethian J. A., J. Comput. Phys. 79, 12 (1988). 10.1016/0021-9991(88)90002-2 [DOI] [Google Scholar]
- Osher S. and Fedkiw R., Level Set Methods and Dynamic Implicit Surfaces (Springer, New York, 2002). [Google Scholar]
- Sethian J. A., Level Set Methods and Fast Marching Methods: Evolving Interfaces in Geometry, Fluid Mechanics, Computer Vision, and Materials Science, 2nd ed. (Cambridge University Press, Cambridge, 1999). [Google Scholar]
- Cheng L. -T., Xie Y., Dzubiella J., McCammon J. A., Che J., and Li B., J. Chem. Theory Comput. 5, 257 (2009). 10.1021/ct800297d [DOI] [PMC free article] [PubMed] [Google Scholar]
- Setny P. and Geller M., J. Chem. Phys. 125, 144717 (2006). 10.1063/1.2355487 [DOI] [PubMed] [Google Scholar]
- Setny P., J. Chem. Phys. 128, 125105 (2008). 10.1063/1.2839885 [DOI] [PubMed] [Google Scholar]
- Jorgensen W. L., Madura J. D., and Swenson C. J., J. Am. Chem. Soc. 106, 6638 (1984). 10.1021/ja00334a030 [DOI] [Google Scholar]
- Reiss H., Frisch H. L., and Lebowitz J. L., J. Chem. Phys. 31, 369 (1959). 10.1063/1.1730361 [DOI] [Google Scholar]
- Reiss H., Adv. Chem. Phys. 9, 1 (1965). 10.1002/9780470143551.ch1 [DOI] [Google Scholar]
- Stillinger F. H., J. Solution Chem. 2, 141 (1973). 10.1007/BF00651970 [DOI] [Google Scholar]
- Ashbaugh H. S. and Pratt L. R., Rev. Mod. Phys. 78, 159 (2006). 10.1103/RevModPhys.78.159 [DOI] [Google Scholar]
- Boruvka L. and Neumann A. W., J. Chem. Phys. 66, 5464 (1977). 10.1063/1.433866 [DOI] [Google Scholar]
- König P. -M., Roth R., and Mecke K. R., Phys. Rev. Lett. 93, 160601 (2004). 10.1103/PhysRevLett.93.160601 [DOI] [PubMed] [Google Scholar]
- Roth R., Harano Y., and Kinoshita M., Phys. Rev. Lett. 97, 078101 (2006). 10.1103/PhysRevLett.97.078101 [DOI] [PubMed] [Google Scholar]
- de Gennes P. -G. and Brochart-Wyart F., Capillary and Wetting Phenomena (Springer, New York, 1983). [Google Scholar]
- Vega C. and de Miguel E., J. Chem. Phys. 126, 154707 (2007). 10.1063/1.2715577 [DOI] [PubMed] [Google Scholar]
- Huang D. M., Geissler P. L., and Chandler D., J. Phys. Chem. B 105, 6704 (2001). 10.1021/jp0104029 [DOI] [Google Scholar]
- Rajamani S., Truskett T. M., and Garde S., Proc. Natl. Acad. Sci. U.S.A. 102, 9475 (2005). 10.1073/pnas.0504089102 [DOI] [PMC free article] [PubMed] [Google Scholar]
- Chuev G. N. and Sokolov V. F., J. Phys. Chem. B 110, 18496 (2006). 10.1021/jp061491y [DOI] [PubMed] [Google Scholar]
- Courant R., Freidrichs K., and Lewy H., IBM J. Res. Dev. March, 215 (1967).
- Sussman M., Smererka P., and Osher S., J. Comput. Phys. 114, 146 (1994). 10.1006/jcph.1994.1155 [DOI] [Google Scholar]
- Choudhury N. and Pettitt B. M., J. Am. Chem. Soc. 129, 4847 (2007). 10.1021/ja069242a [DOI] [PMC free article] [PubMed] [Google Scholar]
- Allen R., Melchionna S., and Hansen J. -P., Phys. Rev. Lett. 89, 175502 (2002). 10.1103/PhysRevLett.89.175502 [DOI] [PubMed] [Google Scholar]
- Leung K. and Luzar A., J. Chem. Phys. 113, 5845 (2000). 10.1063/1.1290479 [DOI] [Google Scholar]
- Luzar A. and Leung K., J. Chem. Phys. 113, 5836 (2000). 10.1063/1.1290478 [DOI] [Google Scholar]
- Leung K., Luzar A., and Bratko D., Phys. Rev. Lett. 90, 065502 (2003). 10.1103/PhysRevLett.90.065502 [DOI] [PubMed] [Google Scholar]
- Stewart M. C. and Evans R., Phys. Rev. E 71, 011602 (2005). 10.1103/PhysRevE.71.011602 [DOI] [PubMed] [Google Scholar]
- Brown F. L. H., Annu. Rev. Phys. Chem. 59, 685 (2008). 10.1146/annurev.physchem.59.032607.093550 [DOI] [PubMed] [Google Scholar]
- Dzubiella J., J. Chem. Phys. 126, 194504 (2007). 10.1063/1.2734962 [DOI] [PubMed] [Google Scholar]
- Mittal J. and Hummer G., Proc. Natl. Acad. Sci. U.S.A. 105, 20130 (2008). 10.1073/pnas.0809029105 [DOI] [PMC free article] [PubMed] [Google Scholar]


