Abstract
The theoretical understanding of encapsulated microbubble response to high-frequency ultrasound (HFUS) excitation is still limited although some novel experimental HFUS contrast imaging techniques have been well developed. In this paper, the higher-order modal (HOM) contributions to the scattered field are studied for such microbubbles driven by 1–100 MHz ultrasound. An exact solution of all small-amplitude vibrational modes of a single encapsulated microbubble in water is given by the wave scattering theory (WST) method and compared to results obtained from Church’s Rayleigh–Plesset-like model for the small-amplitude radial oscillation of a microbubble in an incompressible fluid. From numerical results, we show that the HOM field contribution is significant for scattering properties from individual Nycomed microbubbles with normalized frequency ≥0.2. It is also shown that the multiple scattering is strengthened for monodispersed Definity® microbubbles of 3 μm radius at frequencies >40 MHz. However, comparisons between the authors’ analyses and known experimental data for polydispersed Definity® microbubbles indicate that the HOM contributions are insignificant in attenuation estimation at frequencies <50 MHz. In conclusion, the WST model analysis suggests that HOM scattering is an important consideration for single bubbles but may be less critical in the modeling of polydispersed Definity® bubbles at high frequencies.
INTRODUCTION
Low-frequency ultrasound imaging systems clearly lack the spatial resolution to examine the microcirculation, although details obtained at this level may be important to both clinical and basic medical science, for example, in the hypertensive microcirculation (James et al., 2006). Recently, microbubble contrast agents have been successfully extended to a variety of high-frequency ultrasound (HFUS) imaging systems and have made possible non-invasive slow blood flow measurements and targeted molecular imaging with high contrast in the microcirculation (Lanza et al., 1997; Goertz et al., 2007b; Goessling et al., 2007; Needles et al., 2008; Yeh et al., 2008). In support of these imaging methods, the acoustic properties of microbubbles at higher frequencies have also been intensively studied through experimental observations of attenuation and nonlinear scattering activities (e.g., Moran et al., 2002; Goertz et al., 2006; Goertz et al., 2007a; Cheung et al., 2008). However, the understanding of microbubble dynamics at high frequencies is still incomplete, especially with regard to knowledge of resonant bubble sizes, attenuation prediction, and nonlinear scattering mechanisms. Similarly, the acoustic radiation forces on microbubbles subject to HFUS have not been investigated although some targeted applications have already been reported (Lanza et al., 1997; Rychak et al., 2007).
Multiple models have been employed for studying the dynamics of encapsulated microbubble contrast agents in the conventional frequency range (1–10 MHz). The most common models rely on Rayleigh–Plesset-like (RPL) ordinary differential equations and account for only bubble radial pulsation (de Jong et al., 1994; Church, 1995; Hoff, 2001). Analytical solutions for both linear and nonlinear scattering from individual microbubbles encapsulated by a shell of Kelvin–Voigt viscoelastic solid are provided in such RPL models. Multiple scattering of bubbles was thus achieved in sound dispersion and attenuation (Church, 1995; Hoff, 2001) by Foldy’s theory (Foldy, 1945). The RPL model has been extensively developed for various contrast microbubbles with different encapsulations and surrounding liquids (Sarkar et al., 2005; Doinikov and Dayton, 2007); it has also been proven effective in predicting the sound properties of ultrasound contrast agents in conventional ultrasound imaging (Frinking and de Jong, 1998; Coussios et al., 2004). However, RPL models only consider the radial pulsation of bubbles and usually assume a uniform internal gas pressure, i.e., no inertial effect of the gas core. These approximations may not be appropriate for microbubbles subject to HFUS field. At higher frequencies, the wavelength decreases to the order of magnitude of some particle sizes and falls into an intermediate wavelength regime in which the higher-order contracting movements become important and anisotropic scattering begins to appear (McClements, 1996; Ye, 1996). Moreover, the shell properties for Definity® bubbles estimated by modeling experimental attenuation measurements with an RPL-based method differed between the low- and high-frequency regimes, as reported by Goertz et al. (2007a). This would imply that traditional modeling methods need to be improved for microbubble oscillation at high frequencies, with the higher-order modal (HOM) scattering contribution requiring particular attention.
The wave scattering theory (WST) has also been employed in the past decade in studies of the dynamics of encapsulated microbubble surrounded by water and oscillating in the linear regime (Ye, 1996; Allen et al., 2001; Hu et al., 2004; Chen and Zhu, 2005). The WST method was originally developed for object detection by the underwater acoustics industry and has been intensively used to predict acoustic scattering from both spherical and cylindrical scatterers immersed in various surrounding fluids over the past two decades (Ayres et al., 1987; Gaunaurd and Werby, 1991; Hasheminejad and Safari, 2005; Mitri and Fellah, 2006). While the RPL equation is derived from a fluid velocity potential, through simplification it is reduced to a simple dynamic mass-spring system for the radial oscillation of the bubble without any shape oscillations. In contrast, the wave-based interaction between ultrasound and bubble in the WST method is retained in its description of multi-modal velocity potentials of the acoustic waves propagating through the surrounding fluid, the shell layer, and the internal gas. The first modal component of this velocity potential corresponds to the radial oscillation, and each additional mode represents a non-spherical oscillation mode of unique shape complexity. Under the quasi-equilibrium approximation and the small-amplitude assumption, all the oscillation modes are orthogonal and the total scattering of the bubble can be found from their linear summation. As a result, the WST method reveals directionality of the scattering. Ye (1996) first used the WST method to model the contrast microbubble as an individual elastic shell in inviscid water and qualitatively compared his results with Church’s viscoelastic shell bubble model in incompressible, viscous water. He noted that the scattering by Albunex® bubbles from WST prediction could be highly anisotropic at frequencies above resonance. Allen et al. (2001) studied the reflectivity and scattering directivity of microbubble at high driving frequencies with the WST model and proposed the potential applicability of “shell” Lamb waves, which propagate as symmetric (flexural) and antisymmetric (extensional) modes of deformation in a curved plate idealized for shell. The double-layered shell, which is typically used for encapsulated drug delivery, has never been explored by the RPL model but was investigated using the WST model by Hu et al. (2004). The employment of WST provides an alternative method to predict the acoustic scattering properties of contrast microbubbles. However, previous WST studies provided only initial theoretical details, and the HOM components were actually found to be negligible for microbubbles in conventional ultrasound imaging. No comparisons between the WST and RPL models have been performed, and the multiple scattering of contrast microbubbles due to anisotropic effects has not been predicted with the WST model. The significance of the HOM scattering contribution in microbubbles under higher frequency excitation is still pending.
The aim of this work is to assess the HOM contributions to scattering at both low- and high-frequency excitations as modeled by the WST model and to compare them to a dilatation-only model. This is accomplished with the following steps. First, the modeling of the same encapsulated microbubble by both WST and RPL methods is outlined. Second, the HOM contributions to the total scattering of the microbubble are compared within the WST method, and successively, the acoustic scattering properties of the microbubbles such as scattering cross section, attenuation, and acoustic radiation forces are simulated by both models and are compared to reveal the significance of HOM contributions. Finally, a discussion follows for physical interpretations of differences between the two models and the prospects of the WST method in modeling of microbubble response at high frequencies.
METHOD
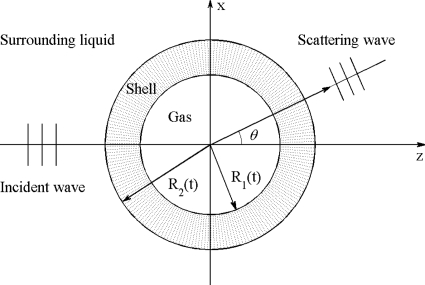
The encapsulated microbubble model consists of a spherical shell located in a spherical coordinate system, shown in Fig. 1. An incident plane ultrasound wave excites the bubble in the direction θ=0. The gas enclosed by the shell is assumed to be air, and the surrounding fluid is water. The bubble geometry is given by inner radius R1, outer radius R2, and shell thickness d. The shell is considered to be a thin monolayer of Kelvin–Voigt-type viscoelastic solid. The water is assumed to be inviscid and compressible for the wave scattering analyses. The incident ultrasound pressure is sufficiently small such that the vibration of the bubble can be approximated as a spherical oscillation within the linear regime. For simplicity, the damping due to liquid viscosity and thermal conductivity, as well as surface tension effects, are ignored because they have been proven to be of little importance for micron-sized encapsulated microbubbles in the frequency range of 1–100 MHz by previous studies (Church, 1995; Hoff, 2001).
Figure 1.
Schematic sketch of the model.
Outline of WST on encapsulated microbubbles
Ye’s (1996) Albunex® bubble model consisted of a spherical gas-filled bubble coated with a layer of elastic solid; an exact solution for its wall motion was obtained based on the literature of Hasegawa et al. (1993). The vector wave potentials in the work of Hasegawa et al. are expanded with factors for each eigenterm using a differential form of the associated Legendre function. In contrast, other contributions (Ayres and Gaunaurd, 1987; Ayres et al., 1987) expanded the vector potentials as sums of modal series without any differential forms of Legendre function. This so-called “Debye potential” expansion method has been widely used, and it has proved to be more numerically robust for modeling contrast microbubbles (Allen et al., 2001). Allen et al. (2001) extended the calculations from elastic to viscoelastic shell models by directly applying the viscoelastic material parameters from Ayres et al. (1987) into the scattering matrix for an elastic shell. Chen and Zhu (2005) gave a rigorous derivation for the matrix elements of a Kelvin–Voigt viscoelastic shell model and proved that they are the same as those for the elastic shell model of Ayres et al. (1987). In this work, Chen and Zhu’s results are quoted below to outline key steps and variables.
Let the potentials of incident and scattering waves in water be noted as Φi and Φs, respectively, and the potential inside the shell be Φa. Let Φ2,Ψ2 denote the longitudinal and shear wave potentials propagating in the solid layer, which satisfy the Helmholtz equations,
| (1) |
where kd and ks are acoustic wave numbers in the solid shell layer and given as complex forms by Ayres and Gaunaurd (1987). The Lamé parameters of various shell materials are given in the complex forms by λ=λe+iωλv and μ=Gs+iωμs. The real and imagery parts represent elastic and viscous properties of the shell, respectively.
Expanding the acoustic field in each of the three media in terms of norm modes and taking the symmetry into account, it yields
| (2a) |
| (2b) |
| (2c) |
| (2d) |
| (2e) |
where k1 and k3 are the wave numbers in the water and in the gas, respectively, Pn(⋅) is the Legendre polynomial of order n, jn(⋅) is the spherical Bessel function of order n, nn(⋅) is the spherical Neumann function of order n, and is the spherical Hankel function of the first kind. Finally, the coefficients an,bn,cn,dn,en,fn are unknowns determined by the boundary conditions noted below; an specifically is the scattering coefficient. Under this framework, the determination of the sound scattering from an encapsulated bubble comes down to the evaluation of the an.
Solution begins by applying the following approximate boundary conditions at the two spherical interfaces between the media: (1) the continuity of normal displacement ur; (2) the continuity of normal stress τrr; (3) the tangential stress τrθ must be zero; six equations are obtained:
At the water-shell interface (r=R2),
| (3a) |
At the shell-gas interface (r=R1),
| (3b) |
Here, the superscripts denote the following: 1, incident waves; 2, waves propagating in the layer; 3, waves propagating in the inner air; 4, scattering waves.
Substituting the velocities and displacements in Eq. 6 of Ayres and Gaunaurd (1987) into the six boundary equations, the corresponding matrix equation is obtained,
| (4) |
From this matrix equation, we can solve for the scattering coefficients (an) by Cramer’s rule. The elements of the matrices αij(i,j=1–6) are also determined by the matrix equation, and their expressions can be found from appendices of previous literature (Ayres et al., 1987; Chen and Zhu, 2005).
Using asymptotic expansions of Hankel functions, the scattering from an encapsulated microbubble in the far field can be expressed in terms of a modal series as follows:
| (5) |
Here, f(θ) is the scattering (form) function. Each term fn(θ) represents the nth partial wave of the scattering. Generally, only the monopole scattering, i.e., the first term f0, needs to be considered for Rayleigh scatterers (k1R2⪡1). It is also stated that the extinction cross section and the sound reflectivity of the bubble are proportional to the imaginary part of forward scattering f(0) and the amplitude of backward scattering f(π), respectively (Ye, 1996). The scattering function can also be linked to the scattering cross section,
| (6) |
The reduced scattering cross section σr(θ) is defined here by σs(θ) multiplying a factor of for later convenience. Here, σr(θ) is noted as the “total” reduced scattering cross section since it is the infinite sum of all contributing scattering modes, according to Eqs. 5, 6; in practice, however, the sum is truncated to an approximate representation. In order to study the modal contributions, we also use the symbol to represent the sum truncated to the first m+1 modes, i.e., mode 0 to mode m; thus, the contribution from mode m to the total scattering cross section σr(θ) in the WST model is for m=0 or for m>0. It is important to note that for a mode m, the sum still contains lower modal contributions; thus, the contribution from a single mode is coupled to the modes below it.
RPL equation for encapsulated microbubbles
The linear harmonic oscillation of an encapsulated microbubble can be written in a simple form using the RPL equation (Church, 1995; Hoff, 2001),
| (7) |
where x is the normalized small displacement to the first order of the inner shell wall, defined by R1=R10(1+x), x⪡1 where R10 represents the initial inner shell radius; ω, ρs, and pa are the angular driving frequency, the density of shell, and the acoustic pressure amplitude, respectively. The scattering cross section σs for our model can be given as
| (8) |
where
Here, only the damping terms due to acoustic radiation βac and shell viscosity βsh are considered. The above-listed expressions are simplified from a corresponding Church’s RPL model (Church, 1995; Khismatullin, 2004). The compressibility of surrounding liquid is neglected here but can be implemented by some other RPL models in the low-frequency limit (Trilling, 1952; Keller and Miksis, 1980). Finally, the RPL model neglects the surface tension on both interfaces and the viscous effects of the surrounding liquid in order to compare with WST, which as noted above does not include these effects.
RESULTS
The simulation results of both WST and RPL models were performed using MATLAB® software (Version 14, The Mathworks Inc., and Natick, MA) and are compared in the following sections. Three types of contrast bubbles are simulated. We primarily examine Albunex® microbubbles, which have been best characterized in the literature, especially with regard to their shell material. In order to compare the theoretical models with the existing measurements, lipid-shelled Definity® microbubbles are also simulated. Finally, the polymer shell of Nycomed microbubbles is also simulated for discussion since they have a fixed thickness-to-radius ratio in contrast to the fixed thickness seen in Albunex® bubbles. All physical parameters used in the simulations are selected from previous works and provided in Table 1 if not specified elsewhere. In addition, the Lamé first parameters λe and λv have little influence on bubble scattering properties, and consistent values of 6.1×10⁴ MPa and 50 Pa s are selected here (Chen and Zhu, 2005).
Table 1.
Parameter values for aqueous suspensions of Albunex®, Definity®, and Nycomed bubbles. Listed values are given by Church (1995) except those noted in the footnotes.
| Symbol | (Value) | Unit | |||
|---|---|---|---|---|---|
| Albunex® | Definity® | Nycomed | |||
| Shell | Gs | (88.8) | (190)c d, d | (12)e f, f | MPa |
| μs | (1.77) | (0.07)c d, d | ⋯ | Pa s | |
| λe | (6.1×10⁴)b | (6.1×10⁴)b | (6.1×10⁴)b | MPa | |
| λv | (50)b | (50)b | ⋯ | Pa s | |
| ωλv | ⋯ | ⋯ | (0.5×10⁶)a | Pa | |
| ωμs | ⋯ | ⋯ | (0.1×10⁵)a | Pa | |
| d | (15) | (0.9)d | (0.05a)a e, e | nm | |
| ρs | (1100) | (1100) | (1100) | kg m−3 | |
| Liquid | ρL | (1000) | (1000) | (1000) | kg m−3 |
| Gas | γ | (1.4) | (1.06)c | (1.1)f | ⋯ |
| p0 | (0.1013) | (0.1013) | (0.1013) | MPa | |
Scattering cross section: Modal contributions
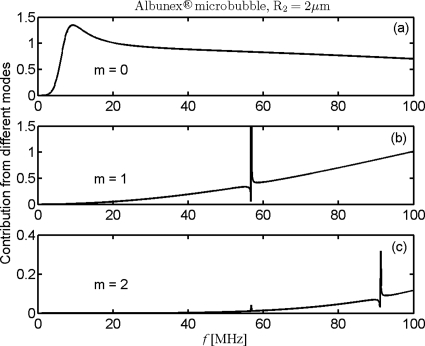
The contributions of the first three modes to the reduced scattering cross section are examined by the term defined just below Eq. 6 and shown in Fig. 2. A single Albunex® bubble with radius of 2 μm is selected for investigation. Strong resonant peaks are observed in the figure at about 10, 56, and 90 MHz corresponding to these modes; the mode 2 plot in Fig. 2c has a notable peak at the resonant frequency of mode 1 due to coupling. The figure also shows that mode 0, i.e., monopole scattering in Fig. 2a, is far greater in magnitude than modes 1 and 2 and dominates the total scattering at low frequencies (<20 MHz). The contribution of mode 1 in Fig. 2b first becomes significant at 20 MHz and increases rapidly with the driving frequency, exceeding that of mode 0 above 80 MHz. At 100 MHz, modes 0 and 1 contribute 0.7 and 1.0 to the total reduced scattering cross section of about 1.9. The contribution of the third mode (m=2) in Fig. 2c becomes important at 60 MHz and is expected to be more significant than the first two modes at frequencies higher than 100 MHz. It is verified here that the higher modes contribute greatly to the total scattering of Albunex® bubbles at high frequencies. Moreover, further calculations for Definity® bubbles with radius between 1 and 6 μm indicate that, depending on bubble size and shell properties, the HOM can contribute greatly to the total scattering in the frequency range under 100 MHz. Following previous work, we explored multiple truncations of the WST modal sums; this analysis suggested that the first 30 modes are sufficient to approximately represent the total scattering at frequencies <100 MHz (error in scattering amplitude <0.1%). The HOM contribution can be easily seen from the differences between monopole (mode 0) and total (all modes) scattering of WST model.
Figure 2.
Contribution of first three modes of WST model as a function of driving frequency. The Albunex® bubble is 2 μm in radius.
Scattering cross section: Directionality
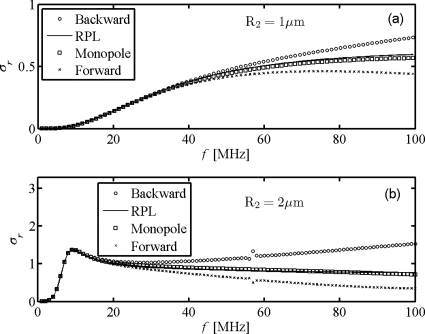
The reduced scattering cross sections of the Albunex® bubbles with radius either larger or less than the critical radius Rc=1.46 μm (Khismatullin, 2004) are shown in Fig. 3. To further understand the differences between the methods, we compare four terms of acoustic scattering: the backward scattering, the forward scattering, and the monopole scattering component from the WST model and the scattering from RPL model. It is apparent for a single Albunex® bubble with radius 1 μm in Fig. 3a that the four curves overlap at driving frequencies below 20 MHz, but significant differences begin to appear above 30 MHz. These differences in the magnitudes of reduced backward scattering and forward scattering clearly indicate directivity in the scattered field. Although the monopole is similar to the RPL model, it is obvious that its scattering also exhibits differences at high frequencies. From strong to weak, the four terms are in the order by backward scattering from WST>scattering from RPL>monopole scattering from WST>forward scattering from WST. For the large bubbles with 2 μm in radius, the resonances appear in Fig. 3b and act as boundaries to separate the low- and high-frequency ranges. Identical profiles are obtained for the four terms in the low-frequency range <13 MHz, but significant differences between them occur above resonance. Compared with Fig. 3a, the scattering directivity in Fig. 3b is strengthened, and the additional peaks at higher frequencies begin to appear in both backward and forward scattering. These peaks in scattering cross sections are associated with various shell Lamb wave modes. Therefore, the results not only indicate that the monopole scattering component is dominant for the microbubble scattering at low driving frequencies, as was proved by Ye (1996), but also demonstrate that shell Lamb waves exist for Albunex® microbubbles at high frequencies, a finding of Allen et al. (2001). In addition, our results show that the RPL and WST models are identical for low ultrasound frequencies, but the HOM contribute greatly to the total at high frequencies. Further calculations show that the microbubbles with hard shells have more violent resonance peaks, which suggests the existence of stronger Lamb waves and greater HOM contributions at high frequencies.
Figure 3.
Reduced scattering cross sections of Albunex® bubbles with radius (a) 1 μm and (b) 2 μm.
Attenuation
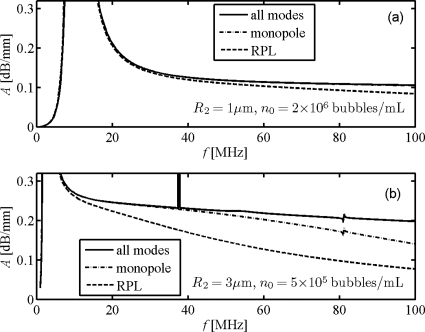
The multiple scattering properties of contrast microbubbles are usually studied through the attenuation and dispersion of sound in suspensions. However, attenuation measurements at HFUS (>10 MHz) are limited. In order to compare our model predictions against prior experimental studies (Goertz et al., 2007a), the Definity® bubbles were simulated as follows: The effective wave numbers in the microbubble suspensions following in the RPL and WST models were calculated by the multiple scattering theories of Foldy (1945) and Waterman and Truell (1961), respectively. Figure 4 is the result for monodispersed Definity® bubbles. We see that the predicted attenuation from WST model is higher than that from the RPL model at frequencies above resonances; this difference becomes more significant as frequency increases, and larger differences were obtained for the larger bubble. Furthermore, the HOM contributions to attenuation in the WST model appear insignificant for smaller bubbles [1 μm in radius, Fig. 4a] but important for larger bubbles [3 μm in radius, Fig. 4b] at high frequencies>40 MHz; anyhow, both are less important than the differences between the attenuation due to isotropic scattering of the two models. Moreover, attenuation peaks similar to those seen in Fig. 3b appear at higher frequencies.
Figure 4.
Attenuation coefficients A in Definity® microbubble suspensions. The bubbles are identical in radii of (a) 1 μm and (b) 3 μm. The bubble concentrations are (a) 2×10⁶ and (b) 5×10⁵ bubbles∕ml.
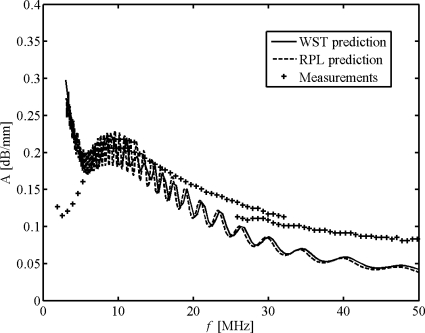
Figure 4 refers to monodispersed bubbles; however, in practice such sharp resonance peaks likely do not exist since the microbubbles have a broad size distribution ranging from <1 μm to 10 μm. Goertz et al. (2007a) measured the attenuation of polydisperse solutions of Definity® bubbles over a broad frequency range (2–50 MHz); these results are compared with corresponding attenuation values computed from our WST and RPL models and shown in Fig. 5. We specifically compare our simulations to results from their first vial of “native” bubbles (decantation time is 30 s), of which the size distribution and attenuation are given in their Figs. 5a, 4a, respectively. This vial is selected because it contains a greater fraction of larger bubbles than other vials (with longer decantation times or after filters), and so the HOM contributions from bubble scattering, if present, should be most apparent. Some observations and conclusions can be reached: First, the model predictions agree fairly well at frequencies <50 MHz, but the HOM contribution is negligible at this broad frequency range, in contrast to what is seen in monodisperse simulations; second, the models offer good prediction near resonance at around 10 MHz but model-measurement agreement degrades at frequencies <7 and >20 MHz. The predicted attenuation peak at low frequencies (<7 MHz), which should correspond to the large bubbles of radii 6–7 μm, has shifted greatly to a lower frequency range (<3 MHz) in the measured results. Measured attenuation is also far more than predicted at frequencies >20 MHz. These disagreements reveal the failure of both prediction methods and will be discussed in next section.
Figure 5.
Attenuation coefficients A from models and measurements;
Primary acoustic radiation force
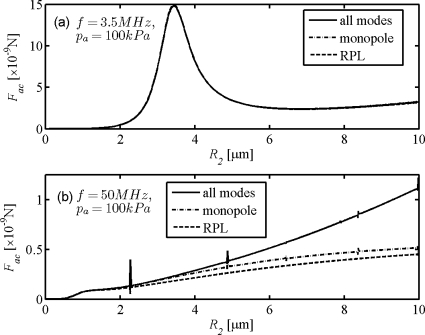
Accurately predicting the acoustic radiation force on the microbubble subject to the HFUS field is another concern introduced by the WST model. The primary radiation forces on the encapsulated microbubbles are calculated by means of Eq. (12) of Dayton et al. (1997) and Eqs. (23), (24), and (28) of Hasegawa et al. (1993) for RPL and WST models, respectively. The acoustic radiation forces as a function of bubble radius are shown for the cases of both low frequency (3.5 MHz) and high frequency (50 MHz) in Figs. 6a, 6b. The two models predict approximately identical profiles of acoustic radiation force at 3.5 MHz but predict remarkable differences for bubbles larger than 2 μm in radius at 50 MHz. The differences increase with the bubble radius as well. Resonant peaks are also shown in the WST result in Fig. 6b and may correspond to natural frequencies of vibrational modes. Unlike the conclusions from Fig. 4, the difference in the results of acoustic radiation forces between monopole and multi-modal scattering is much larger than that between monopole scattering and RPL scattering.
Figure 6.
Primary acoustic radiation forces on the Albunex® bubble in water as a function of radius under a driving ultrasound pulse wave with peak negative pressure pa=100 kPa and central frequencies of (a) f=3.5 MHz and (b) f=50 MHz.
DISCUSSION
Our simulation results highlight four novel points regarding the acoustic response of contrast microbubbles at high frequencies as follows. (1) The HOM contribution is not negligible at high frequencies. (2) The results of isotropic scattering from both models are also different at high frequencies. (3) Both models cannot well-predict attenuation in suspensions with dispersed Definity bubbles. (4) These differences are exhibited in multiple acoustic scattering properties of microbubbles including not only scattering cross sections and attenuation but also acoustic radiation forces, which are key parameters of various currently available contrast techniques. The results may lead to deeper understanding of the microbubble dynamics, as well as optical usage and potential applications of contrast microbubbles at HFUS.
It is seen in Fig. 3 that monopole scattering from WST model and scattering from current RPL model are slightly different from each other. This difference is more evident in Figs. 46b and may be due to the following two reasons. First, the effect of liquid compressibility is ignored in Eq. 8 but is included in WST model, which, based on prior work (Church, 1995; Hoff, 2001), should lead to considerable errors at high frequencies. Second, in the RPL model, it is assumed that the air pressure stays uniform, but the WST model takes the gas inertial effects into consideration. At high frequencies, the time period is so short that the internal energy in the air may become spatially nonuniform during the oscillation. As a result of these issues, we believe the WST model may be more reasonable to predict microbubble responses to HFUS field.
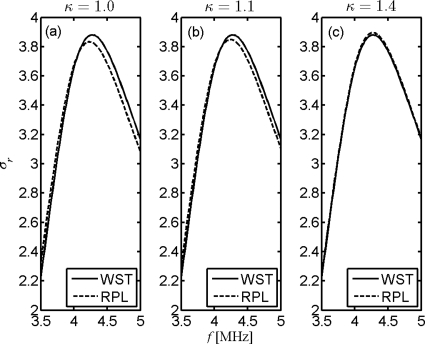
The gas inertial effects can be further discussed by the modeling of thermal behavior within the microbubble. It has been previously reported that the selection of polytropic exponent κ depends on the encapsulation properties and was given by complex expressions (Hoff, 2001). Selected value for κ in RPL models varies from 1.0 to γ, representing isothermal to adiabatic behavior of gas (Sarkar et al., 2005; Goertz et al., 2007a). An empirical value of 1.1 is also found to best match numerical and analytical solutions for the case of Nycomed and Albunex® microbubbles within conventional frequency range (Khismatullin, 2004). The modeling of heat conduction through the Albunex® bubble wall in WST is investigated by the comparisons in Fig. 7. It is seen from Figs. 7a, 7b that the resonance slightly shifts when the WST plot is compared to both isothermal and empirical RPL plots; in Fig. 7c, the WST result best matches for an adiabatic RPL model. It has been demonstrated that whether the compression process is isothermal or adiabatic for free bubble oscillation depends on the ratio of thermal diffusion length to bubble radius defined by the parameter (Prosperetti et al., 1988). The large and small values of χ indicate nearly isothermal and adiabatical behavior of gas, respectively. Obviously, the value of χ also has a reciprocal relation to the driving frequency. In other words, the value of χ will be much smaller and thus represents the adiabatic behavior of gas at high frequencies. The WST is shown here to display adiabatic gas behavior and may thus be a good model for encapsulated microbubbles subject to high frequencies.
Figure 7.
Reduced scattering cross sections of single Albunex® bubble as a function of driving frequency. The polytropic exponents are (a) 1.0 (left), (b) 1.1 (center), and (c) 1.4 (right).
The failure of both models in predicting the attenuation of Definity® suspensions at higher frequencies in Fig. 5 excludes the HOM contribution, liquid compressibility, and gas inertial effects. Alternative explanations here may link to the material properties of lipid shells, which are different from those of polymer and albumin encapsulation (Sarkar et al., 2005; Doinikov and Dayton, 2007). Disagreement above 20 MHz could also be attributed to nonlinear shell response due to shear-thinning and strain-softening material properties (Tsiglifis and Pelekasis, 2008; Doinikov et al., 2009). However, it is necessary to state that the importance of HOM scattering should be reexamined for other types of contrast agents, especially those with a greater number percentage of large bubbles or encapsulated by thick, hard shells, or driven at even higher frequencies >100 MHz. One good example is Imagent® bubbles, which have a mean size of 6.0 μm. Moreover, from the shift of the measured attenuation peak at frequencies <7 MHz, we believe that further investigation is warranted to examine problems such as theoretical modeling of lipid shells and experimental design of acoustic measurements.
The significance of the HOM contribution to the primary acoustic radiation forces on the microbubble subject to the HFUS has been exhibited in Fig. 6b for larger bubbles. As is known, the second scattering mode (m=1) has a dipole pattern in scattering directivity and results in a unidirectional radiation force that enables the detection of bubble translational motion. It is thus indicated that bubble manipulation by ultrasound will be violently impacted by the anisotropic scattering for high-frequency targeted contrast applications such as drug delivery and molecular imaging. It is also no doubt that the frequencies applied in upcoming microbubble-assisted ultrasound techniques will get higher, and thus it will lead to considerable HOM contributions for even smaller microbubbles.
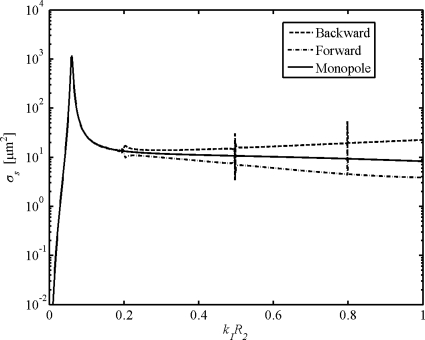
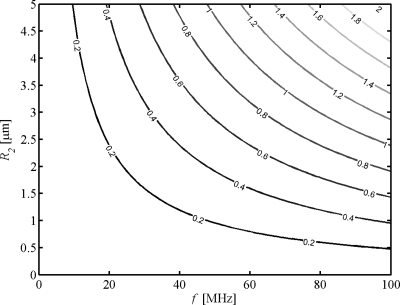
Microbubble usage in HFUS imaging may also be optimized by means of WST model. As introduced above, the monopole scattering is dominant only if the normalized frequency k1R2⪡1, indicating that such scattering is on par with the scattering from radial pulsation predicted by the RPL model for contrast microbubbles at frequencies <10 MHz. However, this condition is partially violated for contrast microbubbles at higher frequencies, and in such intermediate wavelength regimes the HOM contribution becomes significant. Figure 8 shows the scattering cross sections for various terms as a function of normalized frequency for Nycomed bubbles, which has a fixed value of 5% for thickness-to-radius ratio (Hoff, 2001). It is seen that the differences due to the HOM start at k1R2=0.2. Further calculations lead to a range of start points of k1R2 from 0.1 to 0.4 for other types of shells. This result is instructive for optimized usage of contrast bubbles in HFUS applications. A contour plot of k1R2 is given in Fig. 9. Given a certain frequency, one may use the plot to find the corresponding threshold of bubble radius below which the HOM contribution is negligible. For example, the HOM contribution to scattering in bubbles with radius <1 μm is negligible at 50 MHz if the start point k1R2=0.2 (Nycomed bubbles). This indicates that the WST analyses instead of the RPL method should be applied for predictions on single scattering of bubbles >1 μm in radius and multiple scattering for suspensions of which a great portion of the bubbles >1 μm in radius.
Figure 8.
Scattering cross sections of single Nycomed bubble as a function of normalized frequency.
Figure 9.
Contour plot of normalized frequency.
Shell Lamb waves are essential signals of the contrast microbubble. Simulation results have shown that optimized design of material properties and geometry of the shell can maximize the response of the Lamb wave for a specific frequency (Allen et al., 2001). This may make possible novel HFUS contrast techniques in ophthalmology, dermatology and oncology and so on, based on detection of shell Lamb waves within the total scattering spectrum of microbubbles seeded in complex structures of microcirculation. In underwater acoustics, the modal verification and peak detection are realized by the partial wave decomposition of the scattering form function in the analyses of resonance scattering theory (Gaunaurd and Werby, 1991). This approach may be useful for detection of Lamb waves for encapsulated microbubbles and is a topic of ongoing study.
The WST model holds both advantages and disadvantages against various RPL models in modeling of encapsulated microbubble dynamics at high frequencies. Besides the HOM contribution, it has also been shown previously that liquid compressibility is no longer negligible for Mach numbers comparable to unity (Hoff, 2001). For time-harmonic scattering, the radial velocity of the bubble shell outer interface is , and thus the Mach number of the fluid is M=2πfR2∕c0=k1R2. Developed RPL models, such as the Triling or Keller–Miksis equations, are restricted by M<1, but WST method works for any k1R2. In addition, studies on the microbubble responses at high frequencies can be extended to more practical linear WST models. For example, a viscous-liquid WST model can be used to evaluate bubbles in blood. However, the nonlinear oscillation of microbubbles has never been incorporated in WST models and is under further investigation. To date, the RPL models continue to be used for the evaluation of nonlinear effects.
ACKNOWLEDGMENTS
This work is supported by grants from NIH (Grant Nos. T32-HL072738, SCCOR-HL081506, and K24-HL084923) and NSF (Grant No. CTS 0421461). Jiusheng Chen would like to thank Professor Thomas L. Geers for useful discussion on WST.
NOMENCLATURE
- R1
Inner radius of the shell
- R2
Outer radius of the shell
- d
Shell thickness
- θ
Scattering angle
- Φi
Potential of the incident waves
- Φs
Potential of the scattering waves
- Φa
Wave potential in the air
- Φ2
Scalar potential in the shell
- Ψ2
Vector potential in the shell
- μs
Shear viscosity of the shell material
- Gs
Shear modulus of the shell material
- λe
Elastic Lamé’s first parameter
- λv
Viscous Lamé’s first parameter
- k1
Wave number in water
- ks
Wave number of the shear waves in the shell
- kd
Wave number of the longitudinal waves in the shell
- k3
Wave number in the air
- Pn(⋅)
Legendre polynomial of order n
- jn(⋅)
Spherical Bessel function of order n
- nn(⋅)
Spherical Neumann function of order n
Spherical Hankel function of the first kind of order n
- an
Scattering coefficient
- ur
Normal displacement
- τrr
Normal stress
- τrθ
Tangential stress
- αij
Elements of the scattering matrix (i,j=1–6)
- f(θ)
Scattering function in the far field
- fn(θ)
Scattering function of mode n
- f0
Monopole scattering function
- f(0)
Forward scattering function
- f(π)
Backward scattering function
- σs
Scattering cross section
- σr
Reduced scattering cross section
σr calculated by truncation of first (m+1) modes
- ρs
Density of the shell material
- ρl
Density of water
- βr
Damping due to acoustic radiation
- βsh
Damping due to shell viscosity
- β
βr+βth, total damping
- pa
Acoustic pressure amplitude
- p0
Hydrostatic pressure in the surrounding liquid
- R10
Inner radius of the shell at t=0
- R20
Outer radius of the shell at t=0
- f
Driving frequency
- ω
2πf, angular driving frequency
- ω0
Resonant angular frequency
- c0
Sound speed in water
- κ
Polytropic exponent
- γ
Ratio of specific heats
- A
Sound attenuation coefficient
- Fac
Primary acoustic radiation force
- D0
Gas thermal diffusivity
References
- Allen, J. S., Kruse, D. E., and Ferrara, K. W. (2001). “Shell waves and acoustic scattering from ultrasound contrast agents,” IEEE Trans. Ultrason. Ferroelectr. Freq. Control 48, 409–418. 10.1109/58.911723 [DOI] [PubMed] [Google Scholar]
- Ayres, V. M., and Gaunaurd, G. C. (1987). “Acoustic-resonance scattering by viscoelastic objects,” J. Acoust. Soc. Am. 81, 301–311. 10.1121/1.394950 [DOI] [Google Scholar]
- Ayres, V. M., Gaunaurd, G. C., Tsui, C. Y., and Werby, M. F. (1987). “The effects of lamb waves on the sonar cross-sections of elastic spherical-shells,” Int. J. Solids Struct. 23, 937–946. 10.1016/0020-7683(87)90088-6 [DOI] [Google Scholar]
- Chen, J. S., and Zhu, Z. M. (2005). “Sound scattering characteristics of bubbles with viscoelastic shells,” Acta Acust. 30, 385–392. [Google Scholar]
- Cheung, K., Couture, O., Bevan, P. D., Cherin, E., Williams, R., Burns, P. N., and Foster, F. S. (2008). “In vitro characterization of the subharmonic ultrasound signal from Definity microbubbles at high frequencies,” Phys. Med. Biol. 53, 1209–1223. 10.1088/0031-9155/53/5/004 [DOI] [PubMed] [Google Scholar]
- Church, C. C. (1995). “The effects of an elastic solid-surface layer on the radial pulsations of gas-bubbles,” J. Acoust. Soc. Am. 97, 1510–1521. 10.1121/1.412091 [DOI] [Google Scholar]
- Coussios, C. C., Holland, C. K., Jakubowska, L., Huang, S. L., MacDonald, R. C., Nagaraj, A., and McPherson, D. D. (2004). “In vitro characterization of liposomes and Optison® by acoustic scattering at 3.5 MHz,” Ultrasound Med. Biol. 30, 181–190. 10.1016/j.ultrasmedbio.2003.10.015 [DOI] [PMC free article] [PubMed] [Google Scholar]
- Dayton, P. A., Morgan, K. E., Klibanov, A. L. S., Brandenburger, G., Nightingale, K. R., and Ferrara, K. W. (1997). “A preliminary evaluation of the effects of primary and secondary radiation forces on acoustic contrast agents,” IEEE Trans. Ultrason. Ferroelectr. Freq. Control 44, 1264–1277. 10.1109/58.656630 [DOI] [Google Scholar]
- de Jong, N., Cornet, R., and Lancée, C. T. (1994). “Higher harmonics of vibrating gas-filled microspheres. 1. Simulations,” Ultrasonics 32, 447–453. 10.1016/0041-624X(94)90064-7 [DOI] [Google Scholar]
- Doinikov, A. A., and Dayton, P. A. (2007). “Maxwell rheological model for lipid-shelled ultrasound microbubble contrast agents,” J. Acoust. Soc. Am. 121, 3331–3340. 10.1121/1.2722233 [DOI] [PMC free article] [PubMed] [Google Scholar]
- Doinikov, A. A., Haac, J. F., and Dayton, P. A. (2009). “Modeling of nonlinear viscous stress in encapsulating shells of lipid-coated contrast agent microbubbles,” Ultrasonics 49, 269–275. 10.1016/j.ultras.2008.09.007 [DOI] [PMC free article] [PubMed] [Google Scholar]
- Foldy, L. L. (1945). “The multiple scattering of waves. 1. General theory of isotropic scattering by randomly distributed scatterers,” Phys. Rev. 67, 107–119. 10.1103/PhysRev.67.107 [DOI] [Google Scholar]
- Frinking, P. J. A., and de Jong, N. (1998). “Acoustic modeling of shell-encapsulated gas bubbles,” Ultrasound Med. Biol. 24, 523–533. 10.1016/S0301-5629(98)00009-X [DOI] [PubMed] [Google Scholar]
- Gaunaurd, G. C., and Werby, M. F. (1991). “Sound scattering by resonantly excited, fluid-loaded, elastic spherical-shells,” J. Acoust. Soc. Am. 90, 2536–2550. 10.1121/1.402059 [DOI] [Google Scholar]
- Goertz, D. E., de Jong, N., and van der Steen, A. F. W. (2007a). “Attenuation and size distribution measurements of Definity™ and manipulated Definity™ populations,” Ultrasound Med. Biol. 33, 1376–1388. 10.1016/j.ultrasmedbio.2007.03.009 [DOI] [PubMed] [Google Scholar]
- Goertz, D. E., Frijlink, M. E., de Jong, N., and Steen, A. F. W. V. (2006). “High frequency nonlinear scattering from a micrometer to submicrometer sized lipid encapsulated contrast agent,” Ultrasound Med. Biol. 32, 569–577. 10.1016/j.ultrasmedbio.2006.01.002 [DOI] [PubMed] [Google Scholar]
- Goertz, D. E., Frijlink, M. E., Tempel, D., Bhagwandas, V., Gisolf, A., Krams, R., de Jong, N., and van der Steen, A. F. W. (2007b). “Subharmonic contrast intravascular ultrasound for vasa vasorum imaging,” Ultrasound Med. Biol. 33, 1859–1872. 10.1016/j.ultrasmedbio.2007.05.023 [DOI] [PubMed] [Google Scholar]
- Goessling, W., North, T. E., and Zon, L. I. (2007). “Ultrasound biomicroscopy permits in vivo characterization of zebrafish liver tumors,” Nat. Methods 4, 551–553. 10.1038/nmeth1059 [DOI] [PubMed] [Google Scholar]
- Hasegawa, T., Hino, Y., Annou, A., Noda, H., Kato, M., and Inoue, N. (1993). “Acoustic radiation pressure acting on spherical and cylindrical-shells,” J. Acoust. Soc. Am. 93, 154–161. 10.1121/1.405653 [DOI] [Google Scholar]
- Hasheminejad, S. M., and Safari, N. (2005). “Acoustic scattering from viscoelastically coated spheres and cylinders in viscous fluids,” J. Sound Vib. 280, 101–125. 10.1016/j.jsv.2003.12.027 [DOI] [Google Scholar]
- Hoff, L. (2001). Acoustic Characterization of Contrast Agents for Medical Ultrasound Imaging (Kluwer Academic, Boston, MA: ). [Google Scholar]
- Hu, Y. T., Qin, S. P., and Jiang, Q. (2004). “Characteristics of acoustic scattering front a double-layered micro shell for encapsulated drug delivery,” IEEE Trans. Ultrason. Ferroelectr. Freq. Control 51, 808–820. 10.1109/TUFFC.2004.1350946 [DOI] [PubMed] [Google Scholar]
- James, M. A., Tullett, J., Hemsley, A. G., and Shore, A. C. (2006). “Effects of aging and hypertension on the microcirculation,” Hypertension 47, 968–974. 10.1161/10.1161/01.HYP.0000209939.05482.61 [DOI] [PubMed] [Google Scholar]
- Keller, J. B., and Miksis, M. (1980). “Bubble oscillations of large-amplitude,” J. Acoust. Soc. Am. 68, 628–633. 10.1121/1.384720 [DOI] [Google Scholar]
- Khismatullin, D. B. (2004). “Resonance frequency of microbubbles: Effect of viscosity,” J. Acoust. Soc. Am. 116, 1463–1473. 10.1121/1.1778835 [DOI] [PubMed] [Google Scholar]
- Lanza, G. M., Wallace, K. D., Fischer, S. E., Christy, D. H., Scott, M. J., Trousil, R. L., Cacheris, W. P., Miller, J. G., Gaffney, P. J., and Wickline, S. A. (1997). “High-frequency ultrasonic detection of thrombi with a targeted contrast system,” Ultrasound Med. Biol. 23, 863–870. 10.1016/S0301-5629(97)00046-X [DOI] [PubMed] [Google Scholar]
- McClements, D. J. (1996). “Principles of ultrasonic droplet size determination in emulsions,” Langmuir 12, 3454–3461. 10.1021/la960083q [DOI] [Google Scholar]
- Mitri, F. G., and Fellah, Z. E. A. (2006). “Amplitude-modulated acoustic radiation force experienced by elastic and viscoelastic spherical shells in progressive waves,” Ultrasonics 44, 287–296. 10.1016/j.ultras.2006.03.001 [DOI] [PubMed] [Google Scholar]
- Moran, C. M., Watson, R. J., Fox, K. A. A., and McDicken, W. N. (2002). “In vitro acoustic characterisation of four intravenous ultrasonic contrast agents at 30 MHz,” Ultrasound Med. Biol. 28, 785–791. 10.1016/S0301-5629(02)00520-3 [DOI] [PubMed] [Google Scholar]
- Needles, A., Goertz, D. E., Karshafian, R., Cherin, E., Brown, A. S., Burns, P. N., and Foster, F. S. (2008). “High-frequency subharmonic pulsed-wave Doppler and color flow imaging of microbubble contrast agents,” Ultrasound Med. Biol. 34, 1139–1151. 10.1016/j.ultrasmedbio.2007.12.011 [DOI] [PubMed] [Google Scholar]
- Prosperetti, A., Crum, L. A., and Commander, K. W. (1988). “Nonlinear bubble dynamics,” J. Acoust. Soc. Am. 83, 502–514. 10.1121/1.396145 [DOI] [Google Scholar]
- Rychak, J. J., Graba, J., Cheung, A. M. Y., Mystry, B. S., Lindner, J. R., Kerbel, R. S., and Foster, F. S. (2007). “Microultrasound molecular imaging of vascular endothelial growth factor receptor 2 in a mouse model of tumor angiogenesis,” Mol. Imaging 6, 289–296. [PubMed] [Google Scholar]
- Sarkar, K., Shi, W. T., Chatterjee, D., and Forsberg, F. (2005). “Characterization of ultrasound contrast microbubbles using in vitro experiments and viscous and viscoelastic interface models for encapsulation,” J. Acoust. Soc. Am. 118, 539–550. 10.1121/1.1923367 [DOI] [PubMed] [Google Scholar]
- Trilling, L. (1952). “The collapse and rebound of a gas bubble,” J. Appl. Phys. 23, 14–17. 10.1063/1.1701962 [DOI] [Google Scholar]
- Tsiglifis, K., and Pelekasis, N. A. (2008). “Nonlinear radial oscillations of encapsulated microbubbles subject to ultrasound: The effect of membrane constitutive law,” J. Acoust. Soc. Am. 123, 4059–4070. 10.1121/1.2909553 [DOI] [PubMed] [Google Scholar]
- Waterman, P. C., and Truell, R. (1961). “Multiple scattering of waves,” J. Math. Phys. 2, 512–517. 10.1063/1.1703737 [DOI] [Google Scholar]
- Ye, Z. (1996). “On sound scattering and attenuation of Albunex® bubbles,” J. Acoust. Soc. Am. 100, 2011–2028. 10.1121/1.417911 [DOI] [Google Scholar]
- Yeh, C. K., Lu, S. Y., and Chen, Y. S. (2008). “Microcirculation volumetric flow assessment using high-resolution, contrast-assisted images,” IEEE Trans. Ultrason. Ferroelectr. Freq. Control 55, 74–83. 10.1109/TUFFC.2008.618 [DOI] [PubMed] [Google Scholar]


