

Abstract
Voxel‐based morphometry (VBM) has detected differences between brains of groups of patients with epilepsy and controls, but the sensitivity for detecting subtle pathological changes in single subjects has not been established. The aim of the study was to test the sensitivity of VBM using statistical parametric mapping (SPM5) to detect hippocampal sclerosis (HS) and cortical neuronal loss in individual patients. T1‐weighted volumetric 1.5 T MR images from 13 patients with HS and laminar cortical neuronal loss were segmented, normalised and smoothed using SPM5. Both modulated and non‐modulated analyses were performed. Comparisons of one control subject against the rest (n = 23) were first performed to ascertain the smoothing level with the lowest number of SPM changes in controls. Each patient was then compared against the whole control group. The lowest number of SPM changes in control subjects was found at a smoothing level of 10 mm full width half maximum for modulated and non‐modulated data. In the patient group, no SPM abnormalities were found in the affected temporal lobe or hippocampus at this smoothing level. At lower smoothing levels there were numerous SPM findings in controls and patients. VBM did not detect any abnormalities associated with either laminar cortical neuronal loss or HS. This may be due to normalisation and smoothing of images and low statistical power in areas with larger inter‐individual differences. This suggests that the methodology may currently not be suitable to detect particular occult abnormalities possibly associated with seizure onset zone in individual epilepsy patients with unremarkable standard structural MRI. Hum Brain Mapp, 2009. © 2009 Wiley‐Liss, Inc.
Keywords: voxel‐based morphometry, hippocampal sclerosis, neuronal loss, gliosis, epilepsy, SPM
INTRODUCTION
Voxel‐based morphometry (VBM) is a whole‐brain semi‐automated technique for characterising structural brain differences in vivo [Ashburner and Friston, 2000]. VBM and statistical parametric mapping (SPM) of segmented grey matter images have been useful in identifying subtle group differences in brain structure in a variety of diseases associated with neurological and psychiatric dysfunction and the technique has frequently been used to study patients with epilepsy [Bernasconi et al., 2004; Betting et al., 2006; Bonilha et al., 2006; Colliot et al., 2006; Keller et al., 2002, 2004; Mueller et al., 2006; Woermann et al., 1999a, b]. However, the underlying pathological bases of the identified abnormalities remain unknown and the sensitivity for detecting subtle pathological changes, particularly in single subjects, is unclear.
Hippocampal sclerosis (HS) is the most common cause of refractory temporal lobe epilepsy. Histopathologically, HS is characterised by neuronal loss and gliosis. The neuron loss in classical HS is greatest in CA1 and the hilar region (including CA4) with accompanying gliosis [Bruton, 1988]. HS can readily be identified on MRI. The cardinal signs of HS on MRI are increased hippocampal signal on T2‐weighted images and hippocampal volume loss most evident on T1‐weighted images [Jackson et al., 1990]. Previous VBM group analyses of patients with HS have detected reduced grey matter in the ipsilateral hippocampus as well as more widespread changes often involving both hemispheres [Bernasconi et al., 2004; Cormack et al., 2005; Keller et al., 2002, 2004]. HS has, however, not been detected in individual patients using a previous version of SPM [Woermann et al., 1999a].
Hippocampal sclerosis may be associated with temporal lobe neocortical changes such as lack of neurones in layers II–III associated with gliosis [Thom et al., 2000] (see Fig. 1). It has recently been suggested that these changes might represent a type of subtle developmental anomaly (focal cortical dysplasia type Ia) [Garbelli et al., 2006]. It is also possible that the changes could be a result of frequent seizures with secondary neuronal loss and appearance of clusters of adjacent cells in layer II; a similar pattern of neuronal loss has been seen in an animal model of status epilepticus [Roch et al., 2002]. Such subtle changes are not identified in humans on visual inspection of routine MRI, but may be obvious on histopathological sections.
Figure 1.
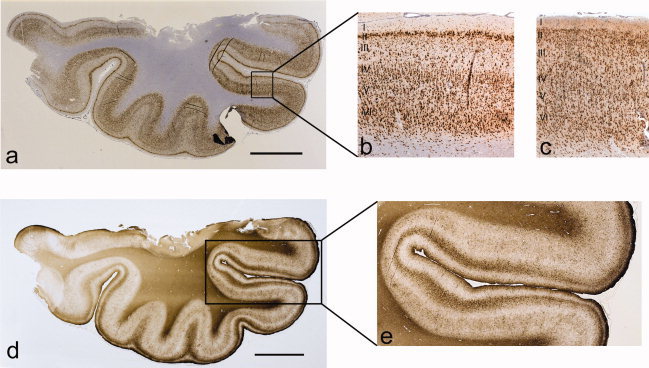
Histopathological section through the temporal lobe approximately 1.5 cm from the tip of the temporal pole stained with NeuN (Patient 2) (a). The cortex displays neuronal loss in layer III and an appearance of clusters of neurons in layer II which is seen more clearly in higher magnification of the cortex in the same patient (b). Normal cortex for comparison (c). Laminar gliosis, corresponding to the cortical areas with neuronal loss, is seen on the GFAP immunostained section in the same case (Patient 2) (d). This is seen more clearly in the higher magnification of the cortex in the same patient (e). This also shows the subpial (Chaslin's) gliosis more clearly. [Color figure can be viewed in the online issue, which is available at www.interscience.wiley.com.]
In the preoperative work‐up of individuals for epilepsy surgery, it is important to detect cerebral abnormalities that might be associated with epilepsy and may be a marker for the seizure onset zone. It is also recognised that up to one third of patients with isolated hippocampal sclerosis do not become seizure free following temporal lobectomy. It is not known why some of these rigorously screened and carefully selected patients continue to have seizures and it is pivotal to improve the diagnosis of cytoarchitectural abnormalities that might influence post‐operative outcome. To increase the sensitivity of the preoperative investigations, it is necessary to improve MRI acquisition as well as post‐processing. The aim of the current study was to test the sensitivity of VBM, using SPM5, by studying individual patients with known HS (that is readily seen on routine MRI) and cortical neuronal loss (not seen on routine MRI) compared with a group of controls, to evaluate the ability of the method to identify subtle abnormalities in vivo, and so contribute to pre‐surgical evaluation.
MATERIALS AND METHODS
The study was approved by the Joint Research Ethics Committee of the National Hospital for Neurology and Neurosurgery and Institute of Neurology, UCL. All participants gave written informed consent. We studied 13 epilepsy surgery patients undergoing anterior temporal lobe resections (ATLR) at the National Hospital for Neurology and Neurosurgery, who had preoperative T1‐weighted volume scans at the National Society for Epilepsy and in whom postoperative histopathological evaluation revealed HS and cortical neuronal loss in layer II‐III of the neocortex. Qualitative histopathology showed varying degrees of neuronal depletion from the deeper part of cortical layer II extending to the upper part of layer III. Remaining neurones in layer II appeared aggregated in clusters or groups, with in some cases an apparent hypercellularity and abnormal orientation of residual layer II neurones. There were no dysmorphic or hypertrophic neurones and no balloon cells. The laminar neuronal depletion was accompanied by an excessive cellular gliosis extending from cortical layer I to III as visualised with GFAP staining (see Fig. 1).
In addition to HS, one of the patients also had a degree of ipsilateral temporal lobe atrophy seen on MRI (Patient 2). In all other patients, MRI showed HS but no other abnormalities. Hippocampal volumes and T2 values were measured in all but two patients (Patients 7 and 11, Table III) [Duncan et al., 1996; Woermann et al., 1998]. Volume ratios between the sclerotic side and the unaffected side ranged between 38% and 76% (abnormal ratio defined as <90%). T2 values on the sclerotic side ranged between 90.1 and 99 ms (abnormal value defined as >90 ms). T2 values on the unaffected side in the 11 cases where measurements were made were normal in 10 cases but increased to 91 ms in 1 case (Patient 8) (for details see Table III).
Table III.
MRI, histopathological and SPM findings in patientsa
| Patient | MRI findings, R/L volume (ratio) R/L, T2 value | Histopathological findingsb | Modulated SPM findings: Smoothing, 4 mm | Modulated SPM findings: Smoothing, 6 mm | Modulated SPM findings: Smoothing, 8 mm | Modulated SPM findings: Smoothing, 10 mm | Non‐modulated SPM findings: Smoothing, 10 mm |
|---|---|---|---|---|---|---|---|
| 1 | L HS, 2.83/2.02 (71.4%), Normal/94.5 | HS and moderate layer II–III neuronal loss mainly anterior | — | — | — | — | — |
| 2 | R HS, possible temp neocortical involvement, 1.2/2.77 (43.3%), 94.2/normal | HS and severelayer II–III neuronal loss in whole lobe | Decrease L cerebellum | Decrease L cerebellum | — | — | Decrease cerebellum bilat |
| 3 | R HS, 1.04/2.77 (38%), 99.1/normal | HS and severe layer II–III neuronal loss in whole lobe | — | Increase R temp and R temp/occ | — | — | Increase R temp and R temp/occ., decrease L front |
| 4 | R HS, 2.16/3.09 (70%), 91.4/normal | HS and mild layer II–III neuronal loss mainly anterior | Increase L temp/occ | Increase L temp/occ | — | — | — |
| 5 | R HS, 2.27/2.98 (76%), 90.1/normal | HS and mild layer II–III neuronal loss mainly posterior | — | Increase R par and L front/par | Increase R par and L front/par | — | — |
| 6 | L HS, 3.3/1.88 (56%), Normal/92.8 | HS and marked layer II–III neuronal loss mainly anterior | — | Increase R temp, R temp/occ, R occ and L temp | — | — | — |
| 7 | R HS, no measurements performed | HS and severe layer II–III neuronal loss mainly anterior | Increase L temp | Increase L par, R front, and L temp | Increase L par | — | — |
| 8 | R HS, 1.82/3.2 (57%), 96.2/91 | HS and mild layer II–III neuronal loss mainly posterior | — | Increase R front/par, R front, and L brainstem | Increases R front and R front/par | — | Increase front/par and L brainstem |
| 9 | L HS, 2.77/1.79 (65%), Normal/93 | HS and severe layer II–III neuronal loss in whole lobe | — | — | — | — | — |
| 10 | L HS, 3.0/1.67 (56%), Normal/90.7 | HS and mild layer II–III neuronal loss anterior | — | — | — | — | — |
| 11 | L HS, No measurements performed | HS and severe layer II–III neuronal loss in whole lobe | — | Increase R and L par | — | — | — |
| 12 | L HS, 2.86/1.41 (49%), Normal/94 | HS and moderate layer II–III neuronal loss in whole lobe | — | — | — | — | — |
| 13 | L HS, 2.8/1.64 (58.5%), Normal/90.5 | HS and layer II–III neuronal loss in whole lobe | — | — | — | — | — |
Hippocampal volumes given are absolute values in cm3, uncorrected. Ratios are calculated small/large, abnormal ratio > 90%. Normal values for corrected hippocampal volumes: >2694 mm3 on the right and >2772 mm3 on the left [Woermann et al., 1998]. T2 values are given in milliseconds, abnormal values >90 ms [Duncan et al., 1996].
Anterior and posterior refers to location within the resected pieces of the temporal lobe.
L, left; R, right; HS, hippocampal sclerosis; temp, temporal; occ, occipital; par, parietal; front, frontal.
The age range of the patients was 24–55 years (median, 36 years) and four were female. Six had a right ATLR, and seven had surgery on the left. Outcome was assessed according to the ILAE criteria [ILAE, 2001] at the latest follow‐up, median 5 years after surgery (range, 2–8 years). For further clinical details, please see Table I. Surgery was performed after our standard presurgical work‐up, including EEG‐video telemetry, conventional MRI (T1‐ and T2‐weighted, proton density and FLAIR), psychological and psychiatric assessments and multi‐disciplinary case conference. The control group constituted of 24 healthy control subjects with no history of any neurological disorders. The age range was 20–51 years (median, 35 years) and there were 15 females.
Table I.
Clinical dataa
| Patient | Gender/side of surgery | Age at onset/duration (years) | Precipitating insult | Seizure frequency | Outcome of surgery |
|---|---|---|---|---|---|
| 1 | M/left | 1.5/32.5 | CFS at 17 months | 1 CPS/month | 1 |
| 2 | F/right | 11/25 | Meningitis at 7 months | 7 CPS/month | 1 |
| 3 | M/right | 11/36 | Repeated FS | 3–4 SPS/day, 2 CPS/month | 1 |
| 4 | M/right | 13/23 | CFS at 18 months | 20 SPS/month, 5 CPS/month | 1 |
| 5 | M/right | 9/20 | Traumatic brain injury, brief LOC at 8 years | 4 CPS/month, 1 SGTCS/month | 3 |
| 6 | M/left | 1.5/35 | FS at 8 months, CFS at 18 months | 10–15 CPS/month | 1 |
| 7 | M/right | 11/16 | Meningitis at 6 months | 8 CPS/month, 2–4 SGTCS/year | 2 |
| 8 | M/right | 5/32 | CFS at 9 months, FS at 13 and 14 months | 4–6 CPS/month | 1 |
| 9 | F/left | 22/11 | FS | 10 CPS/month | 1 |
| 10 | M/left | 2/36 | Encephalitis at 18 months | 3 CPS/month | 4 |
| 11 | M/left | 0.75/23 | 2 FS at 9 months | 5–6 CPS/month | 1 |
| 12 | M/left | 13/42 | 2 FS at 9 months | 3–6 CPS/month | 1 |
| 13 | F/left | 6/33 | CFS at 9 months | 4 CPS/month | 1 |
Numbers indicate outcome group according to the ILAE criteria [ILAE, 2001]. 1, no seizures; 2, auras only; 3, seizures on less than 4 days a year; 4, seizures reduced by more than 50%. Outcome > 2 years after surgery.
M, male; F, female; CFS, complex febrile seizure; FS, febrile seizure; LOC, loss of consciousness; CPS, complex partial seizure; SPS, simple partial seizure; SGTCS, secondary generalised tonic clonic seizure.
MR Acquisition
All scans were acquired on the same 1.5T GE Signa MR scanner (GE Medical Systems, Milwaukee, WI) using the standard circularly polarised quadrature birdcage coil. The parameters for T1‐weighted volume sequence were: TE/TR/TI/NEX, 4.2/15/450/1; flip angle 20 degrees; acquisition matrix 256 × 192; field of view 24 × 18 cm; 3/4 phase FOV, 124 contiguous 1.5 mm slices, giving a voxel size of 0.94 × 1.25 × 1.5 mm. All patients also had T2‐weighted and proton density (TE1/TE2/TR 30/80/2000 FOV 24 × 18 cm, acquisition matrix 256 × 192, slice thickness 5.0 mm, giving a voxel size of 0.94 × 0.94 × 5.0 mm) and FLAIR images (TE/TR/TI 144/11000/2250, FOV 24 × 24 cm, acquisition matrix 256 × 224, slice thickness 5.0 mm, giving a voxel size of 0.94 × 1.1 × 5.0 mm). Scans were acquired coronally.
VBM Procedures
The T1‐weighted volume scans were reformatted to axial orientation and into cubic voxels (0.94 mm3) before SPM analyses.
Modulated Images
For the comparisons of “modulated” images, the reformatted images were then segmented and normalised using the unified segmentation of SPM5 (FIL, Wellcome Trust Centre for Neuroimaging, London, UK). The grey matter segmentations were modulated with the Jacobian fields to preserve the individual grey matter amount (“preserve amount” option in SPM5). Voxel size option was set to 1 × 1 × 1 (instead of the default 2 × 2 × 2) mm to retain maximum image information.
The segmented grey matter class images were smoothed using an isotropic Gaussian kernel to improve signal to noise ratio, to allow the images to conform more closely to a Gaussian field model and to increase the validity of statistical inference. Smoothing levels from 4 to 10 mm full‐width half‐maximum (FWHM) were used. A standard univariate t‐test was applied using SPM5 to every voxel in the image in order to create a map from which statistical inference was drawn. Significant increases or decreases in MR contrast signal intensity were detected at an individual voxel threshold of P < 0.001. The theory of Gaussian fields was used to calculate a corrected multiple comparison P value of 0.05. The cluster extent threshold was set to five voxels. Each control was first compared against the rest of the control group to ascertain the smoothing level with adequate specificity (i.e. few changes detected in control subjects). At a statistical threshold of P < 0.05 and 48 examinations (24 control subjects with two contrasts each, increase and decrease) up to 2.4 abnormalities may be expected by chance across the group. The smoothing levels were then applied to the patients and we tested for regional differences between each patient and the control group.
Uncorrected Comparisons: Modulated Images
To further assess the sensitivity of the procedures, uncorrected comparisons between each patient and the control group were performed on the modulated data smoothed using 10 mm FWHM.
Non‐Modulated Images
We also applied what has been described by Wilke et al. [ 2003] as the most sensitive approach to identify focal cortical dysplasia (FCD); affine registration, non‐linear warping using discrete cosine transform with a non‐linear cut off of 25 mm, 16 non‐linear iterations and default (medium) regularisation, “non‐modulated” images. Following this, the procedures were the same as for the modulated images. Smoothing levels of 6 and 10 mm FWHM were used.
No group analyses were performed since the localisation, extent and severity of the neocortical changes varied and the aim of the study was to investigate sensitivity for individual patients.
RESULTS
Modulated Images: Control Subjects
At a smoothing level of 10 mm FWHM, SPM5 detected an area of increased grey matter in one of 24 controls. At lower smoothing levels SPM5 detected increases in grey matter in eight subjects (33%) at smoothing of 8 mm FWHM, 16 subjects (66%) at smoothing of 6 mm FWHM and four subjects (17%) at a smoothing level of 4 mm FWHM (Figs. 2 and 3). Details are listed in Table II. There were no decreases in grey matter for control subjects at any smoothing level used. Since we would expect an area of reduced grey matter associated with the histopathological changes seen in our patients, all smoothing levels were also applied to the patients.
Figure 2.
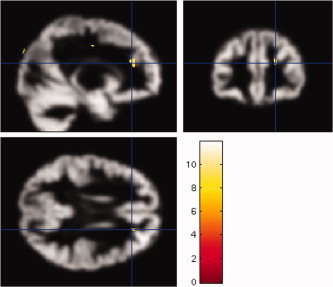
Example of abnormalities detected by SPM5 in a control subject. Sagittal, coronal (top row) and axial (bottom row) views of segmented grey matter images (smoothing level 6 mm FWHM) for control subject 19. Areas with increases in grey matter detected by SPM5 in the right fronto‐polar and fronto‐parietal regions are superimposed. [Color figure can be viewed in the online issue, which is available at www.interscience.wiley.com.]
Figure 3.

Graph showing the number of SPM5 detected abnormalities in patients and control subjects for each smoothing levels used, modulated images.
Table II.
SPM findings in control subjects
| Control subject | Modulated SPM findings: Smoothing, 4 mm | Modulated SPM findings: Smoothing, 6 mm | Modulated SPM findings: Smoothing, 8 mm | Modulated SPM findings: Smoothing, 10 mm | Non‐modulated SPM findings: Smoothing, 6 mm | Non‐modulated SPM findings: Smoothing, 10 mm |
|---|---|---|---|---|---|---|
| 1 | — | Increase L occ, L par, L front/par and R front | Increase L front and front/par | — | — | — |
| 2 | — | — | — | — | — | — |
| 3 | — | Increase L front, L front/par and L occ | — | — | Increase L occ. Decrease L temp | Increase L occ |
| 4 | — | — | — | — | — | — |
| 5 | — | Increase R front and L front/par | — | — | — | — |
| 6 | — | Increase R occ | — | — | Increase L temp | — |
| 7 | — | Increase L occ, R occ and front/par | Increase R occ/par | — | — | — |
| 8 | Increase L temp | — | — | — | Increase L temp | — |
| 9 | — | — | — | — | — | — |
| 10 | — | Increase L front, occ and R front and occ | Increase L front and par | Increase L front | Increase R front | Increase L occ/par |
| 11 | — | — | — | — | — | — |
| 12 | — | — | — | — | — | — |
| 13 | — | — | — | — | Decrease R cerebellum, L and R front | Decrease R cerebellum |
| 14 | Increase brain stem | Increase L occ, R par and par/occ | Increase R par | — | Increase R front/par | Increase R front/par |
| 15 | — | — | — | — | — | — |
| 16 | — | Increase R front/par | — | — | — | — |
| 17 | — | Increase L par/occ | — | — | — | — |
| 18 | — | Increase L front and front/par | Increase L front | — | — | — |
| 19 | Increase midline par | Increase R front‐polar and front/par | Increase R front | — | Decrease L temp | — |
| 20 | — | Increase L front, front/par and R front | Increase L and R front | — | Increase L front/par | — |
| 21 | — | Increase L front, R par | Increase R par | — | — | Increase R front |
| 22 | Increase brain stem | Increase L front and front/par | — | — | Increase brainstem. Decrease cerebellum | Increase brainstem. Decrease cerebellum |
| 23 | — | Increase L and R front/temp | — | — | — | — |
| 24 | — | Increase R front | — | — | Decrease cerebellum | — |
L, left; R, right; temp, temporal; occ, occipital; par, parietal; front, frontal.
Modulated Imaged: Patients
At a smoothing level of 10 mm FWHM, the smoothing level with highest specificity identified by comparing one control against the rest, there were no SPM5 abnormalities in any of the patients. With reduced smoothing levels, SPM5 detected increases in grey matter in three patients (23%) at smoothing of 8 mm FWHM, seven patients (53%) at smoothing of 6 mm FWHM and two patients (15%) at smoothing of 4 mm FWHM. One of the areas with grey matter increase seen at a smoothing of 6 mm FWHM was in the temporal lobe that was resected but posterior to the resection (Patient 3). None of the other abnormalities were in areas related to the seizure focus (defined as the temporal lobe and hippocampus resected during surgery). There was only one patient with an SPM5‐detected area of decrease in grey matter and this appeared in the cerebellum at smoothing levels of 4 and 6 mm FWHM (Patient 2). There were no SPM abnormalities in the hippocampus in any patient at any smoothing level. Details are given in Table III.
Uncorrected Comparisons: Modulated Images
The uncorrected comparisons using a smoothing level of 10 mm FWHM detected scattered increases in grey matter in 6 of the 13 patients (46%). None of the changes were in the hippocampus or affected temporal lobe. There were no decreases.
Non‐Modulated: Control Subjects
At a smoothing level of 6 mm FWHM, SPM5 detected increases in grey matter in seven (29%) and decreases in five (21%) of 24 control subjects. At a smoothing level of 10 mm FWHM there were five control subjects (21%) with increases in grey matter and a decrease was seen in two control subject (8%). Since a smoothing level of 6 mm FWHM gave several (i.e. >2.4 that could have been expected by chance) decreases in control subjects, only a smoothing of 10 mm FWHM was applied to patients.
Non‐Modulated: Patients
At a smoothing of 10 mm FWHM there were two patients with increases and two patients (15%) with decreases in grey matter compared to the control group. In one patient (Patient 3) the increase was in the affected temporal lobe, but was more extensive than the abnormality seen using the modulated images and extended to the posterior part of the temporal lobe resection. However, there were frequent increases in control subjects at these settings and the significance of the increase seen is questionable. None of the other abnormalities detected were in the affected temporal lobe or hippocampus, the decreases were left fronto‐polar (Patient 3) and in the cerebellum (Patient 2). Details are given in Table III.
DISCUSSION
VBM has been used in several studies of patients with temporal lobe epilepsy. Most studies have found group differences in grey matter between patients and control subjects [Bernasconi et al., 2004; Cormack et al., 2005; Keller et al., 2002, 2004; Mueller et al., 2006]. Analyses of individual patients, however, are needed for such analyses to be clinically useful. In the current study, we investigated individual patients with HS and a known subtle neocortical abnormality. However, no SPM abnormalities were found in the affected temporal lobe or hippocampus in individual patients using analyses with sufficient specificity.
The sensitivity of VBM of T1‐weighted volume scans in detecting cerebral abnormalities associated with epilepsy in individual patients has not been established. Previous studies of individual patients with focal cortical dysplasia (FCD) using voxel‐based analyses, have demonstrated that every visually identified lesion, or the full extent of these lesions, are often not detected using VBM even though abnormalities remote from the visually identified lesions are commonly shown [Bonilha et al., 2006; Colliot et al., 2006]. Not finding every FCD lesion or the full extent of lesions might partly be due to MRI signal increases associated with FCD, but might also be due to normalisation issues. Normalisation of data is necessary for comparisons between individuals. Normalising data can, however, reduce differences between individual patients by making them conform to a template and hence reduce the sensitivity to abnormalities.
In our first comparative analyses we used a standard VBM procedure, modulated normalisation, that is thought to compensate, for example, for disproportionate stretching of parts of images [Good et al., 2001]. Modulation is usually needed to account for the global and local effect of the spatial normalisation. However, since this was not sensitive in detecting abnormalities in individual patients we also applied non‐modulated affine normalisation procedures that have been suggested to be more sensitive to detecting FCD [Wilke et al., 2003]. Wilke et al. could show that with a more liberal normalisation method, modulation is crucial, however with a more restricted normalisation algorithm like in the proposed “ideal method” modulation may be less important. An advantage of not using modulation is the better homogeneity of the data since global changes like total grey matter volume (bigger brains) are modelled out. Both methods, however, produced numerous changes in control subjects at lower smoothing levels, a matter not addressed by Wilke and colleagues [Wilke et al., 2003], but no definite abnormalities in patients when smoothing levels were increased to reduce the number of changes in control subjects. Additionally the sensitivity was not greater with the non‐modulated than the modulated analysis.
It has previously been shown that changing thresholds for voxel‐based comparisons to increase specificity will reduce sensitivity in individual patients with FCD [Colliot et al., 2006]. Smoothing of data also influences the results of VBM analyses. Whilst smoothing is needed to allow the images to conform more closely to a Gaussian field model and to increase the validity of statistical inference [Friston et al., 1995], excessive smoothing might reduce the chance of detecting any subtle abnormalities if the smoothing kernel is greater in extent than the expected pathology. It has, however, been shown that greater levels of smoothing (>8 mm FWHM) may be needed to ensure comparisons are valid when comparing single subjects to a group [Salmond et al., 2002]. Our normalisation and smoothing procedures were optimised for specificity in the control group, i.e., to reduce the number of abnormalities seen in the control group. The cortical changes identified histopathologically ranged from one to several gyri in one to six tissue blocks (equivalent to between ≤5 mm and approximately 30 mm). The most subtle changes were therefore smaller than all smoothing levels used, but the more extensive were greater than these.
In contrast to a previous study [Salmond et al., 2002], we found that the analyses were more sensitive to increases in grey matter than to decreases, i.e. there were numerous increases in grey matter volume in control subjects as well as patients, but fewer decreases in grey matter. The cortical neuronal loss in the patients would be expected to cause a reduction in grey matter volume, but no temporal lobe decreases were detected using any of the modulated or non‐modulated methods or smoothing levels. Further, VBM did not detect the HS (that results in a reduction in grey matter volume) in any of the patients. Previous VBM studies detecting grey matter changes in temporal lobe epilepsy and HS have been group studies [Bernasconi et al., 2004; Cormack et al., 2005; Keller et al., 2002, 2004; Mueller et al., 2006]. Our current results are in agreement with a previous study of individual patients with HS from our group using SPM96 [Woermann et al., 1999a]. No group analyses were performed in the current study since the extent and severity of changes were heterogeneous and the purpose of the work was to assess the sensitivity of VBM in individual patients.
There has been debate regarding whether VBM analyses have sufficient statistical power to detect structural abnormalities in individual brains [Ashburner and Friston, 2000]. Further, there have been discussions about reduced VBM sensitivity if images are not correctly registered [Ashburner and Friston, 2001; Bookstein, 2001] and suggestions that VBM results in, for example, dementia should be corroborated by volumetric studies [Allen et al., 2005]. VBM analyses are based on statistical significance thresholding, where thresholds are estimated using random field theory to correct for multiple dependent comparisons [Worsley et al., 1996]. These thresholds offer strong control over type I errors (false positives) at the expense of statistical power or control over false negatives. This is most apparent in regions with variable distribution of grey matter where even large lesions may not be detected using VBM [Mehta et al., 2003]. This might partly explain the failure of SPM/VBM to detect HS in individuals since the anatomy of the medial temporal structures can vary greatly even between normal control subjects. There were also a larger proportion of females in the control group. It is possible that a larger control group might increase the sensitivity, but decommissioning of our 1.5T scanner curtailed any further scanning at this field strength comparable to patient data. We have, however, detected changes in individual epilepsy patients previously using VBM and several different MRI sequences using a similar number of control subjects [Eriksson et al., 2001; Rugg‐Gunn et al., 2003, 2005, 2006; Salmenpera et al., 2007].
In FCD, changes have been detected in individual patients [Bonilha et al., 2006; Colliot et al., 2006]. In these cases there is often an increase in grey matter, which is correspondingly thickened on histopathological analysis. It is possible that such changes are more easily detected using VBM than reductions in grey matter in areas that might also have great inter‐individual variability. No analyses of cortical thickness were possible on the histopathological sections since it could not be ascertained that sections were cut perpendicular to the cortex, and obliquely cut sections could have falsely given the impression of increased thickness.
In summary, using VBM and SPM5 of T1‐weighted volume images we could not detect HS or cortical neuronal loss in individual epilepsy patients. This suggests that the methodology might currently not be suitable to detect certain types of occult abnormalities possibly associated with seizure onset zone in individual patients in whom visual inspection of routine MRI shows no abnormalities.
Acknowledgements
We are grateful to the Big Lottery Fund, Wolfson Trust, and National Society for Epilepsy for supporting the 3T MRI scanner at NSE. We thank the radiographers and radiologists at the National Society for Epilepsy MR scanner and Robert Courtney and Steve Durr at the Division of Neuropathology, National Hospital for Neurology and Neurosurgery, University College London, London, UK. This work was undertaken at UCLH/UCL, which received a proportion of funding from the Department of Health's NIHR Biomedical Research Centres funding scheme.
REFERENCES
- Allen JS,Bruss J,Brown CK,Damasio H ( 2005): Methods for studying the aging brain: Volumetric analyses versus VBM. Neurobiol Aging 26: 1275–1278. [Google Scholar]
- Ashburner J,Friston KJ ( 2000): Voxel‐based morphometry—The methods. NeuroImage 11: 805–821. [DOI] [PubMed] [Google Scholar]
- Ashburner J,Friston KJ ( 2001): Why voxel‐based morphometry should be used. Neuroimage 14: 1238–1243. [DOI] [PubMed] [Google Scholar]
- Bernasconi N,Duchesne S,Janke A,Lerch J,Collins DL,Bernasconi A ( 2004): Whole‐brain voxel‐based statistical analysis of gray alter and white matter in temporal lobe epilepsy. NeuroImage 23: 717–723. [DOI] [PubMed] [Google Scholar]
- Betting LE,Mory SB,Li LM,Lopes‐Cendes I,Guerreiro MM,Guerreiro CA,Cendes F ( 2006): Voxel‐based morphometry in patients with idiopathic generalized epilepsies. NeuroImage 32: 498–502. [DOI] [PubMed] [Google Scholar]
- Bonilha L,Montenegro MA,Rorden C,Castellano G,Guerreiro MM,Cendes F,Li LM ( 2006): Voxel‐based morphometry reveals excess gray matter concentration in patients with focal cortical dysplasia. Epilepsia 47: 908–915. [DOI] [PubMed] [Google Scholar]
- Bookstein FL ( 2001): “Voxel‐based morphometry” should not be used with imperfectly registered images. Neuroimage 14: 1454–1462. [DOI] [PubMed] [Google Scholar]
- Bruton CJ ( 1988): The neuropathology of temporal lobe epilepsy Institute of Psychiatry, Maudsley Monograph No. 31, Oxford University Press. [Google Scholar]
- Colliot O,Bernasconi N,Khalili N,Antel SB,Naessens V,Bernasconi A ( 2006): Individual voxel‐based analysis of gray matter in focal cortical dysplasia. NeuroImage 29: 162–171. [DOI] [PubMed] [Google Scholar]
- Cormack F,Gadian DG,Vargha‐Khadem F,Cross JH,Connelly A,Baldeweg T ( 2005): Extra‐hippocampal grey matter density abnormalities in paediatric mesial temporal sclerosis. NeuroImage 27: 635–643. [DOI] [PubMed] [Google Scholar]
- Duncan JS,Bartlett P,Barker GJ ( 1996): Technique for measuring hippocampal T2 relaxation time. Am J Neuroradiol 17: 1805–1810. [PMC free article] [PubMed] [Google Scholar]
- Eriksson SH,Rugg‐Gunn FJ,Symms MR,Barker GJ,Duncan JS ( 2001): Diffusion tensor imaging in patients with epilepsy and malformations of cortical development. Brain 124: 617–626. [DOI] [PubMed] [Google Scholar]
- Friston KJ,Holmes AP,Worsley KJ,Poline JP,Frith JD,Frackowiak RSJ ( 1995): Statistical parametric maps in functional imaging: A general linear approach. Hum Brain Mapp 2: 189–210. [Google Scholar]
- Garbelli R,Meroni A,Magnaghi G,Beolchi MS,Ferrario A,Tassi L,Bramerio M,Spreafico R ( 2006): Architectural (Type IA) focal cortical dysplasia and parvalbumin immunostaining in temporal lobe epilepsy. Epilepsia 47: 1074–1078. [DOI] [PubMed] [Google Scholar]
- Good CD,Johnsrude IS,Ashburner J,Henson RNA,Friston KJ,Frackowiak RSJ ( 2001): A voxel‐based morphometric study of ageing in 465 normal adult human brains. NeuroImage 14: 21–36. [DOI] [PubMed] [Google Scholar]
- ILAE ( 2001): ILAE Commission Report. Proposal for a new classification of outcome with respect to epileptic seizures following epilepsy surgery. Epilepsia 42: 282–286. [PubMed] [Google Scholar]
- Jackson GD,Berkovic SF,Tress BM,Kalnins RM,Fabinyi GCA,Bladin PF ( 1990): Hippocampal sclerosis can be reliably detected by magnetic resonance imaging. Neurology 40: 1869–1875. [DOI] [PubMed] [Google Scholar]
- Keller SS,Wieshmann UC,Mackay CE,Denby CE,Webb J,Roberts N ( 2002): Voxel based morphometry of grey matter abnormalities in patients with medically intractable temporal lobe epilepsy: Effects of side of seizure onset and epilepsy duration. J Neurol Neurosurg Psychiatry 73: 648–656. [DOI] [PMC free article] [PubMed] [Google Scholar]
- Keller SS,Wilke M,Wieshmann UC,Sluming VA,Roberts N ( 2004): Comparison of standard and optimized voxel‐based morphometry for analysis of brain changes associated with temporal lobe epilepsy. NeuroImage 23: 860–868. [DOI] [PubMed] [Google Scholar]
- Mehta S,Grabowski TJ,Trivedi Y,Damasio H ( 2003): Evaluation of voxel‐based morphometry for focal lesion detection in individuals. NeuroImage 20: 1438–1454. [DOI] [PubMed] [Google Scholar]
- Mueller SG,Laxer KD,Cashdollar N,Buckley S,Paul C,Weiner MW ( 2006): Voxel‐based optimized morphometry (VBM) of gray and white matter in temporal lobe epilepsy (TLE) with and without mesial temporal sclerosis. Epilepsia 47: 900–907. [DOI] [PMC free article] [PubMed] [Google Scholar]
- Roch C,Leroy C,Nehlig A,Namer IJ ( 2002): Magnetic resonance imaging in the study of the lithium‐pilocarpine model of temporal lobe epilepsy in adult rats. Epilepsia 43: 325–335. [DOI] [PubMed] [Google Scholar]
- Rugg‐Gunn FJ,Eriksson SH,Boulby PA,Symms MR,Barker GJ,Duncan JS ( 2003): Magnetization transfer imaging in focal epilepsy. Neurology 60: 1638–1645. [DOI] [PubMed] [Google Scholar]
- Rugg‐Gunn FJ,Boulby PA,Symms MR,Barker GJ,Duncan JS ( 2005): Whole‐brain T2 mapping demonstrates occult abnormalities in focal epilepsy. Neurology 64: 318–325. [DOI] [PubMed] [Google Scholar]
- Rugg‐Gunn FJ,Boulby PA,Symms MR,Barker GJ,Duncan JS ( 2006): Imaging the neocortex in epilepsy with double inversion recovery imaging. NeuroImage 31: 39–50. [DOI] [PubMed] [Google Scholar]
- Salmenpera TM,Symms MR,Rugg‐Gunn FJ,Boulby PA,Free SL,Barker GJ,Yoursy TA,Duncan JS ( 2007): Evaluation of quantitative magnetic resonance imaging contrasts in MRI‐negative refractory focal epilepsy. Epilepsia 48: 229–237. [DOI] [PubMed] [Google Scholar]
- Salmond CH,Ashburner J,Vargha‐Khadem F,Connelly A,Gadian DG,Friston KJ ( 2002): Distributional assumptions in voxel‐based morphometry. Neuroimage 17: 1027–1030. [PubMed] [Google Scholar]
- Thom M,Holton JL,D'Arrigo C,Griffin B,Beckett A,Sisodiya S,Alexiou D,Sander JW ( 2000): Microdysgenesis with abnormal cortical myelinated fibres in temporal lobe epilepsy: A histopathological study with calbindin D‐28‐K immunohistochemistry. Neuropathol Appl Neurobiol 26: 251–257. [DOI] [PubMed] [Google Scholar]
- Wilke M,Kassubek J,Ziyeh S,Schulze‐Bonhage A,Huppertz HJ ( 2003): Automated detection of gray matter malformations using optimized voxel‐based morphometry: A systematic approach. NeuroImage 20: 330–343. [DOI] [PubMed] [Google Scholar]
- Woermann FG,Barker GJ,Birnie KD,Meencke HJ,Duncan JS ( 1998): Regional changes in hippocampal T2 relaxation and volume: A quantitative magnetic resonance imaging study of hippocampal sclerosis. J Neurol Neurosurg Psychiatry 65: 656–664. [DOI] [PMC free article] [PubMed] [Google Scholar]
- Woermann FG,Free SL,Koepp MJ,Ashburner J,Duncan JS ( 1999a): Voxel‐by‐vowxel comparison of automatically segmented cerebral grey matter—a rater independent comparison of structural MRI in patients with epilepsy. NeuroImage 10: 373–384. [DOI] [PubMed] [Google Scholar]
- Woermann FG,Free SL,Koepp MJ,Sisodiya SM,Duncan JS ( 1999b): Abnormal cerebral structure in juvenile myoclonic epilepsy (JME) demonstrated with voxel‐based analysis of MRI. Brain 122: 2101–2107. [DOI] [PubMed] [Google Scholar]
- Worsley KJ,Marrett S,Neelin P,Vandal AC,Friston KJ,Evans AC ( 1996): A unified statistical approach for determining significant signals in images of cerebral activation. Human Brain Mapp 4: 58–73. [DOI] [PubMed] [Google Scholar]