Abstract
[18F]fallypride PET studies can be used to estimate the non-displaceable binding potential (BPND) in vivo of dopamine D2/D3 receptor-rich regions of the brain. These studies often take considerable time, up to two or more hours, limiting the throughput. In this work, we investigated whether limited-duration scans performed subsequent to tracer administration yielded stable BPND estimates. In particular, we applied a modified version of the Logan plot method on the last 60 min of 120 min data and compared the results to those from analysis of the full data set.
Methods
Fourteen male Sprague-Dawley rats were injected with [18F]fallypride intravenously while under isoflurane anesthesia and dynamic data were acquired on the microPET Focus 220 for 120 min. The distribution volume ratio (DVR = BPND + 1) was calculated from a Logan plot using 120 min of data and from a modified version using only the last 60 min. Three of these rats were imaged again on a second day to test the reproducibility. A two-tissue compartment model also was used to fit the time activity curves (TACs) of the 120 min scans to estimate the parameters K1, k2, kon, k4, and Bmax. These parameters then were used to simulate similar TACs while changing kon to reflect changes in the dopaminergic system. The simulated TACs were used as a means for exploring the differences in DVR estimates between the last 60 min only and the full 120 min of simulated data.
Results
The average DVR from the full 120 min scans was 13.8 ± 0.9 whereas the average distribution volume ratio estimated from only the last 60 min of data (DVR′) was 16.3 ± 1.0. The distribution volume ratio estimates showed good reproducibility in the three rats (mean DVR = 13.8 ± 1.5 on Day 1 and DVR = 13.8 ± 0.9 on Day 2). The simulations showed that the relationship between DVR′ and DVR estimates follows a semi-linear form with varying kon.
Conclusion
Although the BPND estimates are slightly overestimated in a delayed scan mode (i.e. no initial radiotracer uptake measurements) compared to a full scan, this overestimation depends primarily on k3 (≈ kon × Bmax) and has been evaluated in this work for a wide range of kon values using simulated TACs. In particular, the sensitivity of DVR′ to changes in kon is similar to that of DVR. This method of delayed scans eliminates the necessity of imaging during the initial uptake of the radiotracer and, thus, can be used to increase the throughput of studies.
Keywords: 18F-fallypride, dopamine receptors, graphical analysis, kinetic modeling, microPET
Introduction
[18F]fallypride [1] is a selective, high affinity PET dopamine D2/D3 (DA D2/3) receptor radioligand. Its high specific in vivo uptake in brain regions containing DA D2/3 receptors as well as the reversibility of its in vivo binding to these receptors allows quantitation of their levels in striatal and extrastriatal brain regions using reversible kinetic modeling methods [2]. However, it has been reported that accurate quantitation of striatal DA D2/3 levels in non-human primates (NHPs) requires two hours [3, 4]. If rats required two hours of imaging as well, then the number of animals that could be studied in a single [18F]fallypride synthesis would be limited to avoid mass effects [5, 6], since the mass injected for the same 18F radioactivity would be more than twice for the later study. Differences in the injected mass of a dose can cause differences in receptor displacement [7]. Alexoff et al. [8] demonstrated the dependence of PET-determined distribution volume ratios (DVR = BPND + 1 [9]) in the striatum and cerebellum on the mass of injected [11C]raclopride, another selective D2/3 radioligand. Here, BPND refers to the ratio at equilibrium of specifically bound radioligand to that of nondisplaceable radioligand in tissue. It refers to in vivo measurements that reflect the ratio of receptor density (Bmax) to radioligand dissociation constant (KD). Thus, BPND is proportional to the concentration of unoccupied or available receptors, Bavail [2].
Given the expense of [18F]fallypride synthesis, we examined whether it is possible to decrease the time needed for quantitation of tracer binding to DA D2/3 receptors, thereby increasing the throughput and reducing the overall cost of [18F]fallypride studies. The method investigated involves a shortened scan time following a delay between radiotracer injection and imaging., The purpose of the present work was to gauge the effect of this reduced and delayed scan time on microPET-derived DVR estimates.
Materials and Methods
Theory
The DVR can be obtained using graphical methods developed by Logan [9]. A Logan plot relies on using the time-activity curve (TAC) of a reference tissue with no specific binding of the radiotracer and the TAC of a receptor-rich region with specific binding of the radiotracer as displayed in the following equation:
| (1) |
where Crich is the concentration of the tracer in the receptor rich region, Creference is the concentration of the tracer in the reference (receptor poor) region and k̄2ref is the average tissue-to-plasma efflux constant. At some time t*, the Logan plot becomes linear and the slope of the linear regression line yields the DVR. For the time t*, we can rewrite equation 1 above in the following form:
| (2) |
In this work, we seek to exclude the data for the concentration of the radiotracer in the brain at any point prior to the time point t*, and we represent this situation as:
| (3) |
The portions of equation 2 that are not included in equation 3 can be written as:
| (4) |
This is the part of the Logan plot we aim at neglecting by carrying out delayed scans to facilitate increased throughput. From equation 2, 3, and 4, DVR′ can be related to DVR in the following way:
| (5) |
At time t*, (DVR/k̄2ref)Creference(T)/Crich (T) becomes small and/or reasonably constant and this term can be neglected [9]. Thus, equation 5 can be rewritten as
| (6) |
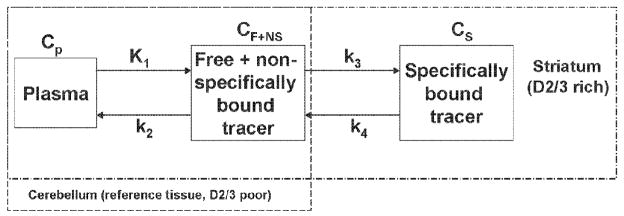
To obtain a simpler and clearer picture of the parameters that affect the difference between DVR′ and DVR, we can use the general solution [10] for a plasma plus two tissue compartment model similar to that shown in Figure 1:
where
Figure 1.
A two-tissue plus plasma compartment model. The cerebellum, which contain little or no dopamine D2/3 receptors, is governed by Cp and CF+NS, while the striatum, which is a D2/3 receptor-rich region, is governed by all 3 compartments.
Cp is the concentration of the radiotracer in the plasma, K1 is the rate coefficient for radiotracer transfer from compartment 1 (plasma) to compartment 2 (extracellular compartment) in units of ml/min/g, k2 is the rate constant for transfer from 2 to 1 (1/min), k3 is the rate constant for transfer from 2 to 3 (intracellular compartment) (1/min), and k4 is the rate constant for transfer from 3 to 2 (1/min) [2]. Crich (t) represents the concentration of the radiotracer in receptor rich tissue. This receptor rich tissue contains concentrations of the radiotracer that is specifically bound to the receptor(s) as well as free and nonspecifically bound radiotracer. Thus Crich is governed by all three compartments as shown in Figure 1, i.e. Crich(t) = CP (t) + CF+NS(t) + CS (t).
Thus, the final expression of equation 6 becomes:
| (7) |
where we used
and [9]
Equation 7 displays how the difference between DVR′ (obtained from delayed scans) and DVR (obtained from a full scan) is influenced by the change in K1, k2, k3 and k4. However, in a neuroreceptor study where a receptor-specific binding radioligand is used, K1 and k2 remain nearly constant since they represent the flow rate of the radiotracer from plasma to non-specific binding of the tracer in tissue and vice versa. In receptor binding kinetics, k4 ≈ koff [2] and is a parameter indicative of tracer affinity. Therefore, we can assume k4 to be constant as long as the same radiotracer is being used, and the significant parameter in equation 7 that can vary is k3. A variation in k3 can occur when using a challenge drug that does not alter the physiology but only affects the system of the neuroreceptor being targeted, or the nonradioactive version of the tracer (i.e. when the specific activity of the radiotracer is altered). The model predicts that the difference between DVR′ and DVR will remain constant as long as k3 remains constant.
The second and third term in equation 7 may indicate that the difference between DVR′ and DVR decreases as k3 increases. However, It is difficult to conclusively predict from equation 7 in what direction the change in the difference between DVR′ and DVR will be if k3 increases or decreases. To investigate the stability of the difference between DVR′ and DVR across multiple subjects, we measured the difference between DVR′ and DVR at baseline level, i.e. without any challenge to the dopaminergic system, on fourteen rats. On the other hand, to investigate how the difference between DVR′ and DVR behaves for different values of kon (≈ k3 × Bmax), we generated TACs for different values of kon and carried out the same analysis on this simulated data.
Experimental Procedure
To determine the minimum time needed to obtain stable BPND estimates for rats, a male Sprague-Dawley rat (330 g) was anesthetized with 1.5% isoflurane, positioned on a rat bed and placed in the microPET Focus 220 (Siemens, Knoxville, TN). A dynamic acquisition was started for 150 min and approximately 15 MBq/0.2ml of [18F]fallypride [11, 12] was administered into the rat intravenously 30 sec after the start of the scan followed by a 0.1 ml saline flush. A CT image of the rat head was then produced using the microCAT II (Siemens, Knoxville, TN) at x-ray beam intensity of 27 mAs and tube voltage of 80 kVp.
To study the relationship between estimates of DVR and DVR′, fourteen male Sprague-Dawley rats (~320 g) were imaged in the same manner as above, except this time, the dynamic acquisition was set to 120 min. DVR and DVR′ were estimated from the full 120 min and from only the last 60 min of data, respectively. Three of the rats were imaged a second time with a minimum of 5 days between scans to test the reproducibility of the estimates.
Image Reconstruction
The 150 min dynamic acquisition was divided into five frames at 60 sec, one frame at 300 sec, and 14 frames at 600 sec. The two hour dynamic sequence consisted of five frames at 60 sec, one frame at 300 sec and 11 frames at 600 sec. The data from all possible lines of response (LOR) were saved in the list mode raw data format. The raw data was then binned into 3D sinograms with a span of 3 and ring difference of 47. The images were reconstructed using an iterative ordered subsets expectation maximization (OS-EM 2D) algorithm with 16 subsets and 4 iterations into transaxial slices(128 × 128 × 95) with voxel sizes of 0.095 × 0.095 × 0.08cm3.
Image Corrections
Scatter corrections were applied using an algorithm developed by Watson et al. [13] and implemented in the microPET software. Attenuation corrections were made by generating an attenuation map (sinogram) from the CT image of the rat brain region. The CT image was first co-registered with the microPET image and then segmented into air, soft tissue, and bone. The corresponding distribution of attenuation coefficients was then projected into sinograms. An MR rat brain template [14] was co-registered with the CT and PET images and an anatomical regions of interest (ROIs) were used to correct for partial volume effects (PVE) [15] using recovery coefficients estimated from images of a cone-shaped phantom.
Data Analysis
Volumetric anatomical ROI’s were drawn around the cerebellum, left striatum and right striatum in the rat brain template over 3 slices using the medical imaging analysis tool AMIDE [16] as shown in Figure 2. The concentrations of the left and right striatum were averaged at each time point and a single TAC was generated for the striatum for each rat. A TAC was also generated for cerebellum over the reconstructed time frames for each rat. The DVR was estimated using the Logan plot tool in version 2.6 of the commercial PMOD software (PMOD Technologies, Zürich, Switzerland, www.pmod.com), where the cerebellum, which has few or no D2 receptors, was taken as the reference tissue. For the 150 min scan, the DVR value was estimated by first using the TACs of the first 60 min only to generate a Logan plot, and then progressively with an additional ten minutes of data each time up to the full 150 min to test the dependence of the DVR estimate on scan duration and determine the minimum time needed to obtain stable DVR estimates.
Figure 2.
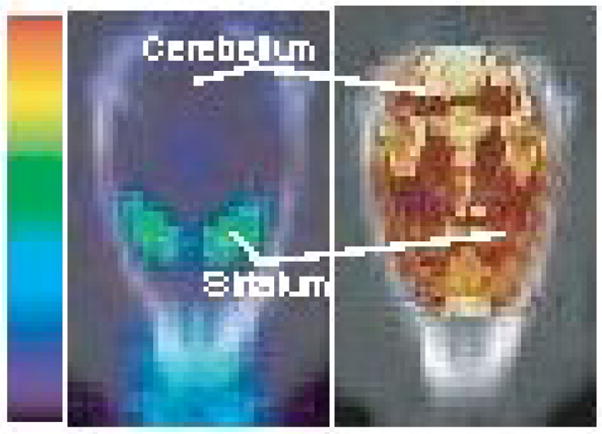
PET image registered to CT (left) of a rat injected with [18F]fallypride. The striata are D2 rich regions while the cerebellum is D2 poor. The same CT image was registered to an MRI rat brain template (right). Regions of interest (ROIs) were drawn over the striata and cerebellum in the template and transformed to the PET image.
In the second experiment, DVR′ estimates of the last 60 min of the 120 min scans, after neglecting the first 60 min, were compared to the DVR estimates of the full 120 min of data to test the feasibility of using delayed scans to obtain stable BPND estimates using our modified Logan plot. PMOD was used here also to estimate DVR and DVR′.
Modeling and Simulations
Time activity curves of the cerebellum and striatum were fitted with a two-tissue + plasma compartment model using PMOD to obtain the kinetic transfer rates (K1, k2, kon, and koff) as well as Bmax. Since we did not do any blood sampling on the rats, an arbitrary simulated realistic plasma input function based on a multi exponential form available in COMKAT [17] was used. The point of using such an arbitrary function was not to determine the exact values of K1, k2, kon, and k4 but to be able to establish simulated TACs in which kon is varied while K1, k2, and k4 are fixed and determine how DVR′ estimates compare to DVR estimates with varying kon. As noted above, alterations in k3 (and thus, kon) represent alterations in the dopaminergic system which could happen due to disease, drug effects, anesthesia, or other conditions. Once the kinetic parameters were estimated, we varied kon in equal steps over a wide range to be able to demonstrate the correlation between DVR and DVR′ as a function of kon. With each value of kon, we generated a simulated TAC of the striatum. Alterations in kon represent alterations in the dopaminergic system and receptor availability, which can occur when a subject is challenged with cocaine for example [4]. We then used PMOD to estimate the DVR of the simulated TACs utilizing a Logan plot. The resultant DVR estimates from the full 120 min of the simulated TACs were compared to the DVR′ estimates using only the last 60 min of the simulated TACs. For comparison, we simulated another set of TACs using the kinetic parameters that were reported for non-human primates [3].
Statistical Analysis
Paired t-tests were carried out using GraphPad Prism software, version 4.03 (GraphPad Software Inc.). A two tailed paired t-test was made by comparing the results of the DVR estimates deduced from the Logan plots of the full 120 min of data to the DVR′ estimates of the last 60 min of data. A two-tailed probability of P < 0.05 was selected as the significance threshold [18].
Results
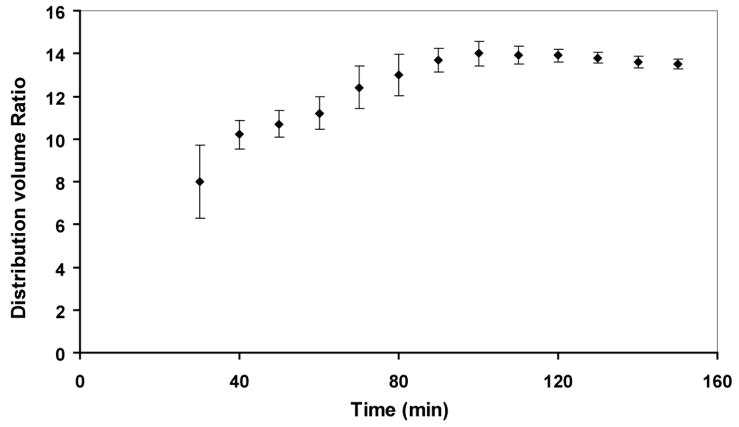
The resulting DVR estimates at different time points for the 150 min dynamic acquisition were found to reach a plateau and remain fairly constant after 100 min as shown in Figure 3, representing a state of equilibrium of the exchange of [18F]fallypride between plasma and tissue. At late time points, we observed skeletal uptake, presumably indicating release of free fluoride due to defluorination of [18F]fallypride. The skull uptake of 18F- produces spill-over effects, especially in the cerebellum, which can add an uncertainty to the true [18F]fallypride concentration in that region. Thus, we chose conservatively to image for 120 min. This length of time is consistent with similar [18F]fallypride protocols used in imaging non-human primates [3, 4].
Figure 3.
Distribution volume ratio (DVR) estimates at different time points of a rat injected with [18F]fallypride and imaged in the microPET for 150 min.
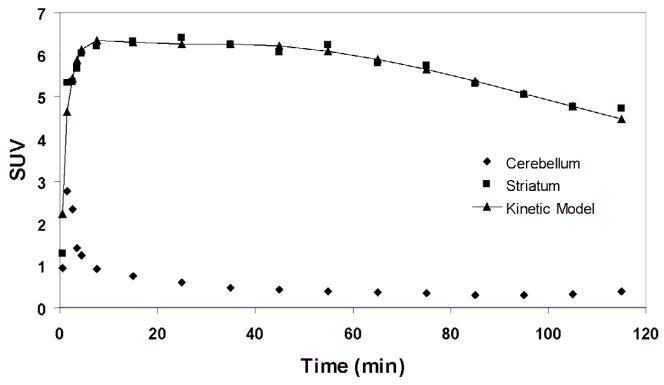
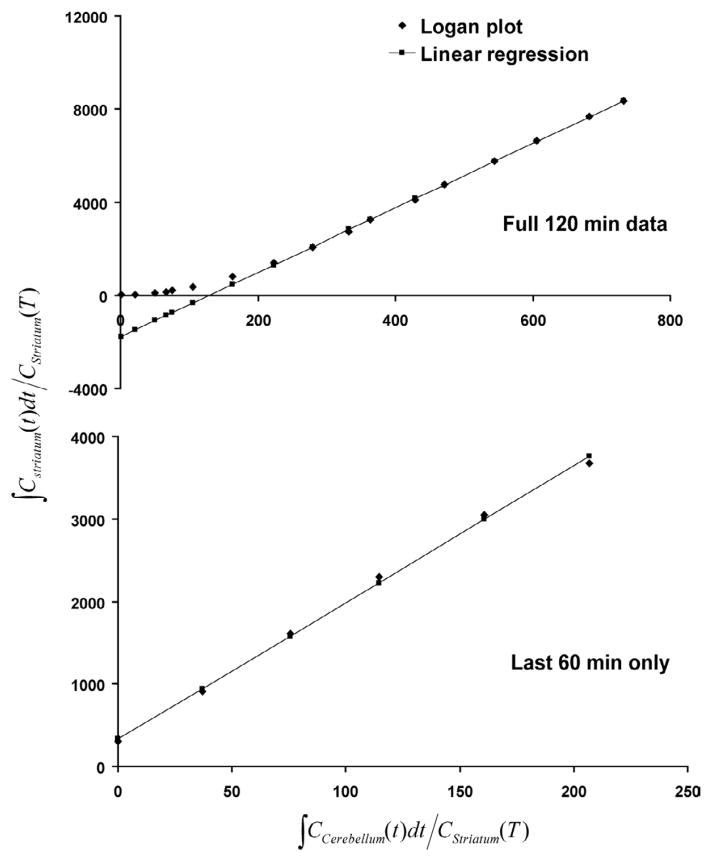
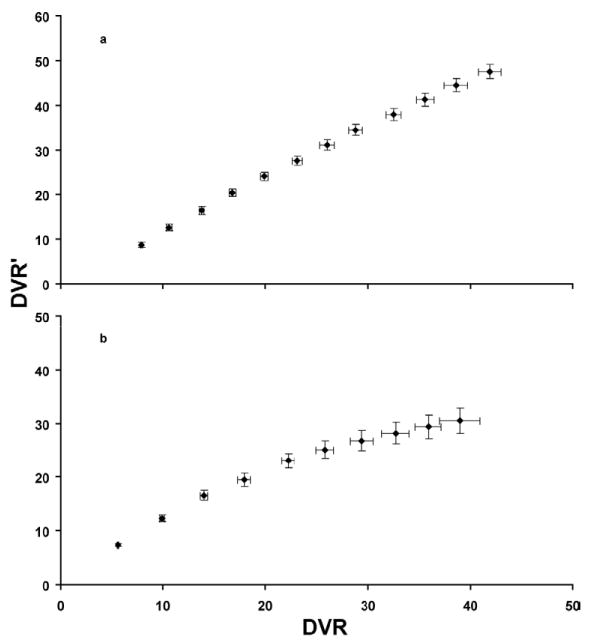
The TACs over the full 120 min of a representative scan from the second experiment are shown in Figure 4. The average DVR of the 120 min scans for the 14 rats was 13.8 ± 0.9 whereas the average DVR′ of the last 60 min of data (see Figure 5) from the 120 min scans after neglecting the first 60 min was 16.3 ± 1.0 (P < 0.0001, t(13) = 14.8) (see Figure 6). The correlation between the DVR and DVR′ estimates is shown in Figure 7.
Figure 4.
Time activity curves (TACs) of cerebellum and striatal uptake of [18F]Fallypride in a 120 min dynamic PET acquisition. The striatum TAC was fitted using a two-tissue compartment model and a realistic plasma input function.
Figure 5.
Logan plots of a rat injected with [18F]Fallypride and imaged in the mPET for 120 min while anesthetized with 1.5% isoflurane. The Logan plot of the full 120 min data (DVR = 13.9 ± 0.2) is compared here to the Logan plot of the last 60 min (DVR′ = 16.6 ± 0.8) of the 120 min data after neglecting the the first 60 min.
Figure 6.
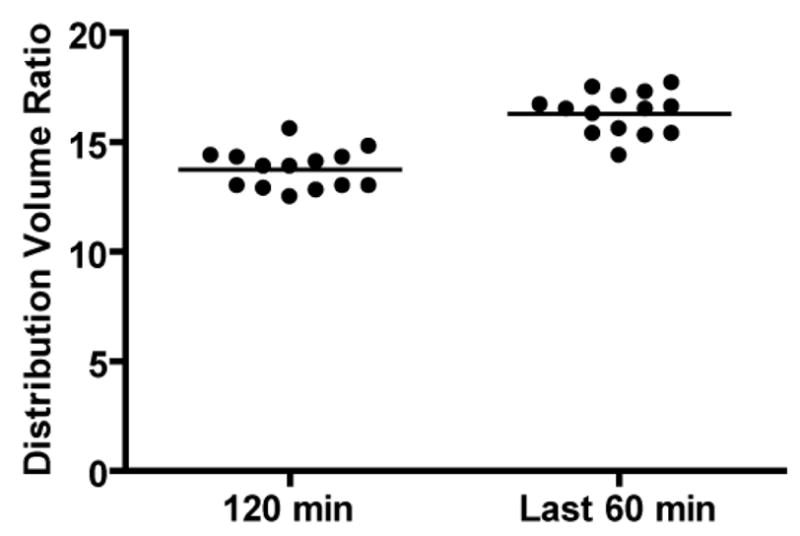
Statistical display of the DVR estimates from a 120 min scan versus the DVR′ estimates of the last 60 min of data from the full 120 min after neglecting the first 60 min.
Figure 7.
Correlation of DVR and DVR′ obtained from fitting the 120 min and the last 60 min of simulated TACs as a function of kon, respectively, while varying kon. (a) The simulated TACs used the parameters obtained from fitting the experimental TACs to a two-tissue compartment model. (b) The simulated TACs used the NHP kinetic uptake parameters found in the literature [3].
In the reproducibility test, the DVR estimates for the full 120 min data from day 1 and day 2 are displayed in Table 1. In addition, Table 1 displays the DVR′ estimates of the last 60 min of the full 120 min data for both days. The mean DVR estimate for Day 1 was 13.8 ± 1.5 (mean ± SD) while the mean DVR estimate for Day 2 was 13.8 ± 0.9 (P = 0.94, t(2) = 0.08). On the other hand, the mean DVR′ estimate for Day 1 was 16.0 ± 1.0 while the mean DVR′ estimate for Day 2 was 16.5 ± 1.1 (P = 0.18, t(2) = 2.00).
Table 1.
Reproducibility measurements on rats injected with [18F]fallypride and imaged for 120 min in the μPET. The DVR estimates were determined from the linear regression of a Logan plot for the full 120 min data while the DVR′ estimates were determined from the linear regression of a Logan plot of the last 60 min of the full 120 min data after neglecting the first 60 min. The standard error is the error in the linear regression.
| Rat Number | Day 1 DVR (Value ± SE) | Day 2 DVR (Value ± SE) | Day 1 DVR′ (Value ± SE) | Day 2 DVR′ (Value ± SE) |
|---|---|---|---|---|
| 1 | 12.9 ± 1.8 | 12.8 ± 1.7 | 15.3 ± 0.5 | 15.4 ± 0.8 |
| 2 | 13.0 ± 1.5 | 14.4 ± 1.9 | 15.6 ± 1.0 | 16.5 ± 0.7 |
| 3 | 15.6 ± 1.9 | 14.1 ± 0.9 | 17.1 ± 2.2 | 17.5 ± 0.7 |
| Mean | 13.8 ± 1.5 | 13.8 ± 0.9 | 16.0 ± 1.0 | 16.5 ± 1.1 |
The fit of the experimental TACs from the striatum using a two-tissue compartment model in PMOD gave the following parameters: K1 = 2.0 (ml/min/g), k2 = 0.36 (1/min), kon = 0.0015 (ml/pmol.min), k4 = 0.021 (1/min), and Bmax = 27.3 pmol/ml (see Figure 4). The variation of the difference between DVR and DVR′ as a function of kon is shown in Figure 7a.
Discussion
BPND is the typical measurement from reference tissue methods, as it compares the concentration of radioligand in receptor-rich to receptor-free regions [2]. An over estimation is observed in the DVR′ estimates when taking just the last 60 min as compared to the DVR estimates of the full 120 min data. As predicted by equation 7, k3 (≈ kon × Bmax) plays a major role in the degree of variation between DVR′ and DVR. The 18% experiment and simulated difference between DVR′ and DVR is consistent with the % difference obtained from the simulations that used the NHP kinetic parameters [3] for DVR values of ≈ 14 (see Figure 7) even though the K1/k2 ratio is significantly different from what we obtained (compare 0.17/0.21 using the NHP kinetic parameters to 2.0/0.36 using the kinetic model fit in this work). At much higher DVR values (greater than 30), the relationship between DVR and DVR′ becomes non-linear and a difference in the correlation of DVR and DVR′ between the simulations that used the rat kinetic parameters above and the simulations that used the NHP kinetic uptake parameters is observed. This suggests that the ratio K1/k2 does not play a significant role in the estimations of DVR′ except at values of DVR larger than the ~14 observed in control rats studied here.
Although the amount of difference between DVR and DVR′ changes with variations in kon, the difference between DVR and DVR′ will change proportionally with this variation in a carefully designed study. While DVR′ might be viewed as a biased estimate of DVR, of more importance is the fact that it is sensitive to changes in kon and, therefore, can be used in the same way to study perturbations to the dopaminergic system.
We have observed up to 25% variation in BPND estimates across rats when using [18F]fallypride, which can bee seen in the DVR and DVR′ estimates shown here. However, we do observe slightly more variation among subjects in the DVR′ estimates as compared to the DVR estimates. While we do not understand the origin of this difference in detail, it may be related to the fact that fewer points are used in the fit when using the last 60 min of data only.
This method of using a modified Logan plot can be applied in the following way: while one rat is being imaged for 60 min, a second rat can be injected and by the time the scan of the first rat is completed, the second rat is ready to be imaged for 60 min. From the point of view of time and cost, this method doubles the throughput over the traditional 120 min scans and reduces the cost of imaging through reduced scan time and the larger number of studies that can be completed for each radiotracer synthesis [3, 4]. Moreover, taking into consideration the impact of isoflurane anesthesia on the dopaminergic system [19–21], this method of delayed scans also provides an excellent tool to probe anesthetic effects on this system. DVR′ estimates obtained using a protocol with conscious injection and 60 min uptake, followed by imaging for 60 min under anesthesia can be compared to estimates for the same animal on a different day while anesthetized from the time of injection until the end of the scan.
There are other scientific benefits to carrying out neuroreceptor imaging in animals after a conscious uptake period of the radiotracer. Studies requiring a pharmacological challenge may be better served when anesthetics are not applied. For example, Tsukada et al [20] displayed how isoflurane anesthesia caused a significant reduction of [11C]raclopride binding in vivo in NHP brain after nicotine injection compared to the conscious uptake. Conscious uptake studies also allow for behavioral studies and challenges to be carried out post radiotracer injection and prior to imaging. For example, a fear condition could be applied to the rat during the initial 60 min uptake period and the resulting BPND estimates from the delayed scan can be compared to the BPND estimate of the same rat on a different day in the absence of any challenge. This approach could be especially useful in extension of fear studies and the study of post traumatic stress disorder (PTSD).
Conclusion
In this work we demonstrate a method to increase the throughput of [18F]fallypride imaging of rats by only imaging for 60 min following a 60 min post injection uptake period. We were able to obtain estimates of DVR′ that are proportional to the conventional DVR under appropriate conditions. We aim to apply this method to clinical studies of [18F]fallypride or any other radiotracer that exhibits a suitable reference tissue and is amenable to a Logan plot analysis, although one must consider that the amount of imaging time needed and the waiting period post injection may be different for different radiotracers. In addition to cutting animal and human imaging times by up to half in these types of studies, this method also offers a new way to conduct pharmacological and behavioral challenge studies while minimizing confounding effects from anesthesia.
Acknowledgments
Financial support provided by NCRR shared instrumentation grant 1S10 RR17858, Career Award at the Scientific Interface from the Burroughs Wellcome Fund (TEP), and by grants from the National Institute of Mental Health.
We would like to thank Jarrod True, Jennifer Begtrup, and Zou Yue for their assistance with the animal handling, injection, and imaging, and Jeff Clanton and Jarrod Driskill for fluorine-18 production. Vanderbilt is a site in the National Institutes of Health-supported Molecular Libraries.
Footnotes
Publisher's Disclaimer: This is a PDF file of an unedited manuscript that has been accepted for publication. As a service to our customers we are providing this early version of the manuscript. The manuscript will undergo copyediting, typesetting, and review of the resulting proof before it is published in its final citable form. Please note that during the production process errors may be discovered which could affect the content, and all legal disclaimers that apply to the journal pertain.
References
- 1.Mukherjee J, Yang Z-Y, Das MK, Brown T. Fluorinated benzamide neuroleptics3. Development of (S)-N-[(1-allyl-2-pyrrolidinyl)methyl]-5-(3-[18F]fluoropropyl)-2,3-dimethoxybenzamide as an improved dopamine D-2 receptor tracer. Nucl Med Biol. 1995;22:283–96. doi: 10.1016/0969-8051(94)00117-3. [DOI] [PubMed] [Google Scholar]
- 2.Innis RB, Cunningham VJ, Delforge J, Fujita M, Gjedde A, Gunn RN, et al. Consensus nomenclature for in vivo imaging of reversibly binding radioligands. J Cereb Blood Flow Metab. 2007;27:1533–9. doi: 10.1038/sj.jcbfm.9600493. [DOI] [PubMed] [Google Scholar]
- 3.Christian BT, Narayanan TK, Shi B, Mukherjee J. Quantitation of striatal and extrastriatal D-2 dopamine receptors using PET imaging of [18F]fallypride in nonhuman primates. Synapse. 2000;38:71–9. doi: 10.1002/1098-2396(200010)38:1<71::AID-SYN8>3.0.CO;2-2. [DOI] [PubMed] [Google Scholar]
- 4.Dalley JW, Fryer TD, Brichard L, Robinson ES, Theobald DE, Lääne K, et al. Nucleus accumbens D2/3 receptors predict trait impulsivity and cocaine reinforcement. Science. 2007;317:1033–5. doi: 10.1126/science.1137073. [DOI] [PMC free article] [PubMed] [Google Scholar]
- 5.Jagoda EM, Vaquero JJ, Seidel J, Green MV, Eckelman WC. Experiment assessment of mass effects in the rat: implications for small animal PET imaging. Nucl Med Biol. 2004;31:771–9. doi: 10.1016/j.nucmedbio.2004.04.003. [DOI] [PubMed] [Google Scholar]
- 6.Kung MP, Kung HF. Mass effect of injected dose in small rodent imaging by SPECT and PET. Nucl Med Biol. 2005 Oct;32:673–8. doi: 10.1016/j.nucmedbio.2005.04.002. [DOI] [PubMed] [Google Scholar]
- 7.Innis RB, Al-Tikriti MS, Zoghbi SS, Baldwin RM, Sybirska EH, Laruelle M, et al. SPECT imaging of the benzodiazepine receptor: feasibility of in vivo potency measurement from stepwise displacement. J Nucl Med. 1991;32:1654–761. [PubMed] [Google Scholar]
- 8.Alexoff DL, Vaska P, Marsteller D, Gerasimov T, Li J, Logan J, et al. Reproducibility of 11C-raclopride binding in the rat brain measured with the microPET R4: effects of scatter correction and tracer specific activity. J Nucl Med. 2003 May;44:815–22. [PubMed] [Google Scholar]
- 9.Logan J. Graphical analysis of PET data applied to reversible and irreversible tracers. Nuclear Medicine and Biology. 2000;27:661–70. doi: 10.1016/s0969-8051(00)00137-2. [DOI] [PubMed] [Google Scholar]
- 10.Phelps ME PET. Molecular imaging and its biological applications. Springer; 2004. p. 149. [Google Scholar]
- 11.Kessler RM, Votaw JR, de Paulis T, Bingham DR, Ansari MS, Mason NS, et al. Evaluation of 5-[18F]fluoropropylepidepride as a potential PET radioligand for imaging dopamine D2 receptors. Synapse. 1993;15:169–76. doi: 10.1002/syn.890150302. [DOI] [PubMed] [Google Scholar]
- 12.Ansari MS, Kessler RM, Clanton JA, de Paulis T, Baldwin RM. Comparison of three [18F]fallypride methods intended for automated remote chemistry modules. J Nucl Med (SNM abstract # 6595) 2006;47:159P. [Google Scholar]
- 13.Watson CC. New, faster image-based scatter correction for 3D PET. IEEE Trans Nucl Sci. 2000;47:1587–94. [Google Scholar]
- 14.Schweinhardt P, Fransson P, Olson L, Spenger C, Andersson JL. A template for spatial normalisation of MR images of the rat brain. J Neurosci Methods. 2003;129:105–13. doi: 10.1016/s0165-0270(03)00192-4. [DOI] [PubMed] [Google Scholar]
- 15.Kessler RM. Analysis of emission tomographic scan data: limitations imposed by resolution and background. Journal of Computer Assisted Tomography. 1984;8:514–22. doi: 10.1097/00004728-198406000-00028. [DOI] [PubMed] [Google Scholar]
- 16.Loening AM, Gambhir SS. AMIDE: a free software tool for multimodality medical image analysis. Mol Imaging. 2003;2:131–7. doi: 10.1162/15353500200303133. [DOI] [PubMed] [Google Scholar]
- 17.Muzic RF, Jr, Cornelius S. COMKAT: Compartment Model Kinetic Analysis Tool. J Nucl Med. 2001;42:636–45. [PubMed] [Google Scholar]
- 18.Rosenthal R, Gaito J. The interpretation of levels of significance by psychological researchers. Journal of Psychology. 1963;55:33–8. [Google Scholar]
- 19.Elfving B, Bornholm B, Knudsen GM. Interference of anaesthetics with radioligand binding in neuroreceptor studies. Eur J Nucl Med Mol Imaging. 2003;30:912–5. doi: 10.1007/s00259-003-1171-8. [DOI] [PubMed] [Google Scholar]
- 20.Tsukada H, Nishiyama S, Kakiuchi T, Ohba H, Sato K, Harada N, et al. Isoflurane anesthesia enhances the inhibitory effects of cocaine and GBR12909 on dopamine transporter: PET studies in combination with microdialysis in the monkey brain. Brain Res. 1999;849:85–96. doi: 10.1016/s0006-8993(99)02018-1. [DOI] [PubMed] [Google Scholar]
- 21.Votaw JR, Smith MB, Hua J, Voll R, Martarello L, Levey AI, et al. Interaction of Isoflurane with the Dopamine Transporter. Anesthesiology. 2003;98:404–11. doi: 10.1097/00000542-200302000-00021. [DOI] [PubMed] [Google Scholar]


