Abstract
Introduction
To advance the science and clinical application of stem cell therapy, the availability of a highly sensitive, quantitative, and translational method for tracking stem cells would be invaluable. Because hematopoetic stem cells express high levels of the cytosolic enzyme aldehyde dehydrogenase-1A1 (ALDH1), we sought to develop an agent that is specific to ALDH1 and thus to cells expressing the enzyme. Such an agent might be also helpful in identifying tumors that are resistant to cyclophosphomide chemotherapy because ALDH1 is known to be responsible for this resistance.
Methods
We developed schemes for the synthesis of two 3radioiodinated aldehdyes—N-formylmethyl-5-[*I]iodopyridine-3-carboxamide ([*I]FMIC) and 4-diethylamino-3-[*I]iodobenzaldehyde ([*I]DEIBA)—at no-carrier-added levels from their respective tin precursors. These agents were evaluated using pure ALDH1 and tumor cells that expressed the enzyme.
Results
The average radiochemical yields for the synthesis [125I]FMIC and [125I]DEIBA were 70 ± 5% and 47 ± 14%, respectively. ALDH1 converted both compounds to respective acids suggesting their suitability as ALDH1 imaging agents. Although ability of ALDH1 within the cells to oxidize one of these substrates was shown, specific uptake in ALDH-expressing tumor cells could not be demonstrated.
Conclusion
To pursue this approach for ALDH1 imaging, radiolabeled aldehydes need to be designed such that, in addition to being good substrates for ALDH1, the cognate products should be sufficiently polar so as to be retained within the cells.
Keywords: Stem cells, Aldehyde dehydrogenase, Imaging
1. Introduction
The potential of tissue regenerative therapy based on stem cell transplantation has been demonstrated for a number of ailments including heart disease [4], neurodegenerative disorders such as Parkinson’s disease [32] and Alzheimer’s dementia [21], ophthalmologic disorders [16], and diabetes [26] among others [7, 17, 19]. It is known that factors such as SDF-1/CXCR4 [22] and BMP receptor type IA [33] govern stem cell migration, adhesion and engraftment; however, the in vivo integration of the transplanted stem cells into host parenchyma has been difficult to assess because they cannot be distinguished based on their morphological properties. Quantitative methods to assess stem cell migration in vivo could be used to evaluate the effectiveness of novel therapies and could greatly facilitate our understanding of the mechanisms of stem cell homing. Fluorescent dyes and contrast agents have been developed to label stem cells [8]; however, the sensitivity and quantitative capability of these imaging techniques are limited. On the other hand, radionuclide imaging can provide a more sensitive, accurate, and quantitative alternative. In addition, radionuclide techniques have proven safety and a high translational potential for clinical use.
Two types of methods for cell labeling are currently in practice. One strategy involves labeling of cells directly using existing radiopharmaceuticals such as 111In-oxine [18], 99mTc-HMPAO [3], or [18F]FDG [9] and is performed ex vivo. Fluorescent and radioactive probes derived from Tat peptides have been described recently for the ex vivo labeling of neurospheres [25]. Alternatively, cells can be transduced with reporter genes ex vivo, and after their transplantation, the transduced cells can be identified using reporter-specific radiolabeled probes [29]. Both strategies require that the cells are first purified and then manipulated ex vivo. In addition, both methods have other significant limitations. For instance, physical decay of radionuclides will hamper monitoring the long-term fate of stem cells that have been radiolabeled ex vivo. On the other hand, the genetic manipulation associated with the reporter gene approach may introduce unintended mutagenic effects [13, 14].
Our goal is to develop radiolabeled probes that target stem cell-specific biomolecules. This strategy would make it possible to label stem cells in vivo without the necessity of an ex vivo gene transduction. Hematopoietic stem cells and progenitors express high levels of the intracellular enzyme aldehyde dehydrogenase (ALDH1) [12, 15, 20, 24, 27] and this fact has been exploited to design fluorescent aldehyde probes to identify and purify these cells [15, 28]. These lipophilic aldehydes freely enter cells but become trapped within the cells when they are converted to polar acids by ALDH1. We hypothesized that radiolabeled aldehydes containing a tertiary amine functionality will be similarly trapped. Such agents would be potentially useful for imaging cells that express high levels of ALDH1, an established stem cell biomarker.
Two agents were selected for targeting ALDH1—N-formylmethyl-5-[*I]iodopyridine-3-carboxamide ([*I]FMIC) and 4-diethylamino-3-[*I]iodobenzaldehyde ([*I]DEIBA) — that could be labeled with 123I and 124I for SPECT and PET imaging, respectively. Earlier, our group developed N-succinimidyl 5-[*I]iodo-pyridine-3-carboxylate ([*I]SIPC), a pyridine-containing prosthetic group for the radiohalogenation of monoclonal antibodies [11]. Both SIPC and its tin precursor were readily available to us and hence we designed a scheme for the synthesis of [*I]FMIC from these. This molecule has the tertiary amine in the pyridine ring and, on oxidation by ALDH1, would be expected to form a polar amino acid. The compound 4-(N,N-diethylamino)benaldehyde (DEAB) is routinely used as an inhibitor of ALDH1 [5] and we envisaged that an iodinated derivative also would be an ALDH1 inhibitor, and thus has potential as an agent for imaging the enzyme. In the present study, we have described methods for the synthesis of these two novel agents at a no-carrier-added level and evaluated the potential of these compounds as ALDH1 imaging agents in vitro using both the pure enzyme and cell lines that have high levels of its expression. Although our results indicate that both compounds are substrates for the pure enzyme, they were not able to distinguish cells with high and low ALDH1 expression.
2. Materials and Methods
2.1. General
All chemicals were purchased from Sigma-Aldrich unless otherwise specified. Sodium [125I]iodide (2200 Ci/mmol) and sodium [131I]iodide (1200 Ci/mmol), as solutions in 0.1N NaOH, were procured from Perkin Elmer Life and Analytical Sciences (Boston, MA). Aldehyde dehydrogenase (potassium-activated from Baker’s yeast) and ∃-nicotinamide adenine dinucleotide (NAD) were obtained from Sigma-Aldrich. N-succinimidyl 5-(tri-n-butylstannyl)pyridine-3-carboxylate (STPC) and N-succinimidyl 5-iodopyridine-3-carboxylate (SIPC) were synthesized following literature methods [10]. The compound 2-(5-iodopyridine-3-carboxamido)acetic acid (3) was synthesized as reported before [30].
Aluminum-backed sheets (Silica gel 60 F254) were used for analytical TLC, and normal-phase column chromatography was performed using silica gel 60 (both obtained from EM Science, Gibbstown, NJ). Preparative thick-layer chromatography was performed using 20 × 20 cm, 1000 :m plates (Whatman, Clifton, NJ). High-pressure liquid chromatography (HPLC) was performed using three different systems: a) Beckman Gold HPLC system equipped with a Model 126 programmable solvent module, a Model 166 NM variable wavelength detector, a Model 170 radioisotope detector and a Beckman System Gold remote interface module SS420X, using 32 Karat® software; b) Beckman Gold HPLC system equipped with a Model 126 programmable solvent module, a Model 168 diode array detector, and Beckman System Gold remote interface module SS420X, using 32 Karat® software. Radioactivity was detected using an IN/US (-RAM radioactivity detector and Laura Lite® software (IN/US Systems, Tampa, FL); this system has the capability to detect two isotopes simultaneously; and c) Waters Model Delta 600 semi-preparative system with a Model 600 controller and a Model 2487 dual wavelength absorbance detector; data were acquired using Millenium software. Reversed-phase HPLC was performed using a 4.6 × 250-mm XTerra RP18 (5 :m) column and 19 × 50-mm XTerra RP18 (7 :m) column (Waters, Milford, MA) for analytical and semi-preparative runs, respectively. Radio-TLC was analyzed initially using a System 200 Imaging Scanner (BioScan, Washington, DC), and then the sheets were cut into strips and counted using an automated gamma counter (LKB 1282, Wallac, Finland). Proton NMR spectra of samples dissolved in CDCl3 were obtained on a Varian Mercury 300 spectrometer. Chemical shifts are reported in δ units using the residual CHCl3 peak as a reference. Low resolution mass spectra were obtained on a JEOL SX-102 high-resolution mass spectrometer (FAB, EI, and GC-MS) or on an Agilent 1100 LC/MSD Trap SL (electrospray). High-resolution mass spectra were obtained using a JEOL SX-102 high-resolution mass spectrometer.
2.2. Cells and culture conditions
K562 human leukemia cells were obtained from the American Type Culture Collection (ATCC; Manassas, VA) and cultured in RPMI 1640 containing 10% FCS and 1% l-glutamine. L1210 mouse lymphocytic leukemia cells were also received from the ATCC while the L1210cpa cells were generously provided by Dr. John Hilton at the Johns Hopkins University. Both cell lines were maintained in RPMI 1640 medium (GIBCO, Invitrogen Life Science, Carlsbad, CA) supplemented with 10% fetal calf serum (Hyclone, Logan, UT) and 5 micromolar 2-mercaptoethanol (Sigma-Aldrich, St. Louis, MO).
2.3. Synthesis of standards and precursors
2.3.1. N-(2,2-diethoxyethyl)-5-iodopyridine-3-carboxamide(1)
Aminoacetaldehyde diethyl acetal (55 mg; 0.4 mmol) was added drop wise to a solution of SIPC (65.8 mg; 0.19 mmol) in 1 ml of THF. A thick precipitate was formed within minutes. Additional THF (1 ml) was added to enhance the stirring which was done at 20°C for 1–2 h. TLC (20% ethyl acetate in DCM) indicated complete consumption of SIPC (Rf = 0.36) and the appearance of a new product (Rf = 0.15). The precipitate was filtered and washed with ethyl acetate. The concentrated filtrate was applied to 4 preparative TLC plates and developed using 20% ethyl acetate in DCM. The major band corresponding to 1 was isolated to obtain 66.7 mg (0.18 mmol; 96%) of pale yellow solid: 1H NMR (CDCl3) 1.22 (t, 6H), 3.59 (m, 4H), 3.73 (m, 2H), 4.60 (t, 1H), 6.54 (br t, 1H), 8. 43 (m, 1H), 8.89 (m, 2H). MS (FAB+) m/z: 365 (MH+), 319. HRMS (FAB+) Calcd for C12H17IN2O3 (MH+): 365.0362. Found: 365.0366 ±0.0011 (n = 4).
2.3.2. N-(formylmethyl)-5-iodopyridine-3-carboxamide (FMIC; 2)
Trifluoroacetic acid (164 :l) was added to 1 (36.4 mg; 0.1 mmol) and the mixture was incubated at 20°C for 1 h. Trifluoroacetic acid was evaporated with a stream of argon and to the residue was added ~0.2 ml of chloroform. The vial was vortexed to mix the contents and chloroform was evaporated. This process was repeated one more time and the residue was subjected to preparative TLC using ethyl acetate to isolate 10.8 mg of 1 and 8.5 mg of 2 (0.02 mmol; 29% based on 0.1 mmol of 1) as a solid: 1H NMR (CDCl3) 4.46 (d, 2H), 6.87 (br s, 1H), 8.47 (m, 1H), 8.97 (dd, 2H), 9.79 (s, 1H). MS (LCMS) m/z: 291 (MH+), 289 (M-H)+. HRMS (FAB+) Calcd for C8H9IN2O2 (MH+): 290.9630. Found: 290.9625 ± 0.0004 (n = 2).
2.3.3. N-(2,2-diethoxyethyl)-5-(tri-n-butylstannyl)pyridine-3-carboxamide(4)
Aminoacetaldehyde diethyl acetal (10 mg; 0.08 mmol) was added to a solution of STPC (24.9 mg; 0.05 mmol) in 1 ml of THF and the mixture stirred at 20°C for 2h. The reaction mixture was applied as such to preparative TLC plates and eluted with 40% ethyl acetate hexane. The band corresponding to 4 was isolated to obtain 18.3 mg (0.04 mmol; 71%) of an oil: 1H NMR (CDCl3) 0.88 (t, 9H), 1.12 (m, 6H), 1.24 (t, 6H), 1.32 (m, 6H), 1.52 (m, 6H), 3.60 (m, 4H), 3.74 (m, 2H), 4.63 (t, 1H), 6.41 (br t, 1H), 8.17 (s, 1H [119Sn-H, d]), 8.70 (br s, 1H), 8.84 (br s, 1H). MS (LCMS) m/z: cluster peaks around 529 (MH+).
2.3.4. 3-Bromo-4-(diethylamino)benzaldehyde(5)
The reagent LiClO4-SiO2 was prepared as follows: silica gel (8 g) was added to a solution of LiClO4 (2 g) in 30 ml of acetonitrile. The mixture was stirred at 20°C for 24 h after which acetonitrile was evaporated. The free flowing white solid was dried under high vacuum. Dry DCM (65 ml) was added to a mixture of DEAB (1.1 g; 6.2 mmol) and LiClO4-SiO2 (1.24 g). N-bromosuccinimide (1.1 g; 6.2 mmol) was added to the ensuing purple mixture, which turned blue on adding NBS. The reaction mixture was stirred at 20°C overnight and the solid materials were filtered and washed with DCM. DCM was evaporated from the filtrate and the crude residue was subjected to silica gel chromatography using 20% ethyl acetate in hexanes to obtain 456 mg (1.8 mmol; 29%) of 5 as an oil: 1H NMR (CDCl3) 1.10 (t, 6H), 3.35 (q, 4H), 7.09 (d, 1H), 7.72 (d, 1H), 8.04 (s, 1H), 9.82 (s, 1H). MS (EI+) m/z: 255 and 257 (M+), 240 and 242 (M-CH3)+, 210 and 212. HRMS (EI+) Calcd for C11H1481BrNO (M+): 257.0238. Found: 257.0238 ± 0.0008 (n = 4).
2.3.5. 2-Bromo-N,N-diethyl-4-(dimethoxymethyl)benzenamine(6)
Copper(II) tetrafluoroborate hydrate (1.1 mg; 0.005 mmol) was added to a mixture of 5 (115.4 mg; 0.45 mmol) and trimethyl orthoformate (96 mg; 0.91 mmol) in methanol (0.2 ml) and the mixture stirred at 20°C for 10 h. Methanol was evaporated and the residue partitioned between ethyl acetate and saturated sodium bicarbonate solution. The blue aqueous layer was extracted twice with ethyl acetate and the combined ethyl acetate solution was washed with brine, dried using anhydrous sodium sulfate. The drying agent was filtered off and ethyl acetate from the filtrate was evaporated and the resultant residue subjected to preparative TLC using 20% ethyl acetate in hexanes to yield 106 mg (0.35 mmol; 78%) of 6 as a clear oil: H NMR (CDCl3) 1.10 (t, 6H), 3.10 (q, 4H), 3.33 (s, 6H), 5.32 (s, 1H), 7.07 (d, 1H), 7.32 (d, 1H), 7.68 (s, 1H). MS (GCMS) m/z: 301 and 303 (M+), 286 and 288 (M-CH3)+, 270 and 272. HRMS (EI+) Calcd for C11H2081BrNO2 (M+): 303.0657. Found: 303.0667 ± 0.0005 (n = 3).
2.3.6. N,N-diethyl-2-iodo-4-(dimethoxymethyl)benzenamine(7)
Butyl lithium in hexanes (1.6 M: 0.42 ml; 0.67 mmol) was added drop wise to a solution of 6 (180 mg; 0.6 mmol) in THF (3 ml) at −78°C and the mixture stirred at −78°C for 15 min. A solution of I2 (378 mg; 1.5 mmol) in THF (2.6 ml) was added drop wise to the above and the mixture was brought up gradually to 20°C and stirred further at 20°C overnight. THF was evaporated from the mixture and the residue partitioned between ethyl acetate and water. The aqueous layer was extracted twice with ethyl acetate and the pooled ethyl acetate solution was washed with brine and dried with anhydrous sodium sulfate. Sodium sulfate was filtered off and ethyl acetate was evaporated from the filtrate. Silica gel chromatography of the crude mixture yielded 28 mg (0.08 mmol; 13%) of 7: 1H NMR (CDCl3) 1.00 (t, 6H), 3.02 (q, 4H), 3.33 (s, 6H), 5.30 (s, 1H), 7.04 (d, 1H), 7.38 (d, 1H), 7.95 (s, 1H). MS (FAB+) m/z: 349 (M+), 334 (M-CH3)+, 318. HRMS (FAB+) Calcd for C13H21INO2 (MH+): 350.0617. Found: 350.0611 ± 0.0005 (n = 3).
2.3.7. 4-(Diethylamino)-3-iodobenzaldehyde(DEAIB; 8)
The title compound was isolated as a byproduct from the synthesis of 7 (36 mg): 1H NMR (CDCl3) 1.07 (t, 6H), 3.19 (q, 4H), 7.08 (d, 1H), 7.78 (d, 1H), 8.34 (s, 1H), 9.82 (s, 1H). MS (FAB+) m/z: 304 (M+). HRMS (FAB+) Calcd for C11H15INO (MH+): 304.0198. Found: 304.0198 ± 0.0005 (n = 2).
2.3.8. 2-(Tri-n-butylstannyl)-N,N-diethyl-4-(dimethoxymethyl)benzenamine (9)
Butyl lithium in hexanes (1.6 M; 0.2 ml, 0.32 mmol) was added drop wise to a solution of 6 (88 mg, 0.29 mmol) in THF (1.5 ml) at −78°C. Dry tri-n-butyl tin chloride (ampules from Supelco) (175 mg, 0.54 mmol) was added drop wise to the above at −78°C and the mixture was gradually brought to 20°C and stirred further at that temperature overnight. THF was evaporated and the residue partitioned between ethyl acetate and water. The aqueous layer was extracted twice with ethyl acetate and the combined ethyl acetate solution was washed once with brine and dried with anhydrous sodium sulfate. The ethyl acetate from the filtrate after removing sodium sulfate was evaporated and the residue was subjected to preparative HPLC. For this, the semi-preparative column was eluted using a gradient consisting of water (solvent A) and acetonitrile (solvent B) at a flow rate of 10 ml per min — initially, the percent of solvent B was 50 and increased linearly to 100 over 50 min. The tR of 6 and 9 under these conditions was 11.8 min and 47.2 min, respectively. Fractions containing 9 were pooled and the solvent evaporated under high vacuum to yield 65 mg (0.13 mmol; 43%) of an oil: Anal. HPLC: An analytical reversed-phase column was eluted using 5% (v/v) acetonitrile in water (solvent A) and acetonitrile (solvent B) at a flow rate of 1 ml/min with a linear gradient of 0% to 100% B over 30 min, holding at 100%B for 5 min and then bringing back to the initial conditions over 5 min: tR = 38.5 min (tR of 6 under these conditions was 27.2 min). 1H NMR (CDCl3) 0.97 (m, 21H), 1.33 (m, 6H), 1.49 (m, 6H), 2.95 (q, 4H), 3.35 (s, 6H), 5.35 (s, 1H), 7.10 (d, 1H), 7.33 (d, 1H), 7.46 (s, 1H). MS (FAB+) m/z: cluster peaks at 512 (MH+), 482, 456.
2.3.9. Methyl 4-(diethylamino)-3-iodobenzoate (10)
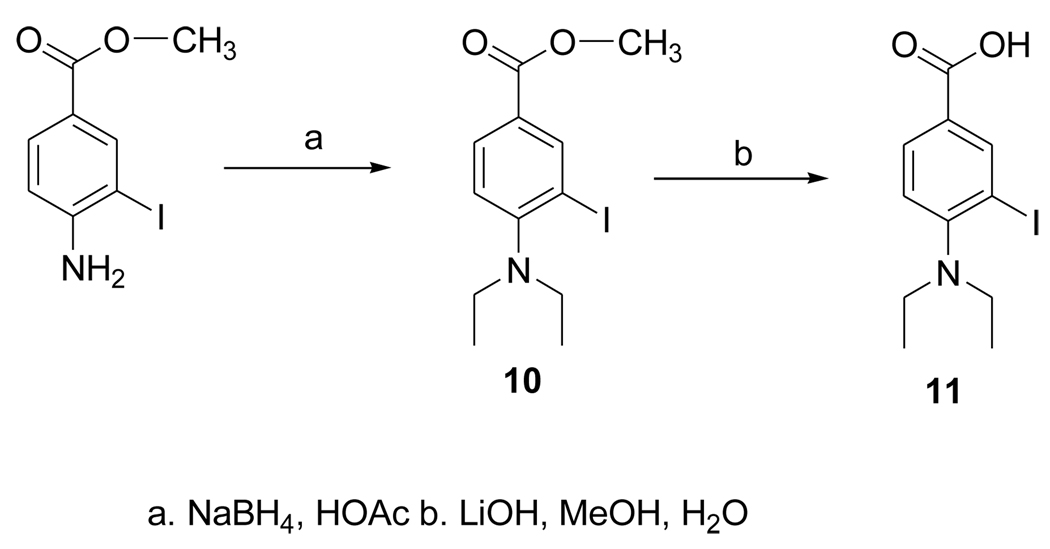
Sodium borohydride (1.02 g; 27.3 mmol) was added in portions over a period of 4 h to a solution of methyl 4-amino-3-iodobenzoate (Aldrich: 277 mg; 1mmol) in acetic acid (28 ml) and the mixture stirred at 20°C overnight. The reaction mixture was partitioned between 1N NaOH and ethyl acetate and the aqueous layer extracted twice with ethyl acetate. The combined ethyl acetate was washed once with brine and dried with anhydrous sodium sulfate. The drying agent was filtered and ethyl acetate evaporated from the filtrate. The residue was subjected to silica gel chromatography using 10% ethyl acetate in hexanes to yield 310 mg (92%) of 10. 1H NMR (CDCl3) 1.26 (t, 6H), 3.34 (q, 4H), 4. 09 (s, 3H), 7.23 (d, 1H), 8.16 (d, 1H), 8.74 (s, 1H). MS (EI+) m/z: 333 (M+), 318 (M-CH3)+. MS (EI+) Calcd for C12H16INO2 (M+): 333.0226. Found: 333.0224 ± 0.0008 (n = 4).
2.3.10. 4-Diethylamino-3-iodobenzoic acid (11)
A mixture of 10 (50 mg; 0.15 mmol), LiOH·H2O (23 mg; 0.5 mmol), water (1.7 ml) and methanol (0.2 ml) was stirred at 20°C overnight. Compound 11 was isolated from this by semi-preparative HPLC using a gradient consisting of 5% acetonitrile in water (solvent A) and acetonitrile (solvent B) at a flow rate of 10 ml per min—for the first 5 min, the solvent composition was kept at 0% B and then increased linearly to 100% B over the next 30 min. The tR of 11 under these conditions was 12.6 min. Fractions containing 11 (as its lithium salt) were pooled and the solvent evaporated under high vacuum to yield 29 mg (0.09 mmol; 60%) of 11: Anal. HPLC (conditions same as used for 9) tR = 12.3 min (lithium salt). 1H NMR (CDCl3) 0.75 (br s, 6H), 2.80 (br s, 4H), 6.60 (br s, 1H), 7.84 (br s, 1H), 8.42 (br s, 1H). MS (EI+) m/z: 304 (M-CH3+), 162. MS (FAB+) m/z: 326 (M+Li)+, 325 (M-H+Li)+, 320 (MH+), 319 M+. HRMS (EI+) Calcd for C10H11INO2 (M-CH3-H)+: 303.9834. Found: 303.9831 ± 0.0005 (n = 4).
2.4. Radiochemical syntheses
2.4.1. [125I]FMIC
A mixture of 4 (50 :g), 1–2 mCi of 125I in 1–2 :l of 0.1N NaOH, 0.2N NaOH (5 :l), and 5 :l of 1:3 (v/v) H2O2:HOAc was sonicated for 30 sec. A solution of sodium bisulfite (1 mg in 5 :l water) and 5 :l of 12 N NaOH were added to the above and the entire mixture was injected onto a reversed-phase HPLC column eluted with a gradient consisting of water (solvent A) and acetonitrile (solvent B) at a flow rate of 1 ml per min. The solvent composition was increased linearly from 0% B to 100% B in 30 min and was held at 100% for another 5 min. The HPLC fractions containing [125I]1, which eluted with a tR of 18.8 min, were pooled and most of the acetonitrile from the pooled fractions was evaporated with a stream of argon. The remnant solution was diluted with water (10 ml) and then passed through an activated Waters’ C18 Sep-Pak cartridge. The cartridge was washed with water (2 × 5 ml) and [125I]1 was eluted with 0.25 ml portions of methanol. Generally, methanol fractions 2–4 contained the predominant amount of the radioactivity and were pooled, after which the methanol was evaporated. The residual radioactivity was treated with 0.1 ml of TFA at 20°C for 10 min to convert [125I]1 to [125I]FMIC. TFA was evaporated with a stream of argon, and to insure its complete removal, 3 portions of 25 :1 methanol were added, evaporating each before the addition of next. Finally the activity was reconstituted in PBS.
2.4.2.[*I]DEAIB
A mixture of 9 (50 :g), 1–2 mCi of radioiodine in 1–2 :1 of 0.1N NaOH, 0.2N NaOH (5 :l), 5 :l of 1:3 (v/v) H2O2:HOAc was sonicated for 30 sec. Methanol (25 :l) was added and the entire mixture injected on to a reversed-phase HPLC column eluted with a gradient consisting of 5% (v/v) acetonitrile in water (solvent A) and acetonitrile (solvent B) at a flow rate of 1 ml per min. The solvent composition was increased linearly from 30% B to 100% B in 30 min and was held at 100% for another 5 min. The HPLC fractions containing [*I]7 (tR = 19 min) and [*I]DEAIB (tR = 17 min) were pooled and most of the acetonitrile from the pooled fractions was evaporated with a stream of argon. The remnant solution was diluted with water (10 ml) and then passed through an activated Waters’ C18 Sep-Pak cartridge. The cartridge was washed with water (2 × 5 ml) and the radioactivity was eluted with 0.25 ml portions of methanol. The methanol fractions containing most of the radioactivity (generally 2–4) were pooled, after which the methanol was evaporated. The residual radioactivity was treated with 0.1 ml of 75% (v/v) TFA in water at 20°C for 10 min to convert [*I]7 to [*I]DEAIB. TFA was evaporated with a stream of argon and then co-evaporated with 3 × 25 :l ethyl acetate. The residual activity was reconstituted in PBS containing 2% (v/v) HSA.
2.5. Evaluation of FMIC and DEAIB as substrates for ALDH1
2.5.1. FMIC
About 10 :Ci of [125I]FMIC was incubated with 250 mU of ALDH1 in 1 ml of 1mM EDTA, 100 mM KCl, 2.35 mM NAD, 60 mM sodium phosphate pH 8.5 for 30 min at 37°C. As controls, two parallel experiments were conducted to evaluate ALDH1 specificity; ALDH1 was omitted from the mixture or was inhibited by the addition of 4-diethylaminobenzaldehyde (DEABA; 50 :M) before incubation with [125I]FMIC. At the end of incubation the mixtures were analyzed by HPLC using the same gradient as described above for the synthesis of [125I]FMIC. The tR values of FMIC and 3 under these conditions were 12.5 min and 5.2 min, respectively.
2.5.2. DEAIB
This experiment was performed essentially the same as described for FMIC except with a different set of HPLC conditions. In addition, the incubation mixtures also were analyzed by TLC. For HPLC, the reversed-phase analytical column was eluted with a gradient consisting of 5% acetonitrile in water (solvent A) and acetonitrile (solvent B) at a flow rate of 1 ml per min. For the first 10 min, the solvent composition was kept at 0% B and then increased linearly to 100% B in 30 min. Under these conditions, the tR values of DEAIB and 11 were 35 min and 5 min, respectively. For TLC, silica gel plates were eluted with 1:9 tert-butanol:ethyl acetate. The Rf values of DEAIB and 11 under these conditions were 0.9 and 0.7, respectively.
2.6. Uptake of [125I]FMIC in K562 human leukemia cells
Cells (1 × 10⁶ per tube per ml) in RPMI 1640 medium containing 10% FCS were incubated with 100 nCi of [125I]FMIC at 37°C for 30 min, 1, 2 and 4h in quadruplicate. To determine nonspecific uptake, cells were first treated with 50 :M DEAB for 15 min before incubation with the tracer. At the end of each incubation period, the cell culture supernatants were removed, the cells were washed with fresh medium, and the cell-associated radioactivity determined by counting the cells after solubilization with NaOH.
2.7. Uptake of [125I]FMIC in ALDH1 positive (cyclophosphamide-resistant) L1210-CPA and ALDH1 negative (cyclophosphamide-sensitive) L1210 leukemia cells
This assay was performed essentially the same as that described above except that the incubation medium contained 50 :M ∃-mercaptoethanol and no parallel assay with DEAB pretreatment was done.
2.8. Uptake of [125I]DEAIB in ALDH1 positive (cyclophosphamide-resistant) L1210-CPA and ALDH1 negative (cyclophosphamide-sensitive) L1210 leukemia cells
This assay was performed following the procedure described for [125I]FMIC in the above section.
2.9. Retention of [125I]DEAIB in ALDH1 positive (cyclophosphamide-resistant) L1210-CPA and ALDH1 negative (cyclophosphamide-sensitive) L1210 leukemia cells
Both cell lines were allowed to take up the tracer over a period of 2 h as described above. Cell culture supernatants containing unbound radioactivity were removed and the cells were washed with fresh medium. Finally, the cells were supplemented with fresh medium and the cell-associated radioactivity was determined at 0, 1, 2, 4, 8, and 24 h.
2.10. Stability of [125I]DEAIB in tissue culture medium
About 10 :Ci of [125I]DEAIB was incubated at 37°C in 300 :l of RPMI 1640 medium without serum but containing 50 :M ∃-mercaptoethanol. Reversed-phase HPLC of aliquots (~2 :Ci) was performed at the beginning of the incubation and at 1, 2, and 4h thereafter. The HPLC conditions were the same as that used for the ALDH1 assay (see section 2.5.2.).
2.11. Internalization assay and metabolite analysis of [125I]DEAIB
Cells (each L1210 and L1210-CPA; 1 × 10⁶ per tube per ml) was incubated as described above with either 1 :Ci or 5 :Ci of [125I]DEAIB for 4 h. At the end of incubation, cell culture supernatant was removed and the cells were washed once with the incubation medium. To determine the surface-bound radioactivity, cells were incubated for 5 min with pH 2 medium and radioactivity in this medium was counted. Cells were washed and counted to determine internalized radioactivity. Cells from the 5 :Ci assay were lysed by treatment with 0.5% NP 40 in PBS and cell debris was removed by centrifugation. Cell lysate, acidic medium containing surface-bound radioactivity, and cell culture supernatants were analyzed using TLC along with unlabeled standards of DEAIB and the acid 11 using conditions described in section 2.5.2. TLC plates were cut into 8 strips and counted for radioactivity.
3. Results
3.1. Chemical and radiochemical syntheses
3.1.1. FMIC standard and precursor
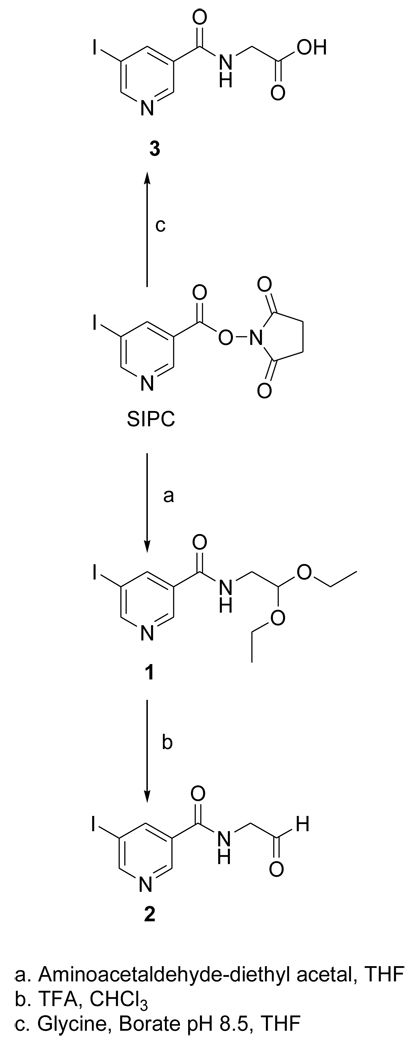
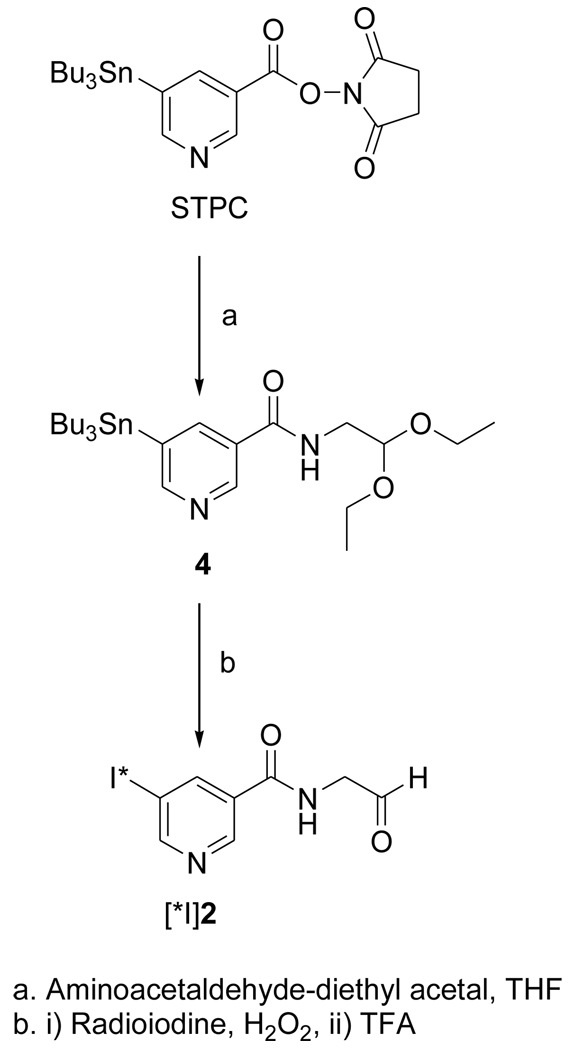
The acetal 1 was obtained in 96% yield by the treatment of the known compound SIPC [10] with aminoacetaldehyde-diethyl acetal; its deprotection with TFA treatment yielded the target FMIC (2) in 29% isolated yield (Fig. 1). The tin precursor 4 was synthesized from the active ester STPC in 79% yield by a protocol similar to that used for the synthesis of 1 (Fig. 2). The NMR and mass spectral characteristics of these compounds were consistent with their structures.
Figure 1.
Scheme for the synthesis of the unlabeled standard of FMIC and its oxidation product 3.
Figure 2.
Scheme for the synthesis of n.c.a. [*I]FMIC from a tin precursor
3.1.2. DEAIB standard and precursor
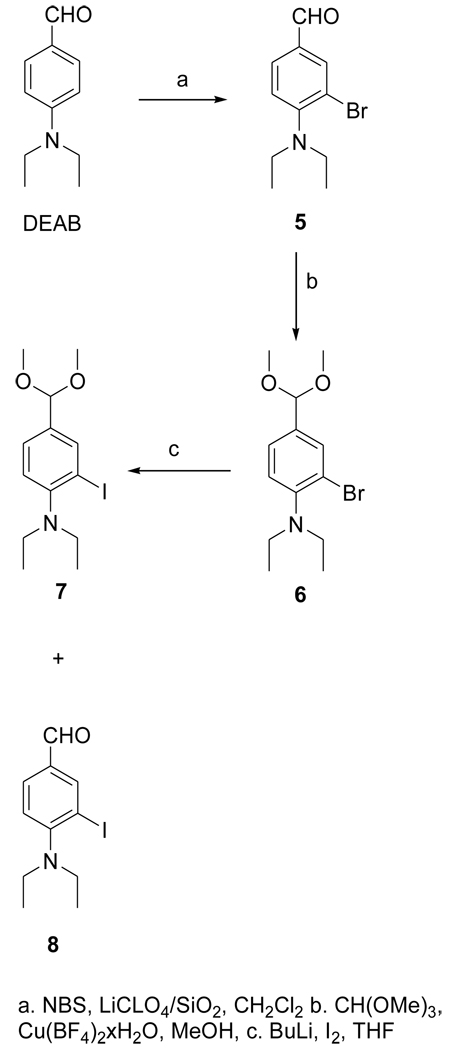
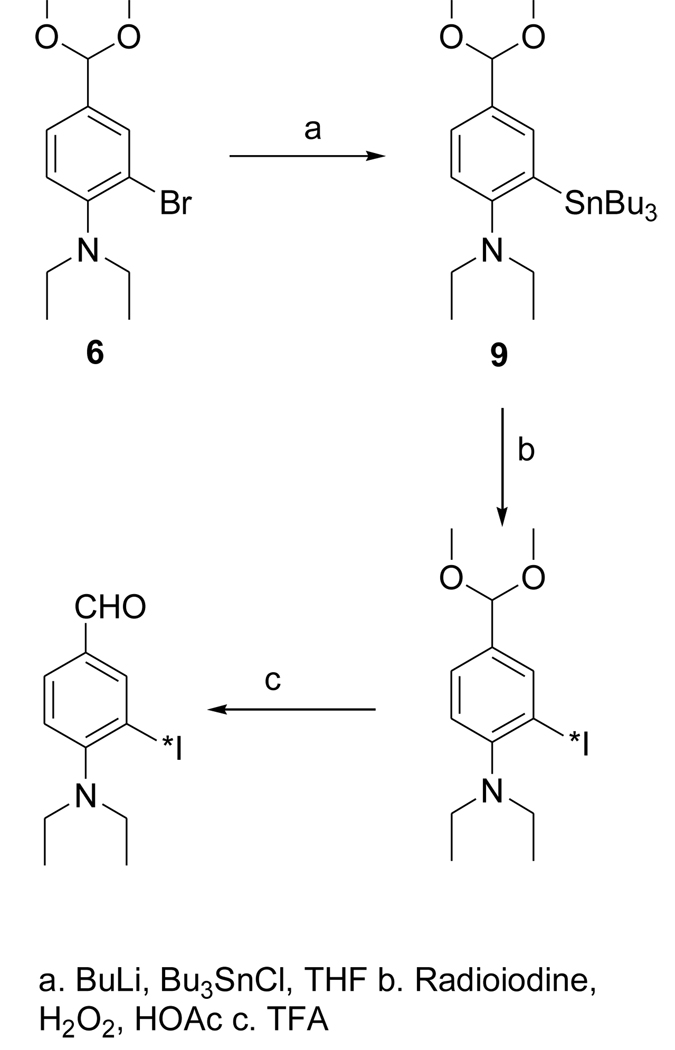
The dimethyl acetal 6 was obtained from the known compound 5 in 78% yield (Fig. 3). The iodo derivative 7 was obtained from 6 via a lithium intermediate in 13% isolated yield. The target compound DEAIB (8) was obtained as a byproduct during the conversion of 6 to 7. The tin precursor 9 was obtained from 6 using BuLi chemistry in a yield of 43% (Fig. 4). The acid 11 was obtained from commercially available methyl 4-amino-3-iodobenzoate (MAIB) in two steps (Fig. 5). Reductive alkylation of MAIB gave its diethyl derivative 10 in near quantitative yields. Hydrolysis of 10 rendered 11 in 60% isolated yields. The NMR and mass spectral characteristics of all of these compounds were consistent with their structure.
Figure 3.
Scheme for the synthesis of the unlabeled standard of 4-(N, N-diethylamino)-3-iodobenzaldehyde (DEAIBA) and its dimethyl acetal.
Figure 4.
Scheme for the synthesis of radioiodinated DEAIBA from a tin precursor.
Figure 5.
Scheme for the synthesis of 4-(N, N-diethylamino)-3-iodobenzoic acid.
3.1.3. [125I]FMIC and [125I]DEAIB
Radioiodination of tin precursor 4 yielded the acetal intermediate [125I]1 in 70 ± 5% (n = 3) radiochemical yield. Deprotection of [125I]1 to [125I]FMIC was achieved in almost quantitative yield. When analyzed by HPLC, and TLC (100% ethyl acetate) it co-eluted with unlabeled FMIC. Although the radioactivity detector HPLC profile of the reaction mixture from the synthesis of [*I]DEAIB typically contained of several peaks, the major peaks were those corresponding to the acetal and the final aldehyde. The average radiochemical yields for these two combined was 47 ± 14%. Concentration of the HPLC fractions containing these two components by solid-phase extraction, and TFA treatment of the residual radioactivity yielded the final product in more than 95% radiochemical purity.
3.2. [125I]FMIC and [125I]DEAIB are substrates for ALDH1
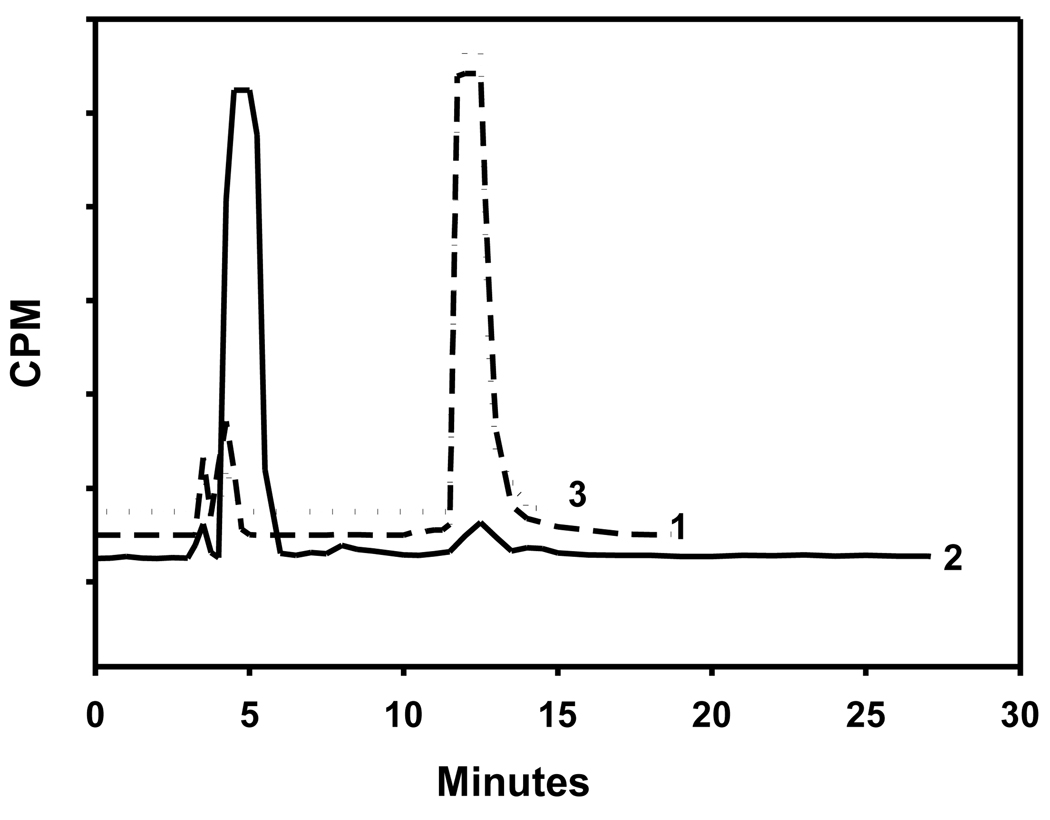
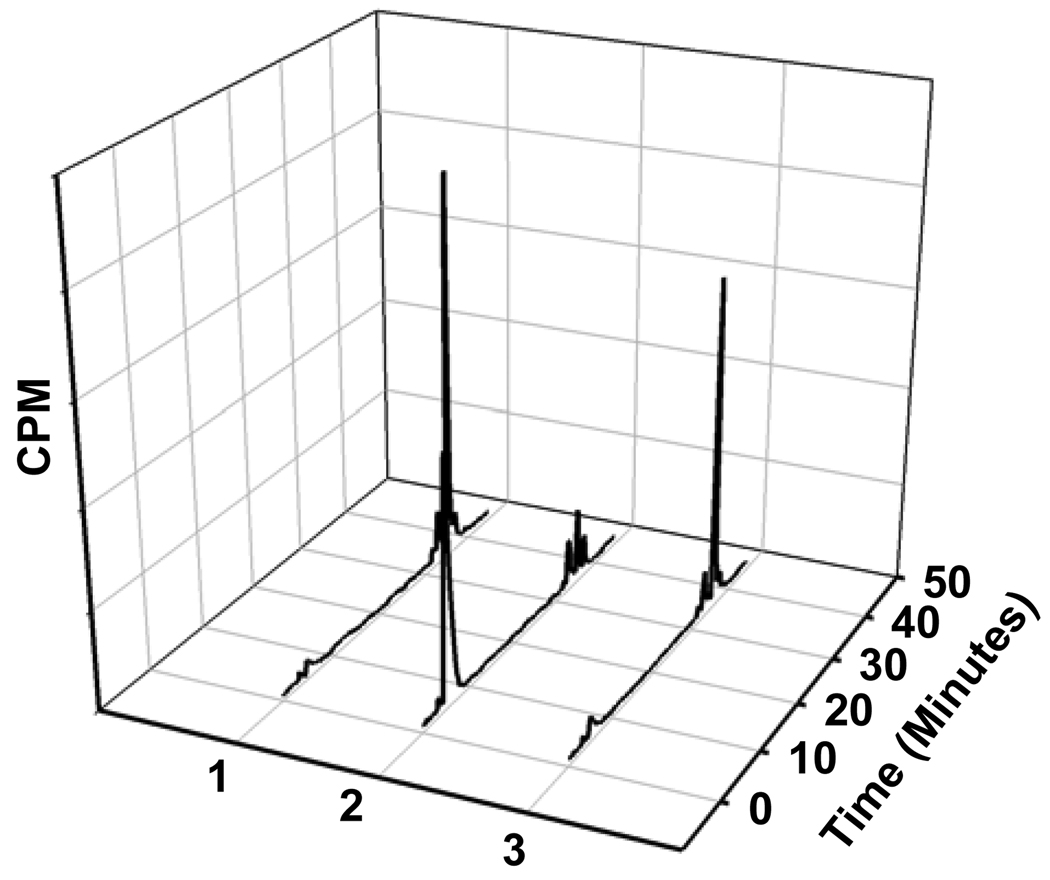
Before determining the ability of cells rich in ALDH1 to take up [125I]FMIC, the suitability of this compound as an ALDH1 substrate was evaluated. As shown in Fig. 6 (trace 2), HPLC of [125I]FMIC incubated with ALDH1 and the co-factor indicated the complete conversion of [125I]FMIC to the acid [125I]3. Control experiments were conducted to determine whether this conversion was indeed ALDH1-dependent. In one experiment, ALDH1 was omitted and in another ALDH1 was first treated with a large excess of DEAB before adding [125I]FMIC. In both these cases, [125I]FMIC remained practically unaffected. These results demonstrated that [125I]FMIC is a substrate for ALDH1. As shown in Fig. 7, ALDH1 assay results with [125I]DEAIB demonstrated that ALDH1 converted this compound to the corresponding acid, demonstrating that it is a substrate for the enzyme.
Figure 6.
Radio HPLC profiles of 1) [125I]FMIC (Control), 2) [125I]FMIC incubated with ALDH1 and NAD, and 3) [125I]FMIC incubated with ALDH1 that was pretreated with DEAB. [125I]FMIC and [125I]3 had a retention times of ~13 min and ~5 min, respectively. Note that FMIC was converted to 3 only under conditions 2.
Figure 7.
HPLC profiles of ALDH assay mixtures: 1) Control experiment without added enzyme or co-factor 2) [125I]DEIBA incubated with ALDH and NAD 3) [125I]DEIBA added after the enzyme was treated with DEBA
3.3. Uptake of [125I]FMIC in ALDH1-expressing K562 and L1210-CPA cells
The percent of input counts that was cell-associated was 1.27 ± 0.02 at 30 min of incubation in the case of K562 cells. Prior treatment of cells with the ALDH1 inhibitor DEAB did not block this uptake but in fact increased it albeit to a smaller degree (1.40 ± 0.02% of input dose). Also, prolonging the time of incubation (up to 4 h) did not increase the uptake. The uptake of [125I]FMIC was also determined in L1210-CPA cells as a function of time comparing it with ALDH1 non-expressing control L1210 line. The uptake was about 1% of the input dose in both cell lines and there was no temporal effect on the uptake. These results indicate that although [125I]FMIC is a substrate for ALDH1, it is not a tracer that can differentiate cells with and without ALDH1.
3.4. Uptake of [125I]DEAIB in L1210 and L1210-CPA cells as a function of time
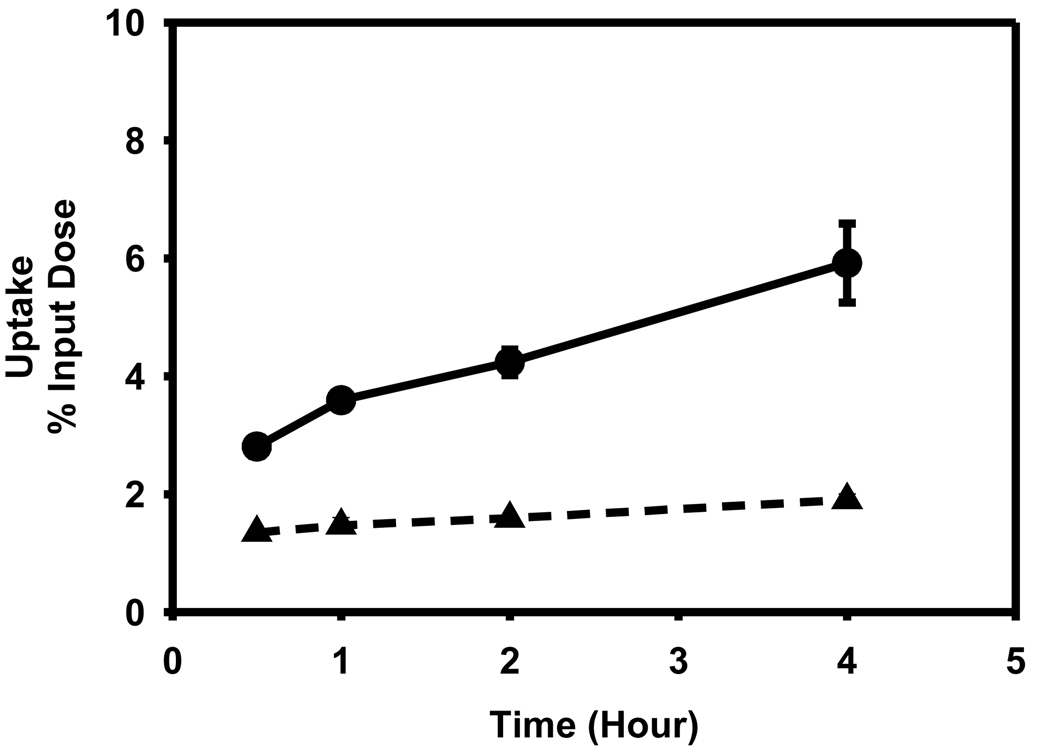
While there was a time-dependent increase in the uptake of [125I]DEAIB in both cell lines, contrary to expectations, the uptake in the cell line that has a higher degree of ALDH1 expression (L1210-CPA) was 2- to 3-fold lower (p < 0.05) than in the negative control lines L1210 (Figure 8). The percent of input counts that was cell-associated at 30 min and 4 hr for the L1210-CPA line was 1.35 ± 0.03 and 1.90 ± 0.10, respectively. On the other hand, these values for the L1210 line were 2.81 ± 0.15 and 5.92 ± 0.67.
Figure 8.
Uptake of [125I]DEIBA by L1210 (filled circle) and L1210-CPA cells (filled triangle) as a function of time. Cells were incubated with the tracer for indicated time periods and the cell-associated activity determined as described in the text.
3.5. Retention of [125I]DEAIB in L1210 and L1210-CPA cells as a function of time
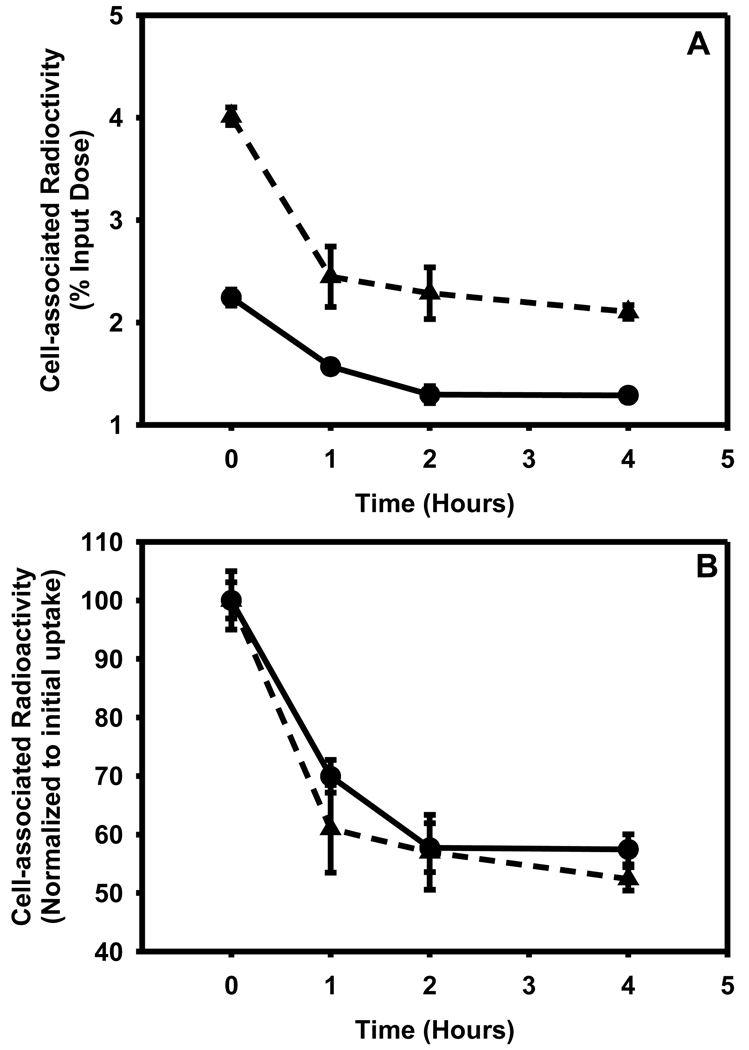
After allowing the cells to take up the tracer for a period of 2h, the retention of radioactivity in the cells was measured over a period of 4 h. As shown in Figure 9A, in both cell lines the initial cell-associated radioactivity was reduced to about half by 4 h. When the data were re-plotted after normalization to the initial uptake values (Figure 9B), the cyclophosphamide-resistant cells seemed to retain the tracer to a slightly higher degree; however, the difference was not statistically significant.
Figure 9.
Ability of L1210 (filled triangle) and L1210-CPA (filled circle) cells to retain [125I]DEAIBA as a function of time. Cells were allowed to take the up the tracer for a period of 2h and medium containing free tracer was removed. The washed cells were supplemented with fresh medium and cell-associated radioactivity determined at various time periods. A) Absolute values expressed as percent of input radioactivity B) Values normalized to initial uptake values.
3.6. Stability of [125I]DEAIB in tissue culture medium
To determine the stability of [125I]DEAIB under these tissue culture conditions, HPLC analysis of the tracer after incubation in tissue culture medium at 37°C was performed periodically over 4 h. Only one radioactive peak corresponding to intact DEAIB was seen at all the time points, suggesting that [125I]DEAIB was stable to conditions under which the cell culture experiments were done.
3.7. Internalization and metabolism
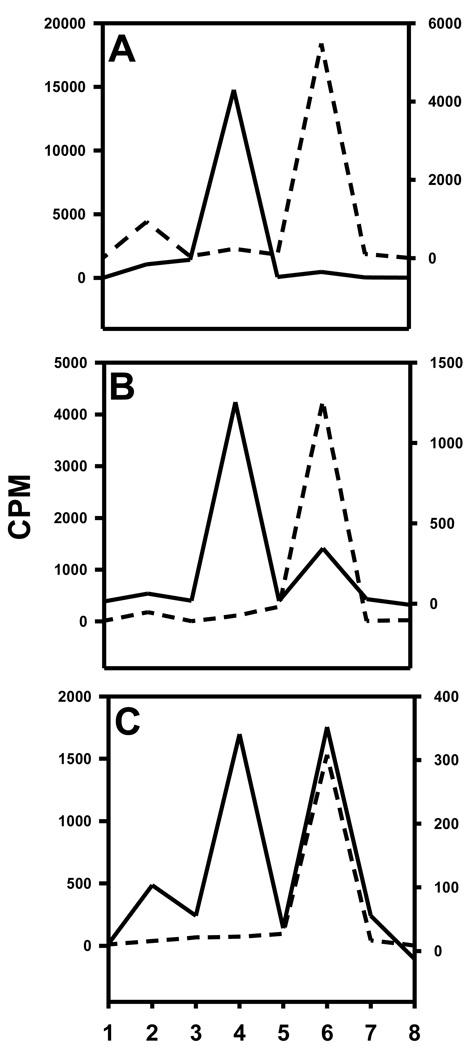
Of the total cell-bound radioactivity, 18.0 ± 11.7% and 33.7 ± 6.2% was membrane-bound for L1210 and L1210-CPA, respectively, the remainder being internalized. Typical TLC profiles of cell culture supernatants, surface-bound radioactivity and cells lysates from the two cell lines are depicted in Figure 10. From all experiments, the cell culture supernatants from the ALDH1-positive cell line had only one major radioactive species which co-eluted with the acid 11. Although, as shown in Figure 10, in one experiment the cell culture supernatants from ALDH1-negative cell line contained predominantly [125I]DEAIB, results from the other two experiments indicated the presence of substantial amounts of acid as well. Predominant species in the surface-bound radioactivity was 11 for the positive cell line and [125I]DEAIB for the negative cell line. Presence of both acid 11 and [125I]DEAIB was seen in the internalized radioactivity in the positive cells; on the other hand, in most cases, [125I]DEAIB was the predominant species that was present intracellularly in the negative cells.
Figure 10.
TLC profiles of cell culture supernatants (A), acid washes (surface-bound; B), and cell lysates (C). TLC was run for different components from L1210 (dashed line) and L1210-CPA (solid line) cells as described in the text. TLC plates were cut into 8 strips (1 = origin and 8 = solvent front) and counted for radioactivity. DEAIB is in strip 4 and acid 11 is in strip 6.
4. Discussion
Our motivation for embarking on this project was two fold — in addition to its potential as a stem cell marker, a suitable radiotracer for the in vivo identification of ALDH1 might also be useful for discerning drug-sensitive and drug-resistant phenotypes of cancers that are treated with cyclophosphamide. It is well established that overexpression of ALDH1, among other genes, confers resistance in the treatment of tumors with cyclophosphamide [1, 23]. Cyclophosphamide, while itself not very cytotoxic, is converted to phospharamide mustard and acrolein via a cascade of enzymatic steps [6]. ALDH1 bestows resistance to the toxic effects of this drug by preventing the formation of these active components from the key intermediate aldophosphamide, an aldehyde, via its oxidation to polar carboxyphosphamide.
We designed the two tracers described herein based on the fact that, like Aldefluor® and dansylaminoacetaldehyde, they could be trapped within the cells once they were converted to their respective polar acids by ALDH1. The ready availability of key precursors SIPC and STPC led us to conceive the design of the FMIC molecule. A standard of FMIC was derived from SIPC via the acetal intermediate and the aldehyde-protected tin precursor was likewise synthesized from STPC in reasonable yields and their identity determined by NMR and mass spectrometry. The acetal tin precursor was radiodinated and then deprotected to render the labeled FMIC at a no-carrier-added level in good radiochemical yields and purity. The synthesis of the acid 3, the expected product of oxidation of FMIC by ALDH1, has been reported earlier [30].
The design of DEAIB was based on the simple notion that the introduction of an iodine in the most commonly used ALDH1 inhibitor DEABA would not annul its specificity for this enzyme. The synthesis of 3-bromo-4-diethylaminobenzaldehye by the electrophilic bromination of DEABA using NBS and catalyzed by LiClO4 has been reported [2]. Attempts to synthesize the iodo analogue by substituting NIS for NBS were futile; NMR and mass spectral data indicated that the major product formed from this reaction was the de-ethylated secondary amine, 4-ethylamino-3-iodobenzaldehyde. A plausible explanation is that its formation reflects the removal of the ethyl group as acetaldehyde from N-iodinated intermediate. While the formation of the corresponding byproduct was also observed with NBS as the reagent, the expected product 5 was formed, albeit in a lower yield than reported. This bromo derivative was converted to DEAIB by first protection of the aldehyde function as an acetal, halogen exchange via the lithio intermediate, and finally, the removal of the acetal protecting group. The tin precursor 9, also obtained via the lithio intermediate, was radioiodinated to yield a mixture mainly consisted of [*I]DEAIB and its acetal [*I]7. Deprotection of the combined products delivered [*I]DEAIB at a no-carrier-added level in reasonable radiochemical yields and excellent radiochemical purity. Oxidation of DEAIB under a variety of conditions did not render the acid 11; only intractable mixtures resulted. However, reductive alkylation of commercially available methyl 4-amino-3-iodobenzoate using conditions reported for other compounds [31] yielded the ester 10 in excellent yields and hydrolysis of this intermediate delivered the acid 11.
The first step in evaluating the potential utility of [*I]FMIC and [*I]DEAIB as ALDH1 imaging agent was to determine whether these compounds could be converted to the respective acids by the enzyme. In the presence of ALDH1 and the necessary co-factor NAD, nearly quantitative oxidation of [125I]FMIC and [125I]DEAIB was achieved; however, when the enzyme was absent or was blocked by excess DEABA, the tracers remained unaffected, demonstrating that these two labeled molecules are indeed recognized by ALDH1. The uptake of FMIC was determined in two ALDH1 positive cell lines—K 562 human leukemia and L1210-CPA cells and a control cell line L1210. That K562 and L1210-CPA cells express ALDH1 has been demonstrated by flow cytometric analysis [28]. Disappointingly however, neither compound demonstrated specific uptake in cells overexpressing ALDH1. The uptake of [125I]FMIC in all three cell lines was about 1% of input radioactivity and this uptake was not blocked by DEABA. The uptake of [125I]DEAIB was determined only in the L1210-CPA and L1210 lines. While the uptake in both cell lines increased in a time-dependent fashion, contrary to expectations, the uptake was considerably higher in the negative cell line L1210. Positing that the uptake may be driven by transport mechanism or by passive diffusion and thus may not be an indicator of ALDH1 levels, the washout of [125I]DEAIB from ALDH1 positive and negative L1210 cells was evaluated. Our hypothesis was that [125I]DEAIB would be converted to the polar amino acid ([125I]11) in ALDH1 rich, but not in ALDH1 negative, cells and thus would be retained to a higher degree. Although the normalized data (Fig. 9B) indicated a higher degree of retention of [125I]DEAIB by cyclophosphamide-resistant cells, the differences were not statistically significant. Finally, to investigate whether the unexpected results could be due to the oxidation of aldehyde before it was taken up by the cells, the stability of [125I]DEAIB under the tissue culture conditions was determined. However, this is not the case because [125I]DEAIB was found to be very stable under these conditions.
Another possibility is that although these aldehydes are converted to the respective acids by ALDH1 in the cells, the acids may not be sufficiently polar at intracellular pH to be retained efficiently within the cells. We have not determined the pKa or logP values of FMIC and DEAIB or their corresponding acids; however, the logP values, estimated by ChemDraw software, are 0.46 and 3.91 for compounds 3 and 11, respectively. In comparison, a logP value of 1.56 is estimated for dansylglycine, the oxidized product of dansyl amino acetaldehyde, which has been used to assess cellular ALDH1 [15]. Thus, while 11 may not be polar enough to be efficiently retained within cells, 3 is certainly more polar than dansylglycine. Experiments were performed to investigate whether ALDH1 within the L1210-CPA cells converts [125I]DEAIB to 11 and if so, the so formed 11 is retained within the cells. In both cell lines, the major portion of the cell-associated radioactivity was in the intracellular compartments. The ALDH1-positive cell line did indeed oxidize [125I]DEAIB at considerably higher levels than did the negative cells. However, the radioactivity species that was present in the cell culture supernatant from the positive cells was found to be exclusively the acid [125I]11. Thus, in concordance with our hypothesis, although the ALDH1 within the L1210-CPA cells oxidized [125I]DEAIB, as we speculated above, the resultant [125I]11 is too lipophilic to prevent its exocytosis.
In conclusion, two novel radiotracers were synthesized and shown to undergo conversion from aldehyde to acid by the enzyme ALDH1. Unfortunately, the uptake of these compounds in cells as a consequence of the presence or absence of ALDH1 could not be demonstrated, precluding their use as imaging agents for assessing this enzyme. This seems to be not due to the inability of ALDH1 within the cells to convert the aldehydes to the respective acids, as demonstrated in the case of [125I]DEAIB, but rather due to the insufficient polarity of the acid products. Substrates, whose acid products are sufficiently polar to arrest their exocytosis, have to be designed in order to pursue this approach for ALDH1 imaging.
Acknowledgements
This work was supported by Grants BC073244 from US Department of Defense Breast Cancer Research (B.B.C. and G.V.), P30 CA14236-34 from Duke University Cancer Center Pilot Project Grant supported by Kislak-Fields Family Fund (sub-award to B.B.C. and G.V.), and CA093371 (GV) and CA42324 (MZ) from National Institutes of Health. The authors want to thank Phil Welsh for his excellent technical support.
Footnotes
Publisher's Disclaimer: This is a PDF file of an unedited manuscript that has been accepted for publication. As a service to our customers we are providing this early version of the manuscript. The manuscript will undergo copyediting, typesetting, and review of the resulting proof before it is published in its final citable form. Please note that during the production process errors may be discovered which could affect the content, and all legal disclaimers that apply to the journal pertain.
References
- 1.Bacolod MD, Lin SM, Johnson SP, Bullock NS, Colvin M, Bigner DD, et al. The gene expression profiles of medulloblastoma cell lines resistant to preactivated cyclophosphamide. Curr Cancer Drug Targets. 2008;8:172–179. doi: 10.2174/156800908784293631. [DOI] [PMC free article] [PubMed] [Google Scholar]
- 2.Bagheri M, Azizi N, Saidi M. An intriguing effect of lithium perchlorate dispersed on silica gel in the bromination of aromatic compounds by N-bromosuccinimide. Canadian Journal of Chemistry-Revue Canadienne De Chimie. 2005;83:146–149. [Google Scholar]
- 3.Barbash IM, Chouraqui P, Baron J, Feinberg MS, Etzion S, Tessone A, et al. Systemic delivery of bone marrow-derived mesenchymal stem cells to the infarcted myocardium: feasibility, cell migration, and body distribution. Circulation. 2003;108:863–868. doi: 10.1161/01.CIR.0000084828.50310.6A. [DOI] [PubMed] [Google Scholar]
- 4.Charwat S, Gyongyosi M, Lang I, Graf S, Beran G, Hemetsberger R, et al. Role of adult bone marrow stem cells in the repair of ischemic myocardium: Current state of the art. Exp Hematol. 2008 doi: 10.1016/j.exphem.2008.01.005. [DOI] [PubMed] [Google Scholar]
- 5.Chute JP, Muramoto GG, Whitesides J, Colvin M, Safi R, Chao NJ, et al. Inhibition of aldehyde dehydrogenase and retinoid signaling induces the expansion of human hematopoietic stem cells. Proc Natl Acad Sci U S A. 2006;103:11707–11712. doi: 10.1073/pnas.0603806103. [DOI] [PMC free article] [PubMed] [Google Scholar]
- 6.Colvin OM. Alkylating agents and platinum antitumor compounds. In: Kufe DW, Pollock RE, Weichselbaum RR, Bast RC Jr, Holland JF, Frei E III, Hong WK, Hait WN, editors. Cancer Medicine. Philadelphia, PA: BC Dekker; 2005. [Google Scholar]
- 7.Corsten MF, Shah K. Therapeutic stem-cells for cancer treatment: hopes and hurdles in tactical warfare. Lancet Oncol. 2008;9:376–384. doi: 10.1016/S1470-2045(08)70099-8. [DOI] [PubMed] [Google Scholar]
- 8.Daldrup-Link HE, Rudelius M, Metz S, Piontek G, Pichler B, Settles M, et al. Cell tracking with gadophrin-2: a bifunctional contrast agent for MR imaging, optical imaging, and fluorescence microscopy. Eur J Nucl Med Mol Imaging. 2004;31:1312–1321. doi: 10.1007/s00259-004-1484-2. [DOI] [PubMed] [Google Scholar]
- 9.Doyle B, Kemp BJ, Chareonthaitawee P, Reed C, Schmeckpeper J, Sorajja P, et al. Dynamic tracking during intracoronary injection of 18F–FDG-labeled progenitor cell therapy for acute myocardial infarction. J Nucl Med. 2007;48:1708–1714. doi: 10.2967/jnumed.107.042838. [DOI] [PubMed] [Google Scholar]
- 10.Garg S, Garg PK, Zalutsky MR. N-succinimidyl 5-(trialkylstannyl)-3-pyridinecarboxylates: a new class of reagents for protein radioiodination. Bioconjug Chem. 1991;2:50–56. doi: 10.1021/bc00007a009. [DOI] [PubMed] [Google Scholar]
- 11.Garg S, Garg PK, Zhao XG, Friedman HS, Bigner DD, Zalutsky MR. Radioiodination of a monoclonal antibody using N-succinimidyl 5-iodo-3-pyridinecarboxylate. Nucl Med Biol. 1993;20:835–842. doi: 10.1016/0969-8051(93)90149-o. [DOI] [PubMed] [Google Scholar]
- 12.Ginestier C, Hur MH, Charafe-Jauffret E, Monville F, Dutcher J, Brown M, et al. ALDH1 Is a Marker of Normal and Malignant Human Mammary Stem Cells and a Predictor of Poor Clinical Outcome. Cell Stem Cell. 2007;1:555–567. doi: 10.1016/j.stem.2007.08.014. [DOI] [PMC free article] [PubMed] [Google Scholar]
- 13.Hacein-Bey-Abina S, von Kalle C, Schmidt M, Le Deist F, Wulffraat N, McIntyre E, et al. A serious adverse event after successful gene therapy for X-linked severe combined immunodeficiency. N Engl J Med. 2003;348:255–256. doi: 10.1056/NEJM200301163480314. [DOI] [PubMed] [Google Scholar]
- 14.Hacein-Bey-Abina S, Von Kalle C, Schmidt M, McCormack MP, Wulffraat N, Leboulch P, et al. LMO2-associated clonal T cell proliferation in two patients after gene therapy for SCID-X1. Science. 2003;302:415–419. doi: 10.1126/science.1088547. [DOI] [PubMed] [Google Scholar]
- 15.Jones RJ, Barber JP, Vala MS, Collector MI, Kaufmann SH, Ludeman SM, et al. Assessment of aldehyde dehydrogenase in viable cells. Blood. 1995;85:2742–2746. [PubMed] [Google Scholar]
- 16.Klassen H, Reubinoff B. Stem cells in a new light. Nat Biotechnol. 2008;26:187–188. doi: 10.1038/nbt0208-187. [DOI] [PubMed] [Google Scholar]
- 17.Kondziolka D, Wechsler L. Stroke repair with cell transplantation: neuronal cells, neuroprogenitor cells, and stem cells. Neurosurg Focus. 2008;24:E13. doi: 10.3171/FOC/2008/24/3-4/E12. [DOI] [PubMed] [Google Scholar]
- 18.Kraitchman DL, Tatsumi M, Gilson WD, Ishimori T, Kedziorek D, Walczak P, et al. Dynamic imaging of allogeneic mesenchymal stem cells trafficking to myocardial infarction. Circulation. 2005;112:1451–1461. doi: 10.1161/CIRCULATIONAHA.105.537480. [DOI] [PMC free article] [PubMed] [Google Scholar]
- 19.Krishnamurti L. Hematopoietic cell transplantation: a curative option for sickle cell disease. Pediatr Hematol Oncol. 2007;24:569–575. doi: 10.1080/08880010701640531. [DOI] [PubMed] [Google Scholar]
- 20.Liu S, Ginestier C, Charafe-Jauffret E, Foco H, Kleer CG, Merajver SD, et al. BRCA1 regulates human mammary stem/progenitor cell fate. Proc Natl Acad Sci U S A. 2008;105:1680–1685. doi: 10.1073/pnas.0711613105. [DOI] [PMC free article] [PubMed] [Google Scholar]
- 21.Marutle A, Ohmitsu M, Nilbratt M, Greig NH, Nordberg A, Sugaya K. Modulation of human neural stem cell differentiation in Alzheimer (APP23) transgenic mice by phenserine. Proc Natl Acad Sci U S A. 2007;104:12506–12511. doi: 10.1073/pnas.0705346104. [DOI] [PMC free article] [PubMed] [Google Scholar]
- 22.Mazzinghi B, Ronconi E, Lazzeri E, Sagrinati C, Ballerini L, Angelotti ML, et al. Essential but differential role for CXCR4 and CXCR7 in the therapeutic homing of human renal progenitor cells. J Exp Med. 2008;205:479–490. doi: 10.1084/jem.20071903. [DOI] [PMC free article] [PubMed] [Google Scholar]
- 23.Moreb JS, Zucali JR, Ostmark B, Benson NA. Heterogeneity of aldehyde dehydrogenase expression in lung cancer cell lines is revealed by Aldefluor flow cytometry-based assay. Cytometry B Clin Cytom. 2007;72:281–289. doi: 10.1002/cyto.b.20161. [DOI] [PubMed] [Google Scholar]
- 24.Povsic TJ, Zavodni KL, Kelly FL, Zhu S, Goldschmidt-Clermont PJ, Dong C, et al. Circulating progenitor cells can be reliably identified on the basis of aldehyde dehydrogenase activity. J Am Coll Cardiol. 2007;50:2243–2248. doi: 10.1016/j.jacc.2007.08.033. [DOI] [PubMed] [Google Scholar]
- 25.Schaffer P, Gleave JA, Lemon JA, Reid LC, Pacey LK, Farncombe TH, et al. Isostructural fluorescent and radioactive probes for monitoring neural stem and progenitor cell transplants. Nucl Med Biol. 2008;35:159–169. doi: 10.1016/j.nucmedbio.2007.11.001. [DOI] [PubMed] [Google Scholar]
- 26.Seissler J, Schott M. Generation of insulin-producing beta cells from stem cells--perspectives for cell therapy in type 1 diabetes. Horm Metab Res. 2008;40:155–161. doi: 10.1055/s-2007-1022553. [DOI] [PubMed] [Google Scholar]
- 27.Storms RW, Green PD, Safford KM, Niedzwiecki D, Cogle CR, Colvin OM, et al. Distinct hematopoietic progenitor compartments are delineated by the expression of aldehyde dehydrogenase and CD34. Blood. 2005;106:95–102. doi: 10.1182/blood-2004-09-3652. [DOI] [PMC free article] [PubMed] [Google Scholar]
- 28.Storms RW, Trujillo AP, Springer JB, Shah L, Colvin OM, Ludeman SM, et al. Isolation of primitive human hematopoietic progenitors on the basis of aldehyde dehydrogenase activity. Proc Natl Acad Sci U S A. 1999;96:9118–9123. doi: 10.1073/pnas.96.16.9118. [DOI] [PMC free article] [PubMed] [Google Scholar]
- 29.Swijnenburg RJ, van der Bogt KE, Sheikh AY, Cao F, Wu JC. Clinical hurdles for the transplantation of cardiomyocytes derived from human embryonic stem cells: role of molecular imaging. Curr Opin Biotechnol. 2007;18:38–45. doi: 10.1016/j.copbio.2006.12.003. [DOI] [PubMed] [Google Scholar]
- 30.Vaidyanathan G, Affleck DJ, Li J, Welsh P, Zalutsky MR. A polar substituent-containing acylation agent for the radioiodination of internalizing monoclonal antibodies: N-succinimidyl 4-guanidinomethyl-3-[131I]iodobenzoate ([131I]SGMIB) Bioconjug Chem. 2001;12:428–438. doi: 10.1021/bc0001490. [DOI] [PubMed] [Google Scholar]
- 31.van Oeveren A, Motamedi M, Mani NS, Marschke KB, Lopez FJ, Schrader WT, et al. Discovery of 6-N,N-bis(2,2,2-trifluoroethyl)amino- 4-trifluoromethylquinolin-2(1H)-one as a novel selective androgen receptor modulator. J Med Chem. 2006;49:6143–6146. doi: 10.1021/jm060792t. [DOI] [PubMed] [Google Scholar]
- 32.Wang Y, Chen S, Yang D, Le WD. Stem cell transplantation: a promising therapy for Parkinson's disease. J Neuroimmune Pharmacol. 2007;2:243–250. doi: 10.1007/s11481-007-9074-2. [DOI] [PubMed] [Google Scholar]
- 33.Zhang J, Niu C, Ye L, Huang H, He X, Tong WG, et al. Identification of the haematopoietic stem cell niche and control of the niche size. Nature. 2003;425:836–841. doi: 10.1038/nature02041. [DOI] [PubMed] [Google Scholar]


