

Abstract
Background:
Mild cognitive impairment (MCI) is a recently described transitional clinical state between normal aging and Alzheimer's disease (AD). With the assumption that amnestic MCI patients had pathologic changes corresponding to an early phase and probable AD patients to a later phase of the disease progression, we could approximate the temporal course of proton magnetic resonance spectroscopy (1H-MRS) alterations in AD with a cross-sectional sampling scheme.
Methods:
We compared 1H-MRS findings in the superior temporal lobe, posterior cingulate gyri and medial occipital lobe among 21 patients with MCI, 21 patients with probable AD, and 63 elderly controls. These areas are known to be involved at different neurofibrillary pathologic stages of AD.
Results:
The N-acetyl aspartate (NAA) /creatine (Cr) ratios were significantly lower in AD patients compared to both MCI and normal control subjects in the left superior temporal and the posterior cingulate volumes of interest (VOI) and there were no between-group differences in the medial occipital VOI. Myoinositol (MI) /Cr ratios measured from the posterior cingulate VOI were significantly higher in both MCI and AD patients than controls. The choline (Cho) /Cr ratios measured from the posterior cingulate VOI were higher in AD patients compared to both MCI and control subjects.
Conclusion:
These findings suggest that the initial 1H MRS change in the pathologic progression of AD is an increase in MI /Cr. A decrease in NAA /Cr and an increase in Cho /Cr develop later in the disease course.
Keywords: Magnetic resonance spectroscopy, aging, mild cognitive impairment, Alzheimer's disease
Introduction
The most common known cause of dementia in the elderly is Alzheimer's disease (AD) 1. Memory impairment is usually the earliest manifestation, and differentiating the gradual decline in memory efficiency associated with typical aging from early AD is a diagnostic difficulty 2. There is no definite biomarker for the diagnosis, which provides the motivation to develop neuroimaging markers of early AD.
Pathological involvement of the anteromedial temporal lobe early in the disease course has served as impetus for performing magnetic resonance imaging (MRI) based volume measurements that identified significant volume loss in the hippocampi even in the mild stages of the disease 3. On the other hand, positron emission tomography (PET) studies have demonstrated a reduction in glucose metabolism in the posterior cingulate gyrus and pericingular cortex in patients with early AD and asymptomatic carriers of the Apolipoprotein E (Apo E) −4 allele, indicating the presence of pre-clinical metabolic alterations 4,5. A recent study with single photon emission tomography (SPECT) showed a decline in blood perfusion in the hippocampal-amygdaloid complex, anterior thalamus and cingulate gyrus in both pre-clinical and early AD 6.
1H magnetic resonance spectroscopy (1H MRS) studies reveal a decrease in N-acetylaspartate (NAA) and an increase in myoinositol (MI) peak contents in the brains of AD patients 7-15. NAA is a neuronal marker and a decrease in its concentration suggests neuronal loss or dysfunction 16,17. The MI peak is composed primarily of myo-inositol, as well as a lesser proportion of inositol −1 phosphate and glycine18. However, the mechanism by which the disease process of AD produces an increase in MI peak contents is presently unclear 19.
The syndrome of mild cognitive impairment (MCI) has recently been recognized as a transitional state between normal aging and AD. MCI patients have a significantly higher rate (12-15 % per year) of progression to AD, compared to cognitively normal elderly persons (1-2 % per year). Clinical criteria for the diagnosis of MCI have been developed recently and these patients are the primary study group in several national trials. MCI patients have isolated memory impairment and do not meet DSM-III-R criteria for dementia 20-22. Anatomic neuroimaging studies of MCI patients have been published 23. Although, biochemical alterations have been shown in the brains of patients with age associated memory impairment 10, to our knowledge, there are no published data specifically addressing the 1H MRS findings in MCI patients.
The objectives in this study were twofold: 1) To characterize the 1H MRS findings in MCI patients compared to normally aging elderly subjects and probable AD patients. 2) To assess the temporal course of 1H MRS alterations in AD with a cross-sectional sampling scheme by positioning the 1H MRS voxels in areas of the brain which are involved at different neurofibrillary pathologic stages, and studying patient groups which represent individuals at different points along the continuum of the disease (controls, MCI and AD).
Methods
Recruitment and Characterization
All subjects were recruited from the Alzheimer's Disease Research Center (ADRC)/Alzheimer's Disease Patient Registry (ADPR) at the Mayo Clinic, Rochester MN, which are IRB approved prospective longitudinal studies of aging and dementia 24. Informed consent for participation was obtained from every subject and/or an appropriate surrogate. Individuals participating in ADRC/ADPR were evaluated by a behavioral neurologist and a neuropsychologist. Neurological examination and neuropsychological testing that included Mini-Mental State Examination (MMSE) 25, Dementia Rating Scale (DRS) 26, Welchester Adult Intelligence Scale –Revised (WAIS-R) full scale IQ, Wechsler Memory Scale -Revised (WMS -R) logical memory II and visual reproduction II 27 were done. All of the subjects underwent laboratory tests including a chest radiograph, ECG, chemistry profile, CBC count, thyroid function tests, vitamin B-12 level, folic acid level, sphylis serology, and structural brain MRI. At the completion of the evaluation, a consensus committee meeting was held involving the behavioral neurologists, neuropsychologists, nurses and the geriatrician who evaluated the subjects. Subjects with structural abnormalities that could produce dementia, cortical infarction, tumor, subdural hematoma and who had concurrent illnesses or treatments interfering with cognitive function other than AD were excluded. Subjects were not excluded for the presence of leukoaraiosis.
The diagnosis of probable AD was made according to the Diagnostic and Statistical Manual for Mental Disorders 3rd edition – revised (DSM-III-R)28 criteria for dementia, and the National Institute of Neurological and Communicative Disorders and Stroke / Alzheimer's Disease and Related Disorder's Association (NINCDS / ADRDA) 29 criteria for AD. The severity of dementia was rated with Clinical Dementia Rating (CDR) score 30. ApoE genotyping was performed on all subjects. Subjects with genotypes known to confer increased risk of AD (∊3/4 and ∊4/4) were grouped as ∊4 carriers, and those with ∊2/3 and ∊3/3 genotype were grouped as ∊4 non-carriers. Subjects with ∊2/4 genotype were not included in ApoE analyses. Fourteen of the probable AD patients were taking donepezil hydrochloride (HCl) (5mg /day) for an average duration of 14.4 ± 2.39 months.
The operational definition of MCI was a clinical one. In general, these MCI patients were defined by the following characteristics: 1) subjective memory complaint, 2) normal general cognitive function determined by tests of general intellectual function (median MMSE=27, DRS= 129.5, WAIS-R full scale IQ= 99.5), 3) normal activities of daily living, 4) objective memory impairment (median WMS-R logical memory II= 2 and WMS-R visual reproduction II= 6), and 5) not demented 20. These patients had a CDR of 0.5. Controls were defined as individuals who; 1) were independently functioning community dwellers 2) did not have active neurological or psychiatric conditions, 3) had no cognitive complaints, 4) had a normal neurological exam, 5) were not taking any psychoactive medications in doses that would impact cognition.
MRI and 1H-MRS
The MR imaging and single voxel (SV) 1H MRS studies were performed on a 1.5 T (Signa; General Electric Medical Systems, Milwaukee, WI) scanner. After an axial scout, T1 weighted images in sagittal and coronal planes were obtained for localizing the 1H MRS voxel. Special attention was paid to the symmetric positioning of the patient's head. 1H MRS studies were performed with the LX system automated single voxel MRS package: Proton Brain Examination /Single Voxel (PROBE /SV) 31 (General Electric Medical Systems, Milwaukee, WI). Point resolved spectroscopy (PRESS) pulse sequence with TR = 2000 ms, 2048 data points and 128 excitations were used for the examinations. The prescan algorithm of PROBE automatically adjusts the transmitter and receiver gains and center frequency. The local magnetic field homogeneity is optimized with the three-plane auto-shim procedure, and the flip angle of the third water suppression pulse is adjusted for chemical-shift-water suppression (CHESS) prior to PRESS acquisition.
Three different volumes of interest (VOI) were studied: 1) An 8 cm3 (2×2×2cm) occipital VOI, prescribed on a mid-sagittal T1 weighted image, was placed below the parietooccipital sulci and covered both of the medial occipital lobes. 2) A posterior cingulate VOI of the same size was prescribed on the same image, and placed below the cingulate sulci and above the parietooccipital sulci which covered the posterior cingulate gyri and inferior precunei bilaterally. 3) A left superior temporal VOI, was prescribed on a coronal T1 weighted image which covered the superior part of left temporal lobe. For this VOI, we used a slightly smaller voxel size of 7.2 cm3 (2×2×1.8cm) to minimize the amount of inferior insular cortex included (figure1). The VOI's in each subject were placed in a uniform manner by the same investigator (KK).
Figure 1.
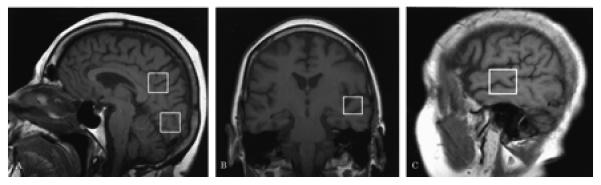
Location of the 8cm3 posterior cingulate, and medial occipital VOI's on a mid-sagittal T1 weighted localizing image (a), location of the 7.2 cm3 left superior temporal VOI on a coronal (b), and a saggital (c) T1 weighted localizing image.
An echo time (TE) of 135 ms. was used in acquisitions from all three VOI's to reduce the contribution from underlying broad resonances. Because of the relatively short transverse relaxation time of MI, we performed another acquisition with a TE of 30 ms. to study the MI peak in the posterior cingulate VOI. In a small number of subjects, we had to repeat one of the PROBE /SV acquisitions because of head motion. The total examination time was 50-60 minutes.
We analyzed the metabolite intensity ratios, which were automatically calculated at the end of each PROBE /SV acquisition, using the physiologically stable metabolite creatine (Cr) as the reference metabolite.
It has previously been shown that MI /Cr ratios increase in the brains of patients with diabetes mellitus 32. Therefore, we excluded diabetic subjects from the analyses of MI /Cr ratios.
Statistical analyses
Statistical analyses were done for each metabolite ratio from every voxel location. The effects of age on metabolite ratios were tested by linear regression analysis and the gender effects were tested with student t-tests in control subjects only, as the data in controls should be free of the confounding effects of disease. The correlation between ApoE genotype (∊4 carriers vs. non-carriers) and the metabolite ratios were analyzed in the three clinical groups independently. Pair-wise between-group differences in AD, MCI and control groups were tested by student t-tests. Values p< 0.05 were considered significant.
Results
The demographic and clinical aspects of the study group are presented in Table 1. The mean ages of the control, MCI and probable AD subjects were not different (p>0.05). However, we still tested for the effects of age on metabolite ratios in control subjects and there was no association between age and metabolite ratios in any of the VOI's (p>0.05). The differences in male/female ratios of the three groups were not statistically significant (chi square p>0.05), but we nonetheless tested for the gender effects on metabolite ratios. There was no difference between the metabolite ratios of male and female control subjects in any of the VOI's studied (student t-tests p>0.05). Four of the AD subjects had CDR 0.5, eleven had CDR 1 and six had CDR 2. The mean Mini- Mental State Examination (MMSE) scores of probable AD patients were lower than those of controls and MCI patients (p<0.001). The mean MMSE scores of MCI patients were less than those of controls (p< 0.001). Education level was similar in controls, MCI and AD patients (p> 0.05). There was no correlation between the metabolite ratios and the ApoE genotype at any of the VOI's in each clinical group except that higher NAA /Cr ratios from the medial occipital VOI of AD patients significantly correlated with ∊4 carrier status (p<0.05).
Table 1.
Demographic and clinical aspects of the subjects
| Control | MCI | AD | |
|---|---|---|---|
| n | 63 | 21 | 21 |
| Age (mean ± SD) | 80.4 ± 6.9 | 82.6 ± 5.2 | 79.7 ± 6.3 |
| Male/Female | 28 / 35 | 12 / 9 | 12 / 9 |
| Education (mean ± SD in years) |
14.0 ± 2.9 | 12.8 ± 3.3 | 12.9 ± 2.6 |
| MMSE (mean ± SD) | 28.6 ± 1.3 | 26.6 ± 2.8 | 18.4 ± 5.9 |
| ApoE status (∈4 carrier /non-carrier*) |
9 / 46 | 5 / 11 | 11 / 8 |
Subjects with a genotype of ∈3/4 and ∈2/4 were grouped as ∈4 carriers and subjects with a genotype of ∈2/3 and ∈3/3 were grouped as ∈4 non-carriers.
The mean ± standard deviation (SD) of NAA /Cr, Cho /Cr, and MI /Cr ratios obtained from each of the three VOI's with an echo time of 135 ms. and from the posterior cingulate VOI with an echo time of 30 ms. are listed by clinical group in table 2. Six control and two probable AD subjects with diabetes mellitus were excluded from the analysis of MI /Cr ratios.
Table 2.
Metabolite ratios (mean ± SD) and pair wise between-group comparison of the subjects
| Metabolite Ratios |
VOI Location (TE*) |
Control n= 63 |
MCI n= 21 |
AD n= 21 |
Control vs. MCI |
Control vs. AD |
AD vs. MCI |
|---|---|---|---|---|---|---|---|
| NAA / Cr | Left Superior Temporal (TE =135 ms.) |
1.58±0.17 | 1.58 ±0.14 | 1.45 ±0.22 | NS | P=0.008 | P=0.030 |
| Posterior Cingulate (TE =30 ms.) |
1.51±0.09 | 1.49 ±0.08 | 1.41 ±0.11 | NS | P<0.001 | P=0.010 | |
| Posterior Cingulate (TE =135 ms.) |
1.70±0.14 | 1.65 ±0.14 | 1.52 ±0.12 | NS | P<0.001 | P=0.003 | |
| Medial Occipital (TE =135 ms.) |
1.82 ±0.17 | 1.78 ±0.16 | 1.80 ±0.17 | NS | NS | NS | |
| Cho / Cr | Left Superior Temporal (TE =135 ms.) |
1.05 ±0.16 | 1.05 ±0.18 | 1.08 ±0.16 | NS | NS | NS |
| Posterior Cingulate (TE =30 ms.) |
0.60 ±0.07 | 0.62 ±0.06 | 0.71 ±0.12 | NS | P<0.001 | P=0.006 | |
| Posterior Cingulate (TE =135 ms.) |
0.79 ±0.10 | 0.81 ±0.10 | 0.86 ±0.11 | NS | P=0.005 | P=0.113 | |
| Medial Occipital (TE =135 ms.) |
0.59 ±0.10 | 0.57 ±0.06 | 0.62 ±0.09 | NS | NS | NS | |
| MI / Cr *** | Posterior Cingulate (TE =30 ms.) |
n= 57** 0.62 ±0.09 |
n= 21 0.67 ±0.07 |
n= 19** 0.74 ±0.08 |
P=0.034 |
P<0.001 |
P=0.008 |
NS: not significant (p>0.05)
TE= 30 ms. spectra were acquired only from the posterior cingulate VOI, while TE=135 ms. spectra were acquired at all anatomic locations. For this reason, two sets of ratios (TE=30 and 135) appear for the posterior cingulate voxel only.
Six controls and two AD subjects had diabetes mellitus and were excluded from the MI/Cr analysis.
Because of the short transverse relaxation time of MI, the MI/ Cr ratios were obtained only at TE =30ms.
Figure 2 shows examples of spectra obtained from the posterior cingulate VOI of a control, an MCI, and a probable AD patient using an echo time of 135 ms. There was no difference between the NAA /Cr ratios of the control and MCI subjects in any of the VOI's studied (p>0.05). However, the NAA /Cr ratios were significantly lower in probable AD patients when compared to both control and MCI subjects in the left superior temporal VOI (p<0.05), and posterior cingulate VOI's (p<0.01) with both long (135ms.) and short (30ms.) echo times. The between-group differences of NAA /Cr ratios in the medial occipital VOI were not statistically significant (p>0.05) (table 2, figure 3).
Figure 2.

Examples of proton spectra obtained from the posterior cingulate VOI with an echo time of 135 ms. in a control subject (top), an MCI (middle), and a probable AD patient (bottom). The NAA /Cr ratio is lower in the probable AD patient compared to both the MCI and the control subjects.
Figure 3.

Scatter plot of NAA /Cr ratios obtained from the left superior temporal, posterior cingulate and medial occipital VOI's of control (C), MCI and probable AD subjects (TE=135 ms.). Horizontal bars show the group -mean values.
Figure 4 shows examples of spectra obtained from the posterior cingulate VOI of a control, an MCI, and a probable AD patient using an echo time of 30 ms. The MI /Cr ratios obtained from the posterior cingulate VOI were higher in probable AD patients compared to both MCI (p<0.05) and control subjects (p<0.001). MI /Cr ratios were also higher in MCI patients compared to control subjects (p<0.01) (table 2, figure5).
Figure 4.

Examples of proton spectra obtained from the posterior cingulate VOI with an echo time of 30 ms. in a control subject (top), an MCI (middle), and a probable AD patient (bottom). The MI /Cr ratios are higher in the MCI patient compared to the control subject. The MI /Cr and Cho /Cr ratios are higher in the AD patient compared to both the MCI and the control subjects.
Figure 5.

Scatter plot of MI /Cr ratios of control (C), MCI and probable AD subjects in the posterior cingulate VOI (TE=30 ms.). Horizontal bars show the group -mean values.
In the posterior cingulate VOI, the Cho /Cr ratios of probable AD patients were higher than both control and MCI subjects with an echo time of 30 ms. (p<0.01). When studied with an echo time of 135ms., the Cho/Cr ratios were higher in the probable AD patients than in control (p<0.01) subjects. While a similar trend was observed, this difference was not statistically significant between probable AD and MCI patients (p=0.11) with an echo time of 135 ms. There were no statistically significant differences between the Cho /Cr ratios of the controls, MCI and probable AD patients in both superior temporal and medial occipital VOI's (table 2).
Discussion
Cross sectional Assessment of Disease Progression and Cognitive Continuum
In the cognitive continuum of aging, MCI patients often represent a clinical state between the normally aging elderly and those with dementia 20-22. Neurofibrillary pathology, which is highly correlated with neuronal and synaptic loss as well as cognitive dysfunction in AD patients, first affects the transentorhinal and entorhinal cortex, then hippocampus, then spreads throughout the limbic cortex including the posterior cingulate gyrus, and finally to isocortical areas. The pre and post-central gyri and occipital isocortical areas are typically affected only at the end stage of the disease 33, 34.
Based on the behavior of the three clinical groups studied, we can assume that few if any of the controls had AD pathology, a high proportion of MCI subjects had AD in its early stages, and all AD patients had AD pathology in more advanced stages. Therefore, on average, the 1H MRS findings in the MCI group represent changes associated with pre-clinical AD, while findings in the probable AD patients represent changes associated with a more advanced stage of the disease. Hence, although this study was cross-sectional in nature, we were able to approximately correlate 1H-MRS findings with clinical states which represent different zones of the continuum from normal to AD (ie. controls, MCI, AD).
The rationale for selecting the specific anatomic regions and TE's in this study was as follows: The anatomic placement of the voxels was designed to evaluate areas in the brain involved at different neurofibrillary pathologic stages of AD; superior temporal lobe and posterior cingulate gyri involved relatively early, and medial occipital lobes involved later in the disease course 33, 34. We chose to study the posterior cingulate VOI with the short TE (30 ms.) because, the posterior cingulate gyri are one of the regions affected fairly early in the pathologic progression of AD, and the quality of short echo time spectra obtained from the posterior cingulate VOI was better than those obtained from the left superior temporal VOI. Due to the relatively short T2 relaxation time of MI, MI /Cr ratios had to be measured with a short TE acquisition. The posterior cingulate area offered the best compromise between relatively early pathologic involvement and high quality spectra. Another reason for choosing the posterior cingulate VOI was, that PET studies have identified the posterior cingulate gyri as being the most significantly affected region of the brain in both early AD patients and asymptomatic carriers of the apolipoprotein ∊4 allele who are at elevated risk for AD 4,5. As with 1H MRS, technical difficulties in acquiring glucose metabolism measurements from the anteromedial temporal lobe were apparently encountered in these PET studies 4.
In planning the MR protocol for this study, we placed an upper limit of one hour for routine completion of the MR exam, out of consideration for the comfort of our volunteer subjects. Within this time, we were unable to routinely acquire spectra from both temporal lobes and therefore elected to study only the left.
NAA /Cr Ratios
The neuronal marker NAA, decreases in several disease states where neuronal loss is prominent. In addition however, reversible decrease in NAA levels in temporal lobe epilepsy raises the argument that NAA is not only a marker of neuronal number but of neuronal function as well 35. Our findings of decreased NAA /Cr ratios in the left superior temporal lobe and posterior cingulate voxels in AD relative to controls but not in MCI patients relative to controls could be anticipated based on Braak 33 staging criteria of NFP. On average, patients with MCI probably correspond to Braak stage III, where neurofibrillary pathology has spread from transentorhinal cortex to hippocampus, but widespread involvement of other limbic or temporal lobe areas has not yet occurred 36.
One obvious limitation of this study is that, while we wished to study the entorhinal cortex and hippocampus, that was not possible for two technical reasons: 1) difficulty obtaining spectra from a voxel small enough to sample these medial temporal lobe regions without significant partial voluming, 2) difficulty achieving an adequately homogenous magnetic field (the automated shimming algorithm failed) due to the magnetic susceptibility effects at the tissue-air interface near the petrous bone.
In light of the pathological progression of AD, it seems reasonable to suggest that, if we were able to study the anteromedial temporal lobe where earliest neurofibrillary changes occur, we should also have found lower NAA /Cr ratios in MCI patients.
In the medial occipital lobe, the NAA /Cr ratios were similar in all three groups. Medial occipital lobe is involved with the neurofibrillary pathology only at the end stages of the disease 33. Most of the AD patients we studied were mildly demented (CDR 1). Therefore, finding similar NAA /Cr ratios in control, MCI and mild AD subjects in the medial occipital VOI was not surprising. However, there are previous reports of significantly decreased NAA /Cr ratios at the occipital lobe of probable AD patients 8, 9. The reason for this inconsistency may be the differences in the severity of dementia in probable AD subjects studied, or the differences in placement of the occipital VOI's.
Fourteen out of twenty one probable AD patients were taking donepezil HCl, which has previously been reported to increase NAA /Cr ratios in probable AD patients 37. If this effect was present in our data, it would diminish the magnitude by which NAA /Cr ratios in probable AD patients differed from MCI and control subjects and could lead to false negative results. Hence, this may have contributed to finding similar NAA /Cr ratios in probable AD patients compared to both MCI and control subjects in the medial occipital VOI in this study.
An association between the decreased NAA /Cr ratios in postmortem AD brain and the presence of the Apo-E4 genotype was recently described 38. However the disease duration and severity at the time of death was not mentioned in that study which could have an effect on the metabolite ratios. Except the medial occipital NAA /Cr ratios in AD patients, we did not find any correlation between the ApoE status (∊4 carriers vs. non-carriers) and the metabolite ratios. We interpret the absence of an association between ApoE ∊4 and metabolite ratios in our controls to indicate that no alteration in the metabolite ratios that we measured is present in individuals who are currently asymptomatic but who are at elevated risk of developing AD later.
Cho / Cr Ratios
Besides free choline, the metabolites glycerophosphoryl-choline, phosphocholine, and phosphatidylcholine also contribute to the Cho peak in 1H MRS. Increased Cho levels are thought to be related to increased cell membrane phospholipid turnover 39. At both TE= 135 ms. and TE= 135 ms., we observed higher Cho /Cr ratios in AD patients compared to controls in the posterior cingulate VOI but not in the medial occipital and superior temporal VOI's. Although probable AD patients had higher Cho /Cr ratios compared to MCI patients with TE= 30 ms., this difference did not reach statistical significance with TE= 135 ms. To our knowledge, there is no directly comparable published data that addresses 1H MRS findings in the same group of AD subjects with different echo times in the posterior cingulate gyri. Some studies have found elevated and some comparable or depressed Cho /Cr ratios in AD patients relative to elderly controls 8-15. The disagreement in the literature on this point may depend not only on the clinical heterogeneity of the patients and sampling of different regions in the brain, but also on the echo times used.
Myo – inositol / Creatine Ratios
In this study, the only measure which differed (p = 0.034) between controls and MCI's was the MI /Cr ratios in the posterior cingulate VOI which was higher in MCI patients when compared to the control subjects. One limitation regarding the interpretation of this finding is that, we made nine different comparisons between control and MCI subjects without adjusting our level of significance (for example to p <0.01). However, the MI /Cr ratios were even higher in probable AD patients when compared to MCI subjects. And, the greatest inter-group difference in MI /Cr ratios was between the control and AD subjects. This progressive increase in MI /Cr ratios correlates inversely with the average decline in cognitive performance from controls to MCI and to probable AD patients. Furthermore, the overlap between MCI and the other two groups in this data would be expected based on the longitudinal behavior of patients with MCI; most probably have pre-clinical AD but some remain relatively stable and may not progress to AD. In an earlier study, MI /Cr ratios in patients with age associated memory impairment were intermediate between AD patients and elderly controls. These data also support the concept that an elevation in MI /Cr is evident prior to the full clinical manifestations of AD. However the criteria used for the diagnosis of age associated memory impairment are different from criteria used in our study for MCI 10.
The relationship between the pathology of AD and the observed increase in MI /Cr ratios is not clear-cut. Myo-inositol, which is the main metabolite contributing to the peak, is primarily located in glial cells and is a possible glial marker 40. MI /Cr ratios are altered in hepatic encephalopathy 41, hyponatremia 42, hypernatremia 43, diabetes mellitus 32, and Down's syndrome 44. Of these, Down's syndrome has pathologic similarities to AD. Both diseases are characterized by the accumulation of the amyloid β-protein deposits and advanced cerebral atrophy 45. It was proposed that, the increase in MI occurs before the decrease in NAA and the clinical onset of dementia in Down's syndrome 19. MI / Cr ratios are also increased in AD patients compared to patients with multi-infarct dementia 46. It is not known whether the increase in the MI peak is due to microglial or astrocytic activation both of which are associated with neuritic plaques 19, 47. If inflammation proves to play an important role in AD, it is interesting to speculate that 1H MRS measurements might provide a non-invasive biomarker of this process 47.
Overall, these results suggest that in the pathologic progression of AD, an increase in MI /Cr ratios precede the decrease in the NAA /Cr ratios and an increase in Cho /Cr ratios. Our findings suggest limited value for clinical diagnosis in individual patients due to the prominent overlap among the metabolite ratios in the three clinically defined groups. However, 1H MRS may provide valuable information about the pathophysiological progression of the disease. Of particular interest are possible relationships between elevated MI /Cr, glial activation and inflammation in the pathology of AD.
Acknowledgments
Supported by NIH- NIA AG11378, AG08031, AG06786, AG16574, the DANA Foundation and the Alzheimer's Association.
The authors would like to thank Ruth Cha for performing the statistical analysis
References
- 1.Kokmen E, Beard CM, O'Brien PC, Offord K, Kurland LT. Is the incidence of dementing illness changing? A 25- year-time-trend study in Rochester, MN (1960-1984) Neurology. 1993;43:1887–1892. doi: 10.1212/wnl.43.10.1887. [DOI] [PubMed] [Google Scholar]
- 2.Petersen RC, Smith GE, Ivnik RJ, Kokmen E, Tangalos EG. Memory function in very early Alzheimer's disease. Neurology. 1994;44:867–872. doi: 10.1212/wnl.44.5.867. [DOI] [PubMed] [Google Scholar]
- 3.Jack CR, Petersen RC, Xu Y, et al. Medial temporal atrophy on MRI in normal aging and very mild Alzheimer's disease. Neurology. 1997;49:786–794. doi: 10.1212/wnl.49.3.786. [DOI] [PMC free article] [PubMed] [Google Scholar]
- 4.Minoshima S, Giordani B, Berent S, Frey KA, Foster NL, Kuhl DE. Metabolic reduction in the posterior cingulate cortex in very early Alzheimer's disease. Ann Neurol. 1997;42:85–94. doi: 10.1002/ana.410420114. [DOI] [PubMed] [Google Scholar]
- 5.Reiman EM, Caselli RJ, Yun LS, et al. Preclinical evidence of Alzheimer's disease in persons homozygous for the ∈ 4 allele for apolipoprotein E. N Engl J Med. 1996;334:752–758. doi: 10.1056/NEJM199603213341202. [DOI] [PubMed] [Google Scholar]
- 6.Johnson KA, Jones K, Holman BL, et al. Preclinical prediction of Alzheimer's disease using SPECT. Neurology. 1998;50:1563–1571. doi: 10.1212/wnl.50.6.1563. [DOI] [PubMed] [Google Scholar]
- 7.Klunk WE, Panchalingam K, Moosy J, Mc Clure RJ, Pettegrew JW. N-acetyl-L-aspartate and other amino acid metabolites in Alzheimer's disease brain: a preliminary proton nuclear magnetic resonance study. Neurology. 1992;42:1578–1585. doi: 10.1212/wnl.42.8.1578. [DOI] [PubMed] [Google Scholar]
- 8.Miller BL, Moats RA, Shonk T, Earnst T, Wooley S, Ross BD. Alzheimer disease: Depicition of increased cerebral myo-inositol with proton MR spectroscopy. Radiology. 1993;187:443–437. doi: 10.1148/radiology.187.2.8475286. [DOI] [PubMed] [Google Scholar]
- 9.Shonk TK, Moats RA, Gifford PG, et al. Probable Alzheimer's disease: Diagnosis with proton MR spectroscopy. Radiology. 1995;195:65–72. doi: 10.1148/radiology.195.1.7892497. [DOI] [PubMed] [Google Scholar]
- 10.Parnetti L, Lowenthal D, Presciutti O, et al. 1H-MRS, MRI-based hippocampal volumetry, and 99mTc-HMPAO-SPECT in normal aging, age-associated memory impairment, and probable Alzheimer's disease from normal aging. JAGS. 1996;44:133–138. doi: 10.1111/j.1532-5415.1996.tb02428.x. [DOI] [PubMed] [Google Scholar]
- 11.Schuff N, Amend DL, Meyerhoff DJ, et al. Alzheimer disease: Quantitative H-1 MR Spectroscopic imaging of frontoparietal brain. Radiology. 1998;207:91–102. doi: 10.1148/radiology.207.1.9530304. [DOI] [PMC free article] [PubMed] [Google Scholar]
- 12.Schuff N, Amend DL, Ezekiel F, et al. Changes of hippocampal N-acetyl aspartate and volume in Alzheimer's disease A proton MR spectroscopic imaging and MRI study. Neurology. 1997;49:1513–1521. doi: 10.1212/wnl.49.6.1513. [DOI] [PubMed] [Google Scholar]
- 13.MacKay S, Ezekiel F, Di Sclafani V, et al. Alzheimer's disease and subcortical ischemic vascular dementia: evaluation by combining MR imaging segmentation and H-1 MR spectroscopic imaging. Radiology. 1996;198:537–545. doi: 10.1148/radiology.198.2.8596863. [DOI] [PMC free article] [PubMed] [Google Scholar]
- 14.Meyerhoff DJ, MacKay S, Norman D, Van Dyke C, Fein G, Weiner MW. Axonal injury and membrane alterations in Alzheimer's disease suggested by in vivo proton magnetic resonance spectroscopic imaging. Ann Neurol. 1994;36:40–47. doi: 10.1002/ana.410360110. [DOI] [PubMed] [Google Scholar]
- 15.Tedeschi G, Bertolino A, Lundbom N, et al. Cortical and subcortical chemical pathology in Alzheimer's disease as assessed by multislice proton magnetic resonance spectroscopic imaging. Neurology. 1996;47:696–704. doi: 10.1212/wnl.47.3.696. [DOI] [PubMed] [Google Scholar]
- 16.Behar KL, den Hollander JA, Stromski ME, et al. High resolution 1H-MRS study of cerebral hypoxia in vivo. Proc Natl Acad Sci USA. 1983;80:4945–4948. doi: 10.1073/pnas.80.16.4945. [DOI] [PMC free article] [PubMed] [Google Scholar]
- 17.Tsai G, Coyle JT. N-acetylaspartate in neuropsychiatric disorders. Progress in Neurobiol. 1995;46:531–540. doi: 10.1016/0301-0082(95)00014-m. [DOI] [PubMed] [Google Scholar]
- 18.Kreis R, Ernst T, Ross BD. Absolute quantitation of water and metabolites in the human brain: Part II. Metabolite concentrations. J Magn Reson. 1993;102:9–19. [Google Scholar]
- 19.Ross BD, Bluml S, Cowan R. In vivo MR spectroscopy of human dementia. Neuroimaging Clinics of N America. 1998;8(4):809–822. [PubMed] [Google Scholar]
- 20.Petersen RC, Smith GE, Waring SC, Ivnik RJ, Tangalos EG, Kokmen E. Mild cognitive impairment clinical characterization and outcome. Arch Neurol. 1999;56:303–308. doi: 10.1001/archneur.56.3.303. [DOI] [PubMed] [Google Scholar]
- 21.Petersen RC, Smith GE, Ivnik RJ, et al. Apolipoprotein E status as a predictor of the development of Alzheimer's disease in memory impaired individuals. JAMA. 1995;273(16):1274–1278. [PubMed] [Google Scholar]
- 22.Smith GE, Petersen RC, Parisi JE, Ivnik RJ. Definition, course, and outcome of mild cognitive impairment. Aging, Neuropsychology and Cognition. 1996;3(2):141–147. [Google Scholar]
- 23.Jack CR, Jr, Petersen RC, Xu YC, et al. Prediction of AD with MRI-based hippocampal volume in mild cognitive impairment. Neurology. 1999;52:1397–1403. doi: 10.1212/wnl.52.7.1397. [DOI] [PMC free article] [PubMed] [Google Scholar]
- 24.Petersen RC, Kokmen E, Tangalos E, Ivnik RJ, Kurland LT. Mayo Clinic Alzheimer's Disease Patient Registry. Aging. 1990;2:408–415. doi: 10.1007/BF03323961. [DOI] [PubMed] [Google Scholar]
- 25.Folstein MF, Folstein SE, McHugh PR. “Mini Mental State “: a practical method for grading the cognitive state of patients for the clinician. J Psychiatr Res. 1075;12:189–198. doi: 10.1016/0022-3956(75)90026-6. [DOI] [PubMed] [Google Scholar]
- 26.Mattis S. Dementia Rating Scale: Professional Manual. Psychological Assessment Resources Inc; Odessa, Fla: 1988. [Google Scholar]
- 27.Lezak MD. Neuropsychological Assessment. Third Edition Oxford University Press Inc; New York, NY: 1988. [Google Scholar]
- 28.American Psychiatric Association. DSM-III-R . Diagnostic and statistical manual of mental disorders. 3rd ed., revised Washington, DC: 1987. [Google Scholar]
- 29.Mc Khann GM, Drachman D, Folstein M, Katzman R, Price D, Stadlan EM. Clinical diagnosis of Alzheimer's Disease: report of the NINCDS – ADRDA work group under the auspices of Department of Health and Human Services Task Force on Department of Health and Human Services Task Force on Alzheimer's disease. Neurology. 1984;34:939–944. doi: 10.1212/wnl.34.7.939. [DOI] [PubMed] [Google Scholar]
- 30.Morris JC. The Clinical Dementia Rating (CDR): current version and scoring rules. Neurology. 1993;43:2412–2414. doi: 10.1212/wnl.43.11.2412-a. [DOI] [PubMed] [Google Scholar]
- 31.Webb PG, Sailasuta N, Kohler SJ, Raidy T, Moats RA, Hurd RE. Automated single-voxel proton MRS: technical development and multisite verification. Magn. Reson. Med. 1994;31:365–373. doi: 10.1002/mrm.1910310404. [DOI] [PubMed] [Google Scholar]
- 32.Kreis R, Ross BD. Cerebral metabolic disturbances in patients with subacute and chronic diabetes mellitus: detection with MR spectroscopy. Radiology. 1992;184:123–130. doi: 10.1148/radiology.184.1.1319074. [DOI] [PubMed] [Google Scholar]
- 33.Braak H, Braak E. Neuropathological staging of Alzheimer's disease. Acta Neuropathol (Berl) 1991;82:239–259. doi: 10.1007/BF00308809. [DOI] [PubMed] [Google Scholar]
- 34.Delacourte A, David JP, Sergeant N, et al. The biochemical pathway of neurofibrillary degeneration in aging and Alzheimer's disease. Neurology. 1999;52:1158–1165. doi: 10.1212/wnl.52.6.1158. [DOI] [PubMed] [Google Scholar]
- 35.Hugg JW, Kuzniecky RI, Gilliam FG. Normalization of contralateral metabolic function following temporal lobectomy demonstrated by 1H magnetic resonance spectroscopic imaging. Ann Neurol. 1996;40:236–239. doi: 10.1002/ana.410400215. [DOI] [PubMed] [Google Scholar]
- 36.Gerober E, Dickson D, Sliwinski MJ, et al. Memory and mental status correlates of Braak staging. Neurobiol of Aging. 1999;20(6):573–579. doi: 10.1016/s0197-4580(99)00063-9. [DOI] [PubMed] [Google Scholar]
- 37.Yu X, Krishnan RR, Mintzer J, et al. Donepezil's effect on N-acetyl aspartate levels of Alzheimer's patients using magnetic resonance spectroscopy; Proceedings 7th ISMRM; Philadelphia. 1999. p. p1434. [Google Scholar]
- 38.Klunk WE, Panchalingam K, McClure RJ, Stanley A, Pettegrew JW. Metabolic alterations in postmortem Alzheimer's disease brain are exaggerated by Apo-E4. Neurobiol of Aging. 1998;19(6):511–515. doi: 10.1016/s0197-4580(98)00105-5. [DOI] [PubMed] [Google Scholar]
- 39.Castillo M, Kwock L. Proton MR spectroscopy of common brain tumors. Neuroimaging Clinics of N America. 1998;8(4):733–752. [PubMed] [Google Scholar]
- 40.Danielsen ER, Ross BD. Magnetic resonance spectroscopy diagnosis of neurological diseases. M. Dekker; New York: 1999. [Google Scholar]
- 41.Kreis R, Ernst T, Ross BD. Metabolic disorders of the brain in chronic hepatic encephalopathy detected with 1H MRS. Radiology. 1992;182:19–27. doi: 10.1148/radiology.182.1.1345760. [DOI] [PubMed] [Google Scholar]
- 42.Videen JS, Michaelis T, Pinto P, et al. Human cerebral osmolytes during chronic hyponatremia: A proton magnetic resonance spectroscopy study. J Clin Invest. 1995;95:788–793. doi: 10.1172/JCI117728. [DOI] [PMC free article] [PubMed] [Google Scholar]
- 43.Lee JH, Arcinue E, Ross BD. Organic osmolytes in the brain of an infant with hypernatremia. N Engl J Med. 1994;331:439–442. doi: 10.1056/NEJM199408183310704. [DOI] [PubMed] [Google Scholar]
- 44.Shonk T, Ross BD. Role of increased cerebral myo-inositol in the dementia of Down syndrome. Magn Reson Med. 1995;33:858–861. doi: 10.1002/mrm.1910330619. [DOI] [PubMed] [Google Scholar]
- 45.Cummings JL, Vinters HV, Cole GM, Khachaturian ZS. Alzheimer's disease etiologies, pathophysiology, cognitive reserve, and treatment opportunities. Neurology. 1998;51(Suppl 1):S2–S17. doi: 10.1212/wnl.51.1_suppl_1.s2. [DOI] [PubMed] [Google Scholar]
- 46.Rai GS, McConnell JR, Waldman A, Grant D, Chaudry M. Brain proton spectroscopy in dementia: an aid to clinical diagnosis. Lancet. 1999;353(9158):1063–1064. doi: 10.1016/s0140-6736(98)03759-3. [DOI] [PubMed] [Google Scholar]
- 47.Dickson DW. The pathogenesis of senile plaques. J Neuropath and Exp Neurol. 1997;56(4):321–329. doi: 10.1097/00005072-199704000-00001. [DOI] [PubMed] [Google Scholar]