

Abstract
Cancer cells are frequently characterized by aberrant increases in protein N-glycosylation and by disruption of E-cadherin-mediated adherens junctions (AJs). The relationship between altered N-glycosylation and loss of E-cadherin adhesion in cancer, however, remains unclear. Previously, we reported that complex N-glycans on E-cadherin’s extracellular domains inhibited the formation of mature AJs. Here, we examined whether dysregulated N-glycosylation was one of the underlying causes for cellular discohesion in oral cancer. We show that dense cultures of human salivary epidermoid carcinoma A253 cells exhibited elevated expression of DPAGT1, the gene that initiates protein N-glycosylation. Overexpression of DPAGT1 correlated with the production of E-cadherin bearing complex N-glycans in nascent AJs. Partial inhibition of DPAGT1 with siRNA reduced E-cadherin’s complex N-glycans and increased the abundance of α-catenin and stabilizing proteins in AJs. This was associated with the assembly of functional tight junctions. The inverse relationship between DPAGT1 expression and intercellular adhesion was a feature of oral squamous cell carcinoma (OSCC). OSCCs displayed overexpression of DPAGT1 that correlated with diminished localization of E-cadherin and α-catenin at the sites of AJs. Our studies show for the first time that DPAGT1 is an upstream regulator of E-cadherin N-glycosylation status and AJ composition and suggest that dysregulation of DPAGT1 causes disturbances in intercellular adhesion in oral cancer.
Keywords: E-cadherin, N-glycosylation, oral cancer
Introduction
Epithelial tissues maintain their mature architecture through the function of E-cadherin, a calcium-dependent N-glycoprotein cell-cell adhesion receptor (1–3). E-cadherin-mediated cell-cell contacts comprise multiprotein complexes known as adherens junctions (AJs)(4) that play pivotal roles in cell polarity, cell surface mechanics, cell migration, cell survival, cell differentiation (1, 5–8) and the prevention of tumor spread (9).
E-cadherin is a single-span transmembrane N-glycoprotein containing five extracellular domains, or ectodomains (ECs), a transmembrane region, and a cytosolic tail (1). During homotypic cell-cell contact formation, the ECs dimerize in a Ca2+ dependent manner and interact with ECs on adjacent cells. The cytosolic tails of E-cadherins bind catenins that mediate the interaction with the actin cytoskeleton (10, 11). The interaction between E-cadherin/β-catenin complexes and α-catenin produces initial AJs (4, 12, 13) that can further associate with actin-binding and -crosslinking proteins, adaptor proteins and signaling molecules to produce diverse scaffolds (4, 14). Functional diversity of E-cadherin relies on its ability to form distinct AJs whose composition is subject to dynamic rearrangements depending on the cell context (15).
N-glycosylation of E-cadherin has been implicated in the regulation of cell-cell adhesion (16–19). We and others have shown that complex oligosaccharides that modify E-cadherin in proliferating cells inhibit adhesion, while high-mannose/hybrid structures promote the formation of mature AJs in dense cultures (18, 19). A likely upstream regulator of E-cadherin’s N-glycosylation is the DPAGT1 gene encoding the dolichol-P-dependent N-acetylglucosamine-1-phosphate-transferase (20, 21) that initiates the synthesis of the lipid-linked oligosaccharide (LLO) precursor for protein N-glycosylation in the endoplasmic reticulum. By regulating the abundance of LLO, DPAGT1 controls the extent of protein N-glycosylation (20, 21). High DPAGT1 expression is associated with cell proliferation and nascent AJs, while downregulation of DPAGT1 characterizes growth-arrested cells with mature AJs (18, 19, 22).
In many cancers, progression to metastasis is accompanied by downregulation of E-cadherin expression. Oral cancer, one of the most pernicious malignancies, has also been characterized by diminished E-cadherin levels (23–28). Nonetheless, a subset of oral cancers prominently expresses E-cadherin and maintains the ability to invade the surrounding tissue (27, 29). Since N-glycosylation of E-cadherin affects its ability to form mature AJs, it is possible that aberrant N-glycosylation is the underlying cause for defective adhesion in some oral cancers. Indeed, N-glycosylation of cell surface glycoproteins is frequently altered in cancer (30–32), with tumor progression linked to increases in the abundance of complex N-glycans (33–35).
In the present study, we examined the relationship between DPAGT1 expression and E-cadherin-mediated adhesion in oral cancer. We show that dense cultures of human salivary epidermoid carcinoma A253 cells displayed aberrantly high DPAGT1 expression and produced E-cadherin modified with complex N-glycans in nascent AJs. Partial inhibition of DPAGT1 with siRNA reduced E-cadherin’s modification with complex N-glycans and promoted the formation of mature AJs, as well as the assembly of functional tight junctions (TJs). Similar to A253 cells, nine archival and three fresh OSCC specimens exhibited elevated levels of DPAGT1, formed immature AJs and lacked detectable TJs. We conclude that N-glycosylation is one of the regulators of E-cadherin tumor suppressive activity by affecting the stability of AJs and the assembly of TJs.
Materials and Methods
Reagents
Monoclonal antibodies to human E-cadherin cytoplasmic region, α-catenin, β-catenin, γ-catenin, PP2A, IQGAP1, ZO-1, Ki67 and IgG isotype controls were obtained from BD. Polyclonal antibodies to claudin-1, occludin and monoclonal antibody to cytokeratin AE1/AE3 were purchased from Zymed. Monoclonal antibodies to vinculin and Pan-actin Ab-5 were from Upstate Biotechnology and NeoMarkers, respectively. Rabbit polyclonal antibody to hamster DPAGT1 was prepared commercially (Covance Research Products, Inc). Secondary antibodies included goat anti-mouse and anti-rabbit IgG derivatized with either fluorescein isothiocyanate (FITC) or Texas red (Molecular Probes).
Cell culture and tissues
Cultures of primary human oral keratinocytes (HOK) and human salivary epidermoid carcinoma A253 cells were grown in keratinocyte medium and McCoy’s 5a medium, respectively, supplemented with 10% FBS, penicillin and streptomycin. Total cell lysates (TCLs) were prepared by extraction with Triton/β-octylglucoside buffer (19).
Tissue specimens, representing scalpel-generated incisional biopsies from primary tumors, were obtained at the Boston University Medical Center, Boston, MA and were approved for studies by the institutional review board. Formalin-fixed paraffin-embedded specimens of primary OSCC, including cytologically normal stratified squamous adjacent epithelia (AE), were obtained from nine individuals with well to moderately differentiated OSCC of the lateral tongue border, maxillary gingiva and maxillary mucobuccal fold. Fresh tissues were obtained from three patients undergoing resection and radical neck dissection of moderately differentiated OSCC of the lateral tongue border. Regions of OSCC and AE, defined by an on site pathology analysis, were snap-frozen at −80°C. One fraction of each was used for biochemical analyses, while another was embedded in OTC compound (Fisher Scientific) for section preparation, described below. Total lysates from AE and OSCC were prepared by extraction with Triton/β-octylglucoside buffer (19). Protein concentrations were determined using BCA assay (Pierce).
RNA interference
SMART-pool™ of siRNAs targeting DPAGT1 (S) was obtained from Dharmacon. Non-silencing (NS) negative control siRNA was from Qiagen. A253 cells were transfected at 50% confluence with 200 nM of either NS or S using Lipofectamine 2000 (Invitrogen) and cultured for 72 h. For determination of doubling times, cells were collected at 12 h intervals for a total of 72 h, and cell number was obtained using a hemocytometer.
Quantitative RT-PCR
Total RNAs, isolated from A253 cells transfected with either NS or S, were used for cDNA synthesis to assess DPAGT1 expression by real-time PCR. The gene expression profiles were generated by normalizing the Ct (threshold cycle numbers) of DPAGT1 with a housekeeping gene S29 and comparing the gene expression of cells treated with NS and S. Statistical analysis was performed using real-time PCR from two independent RNA preparations, with each experiment repeated twice (n = 4). The P value between the NS and S treatments was calculated using an unpaired t-test.
Western blot
Cell and tissue lysates were fractionated on 7.5% SDS-PAGE, transferred onto PVDF membranes, blocked with 5% non-fat dry milk and incubated with primary antibodies to selected proteins. Protein-specific detection was carried out with horseradish peroxidase-labeled secondary antibodies and ECL Plus (Amersham Biosciences). P values were determined by ANOVA.
PNGaseF and EndoH digestions
Cell and tissue lysates were digested with 100 U of either PNGaseF or EndoH (New England Biolabs) for 1 h at 37°C and analyzed by Western blot. Control samples were incubated without the enzymes.
Immunoprecipitation
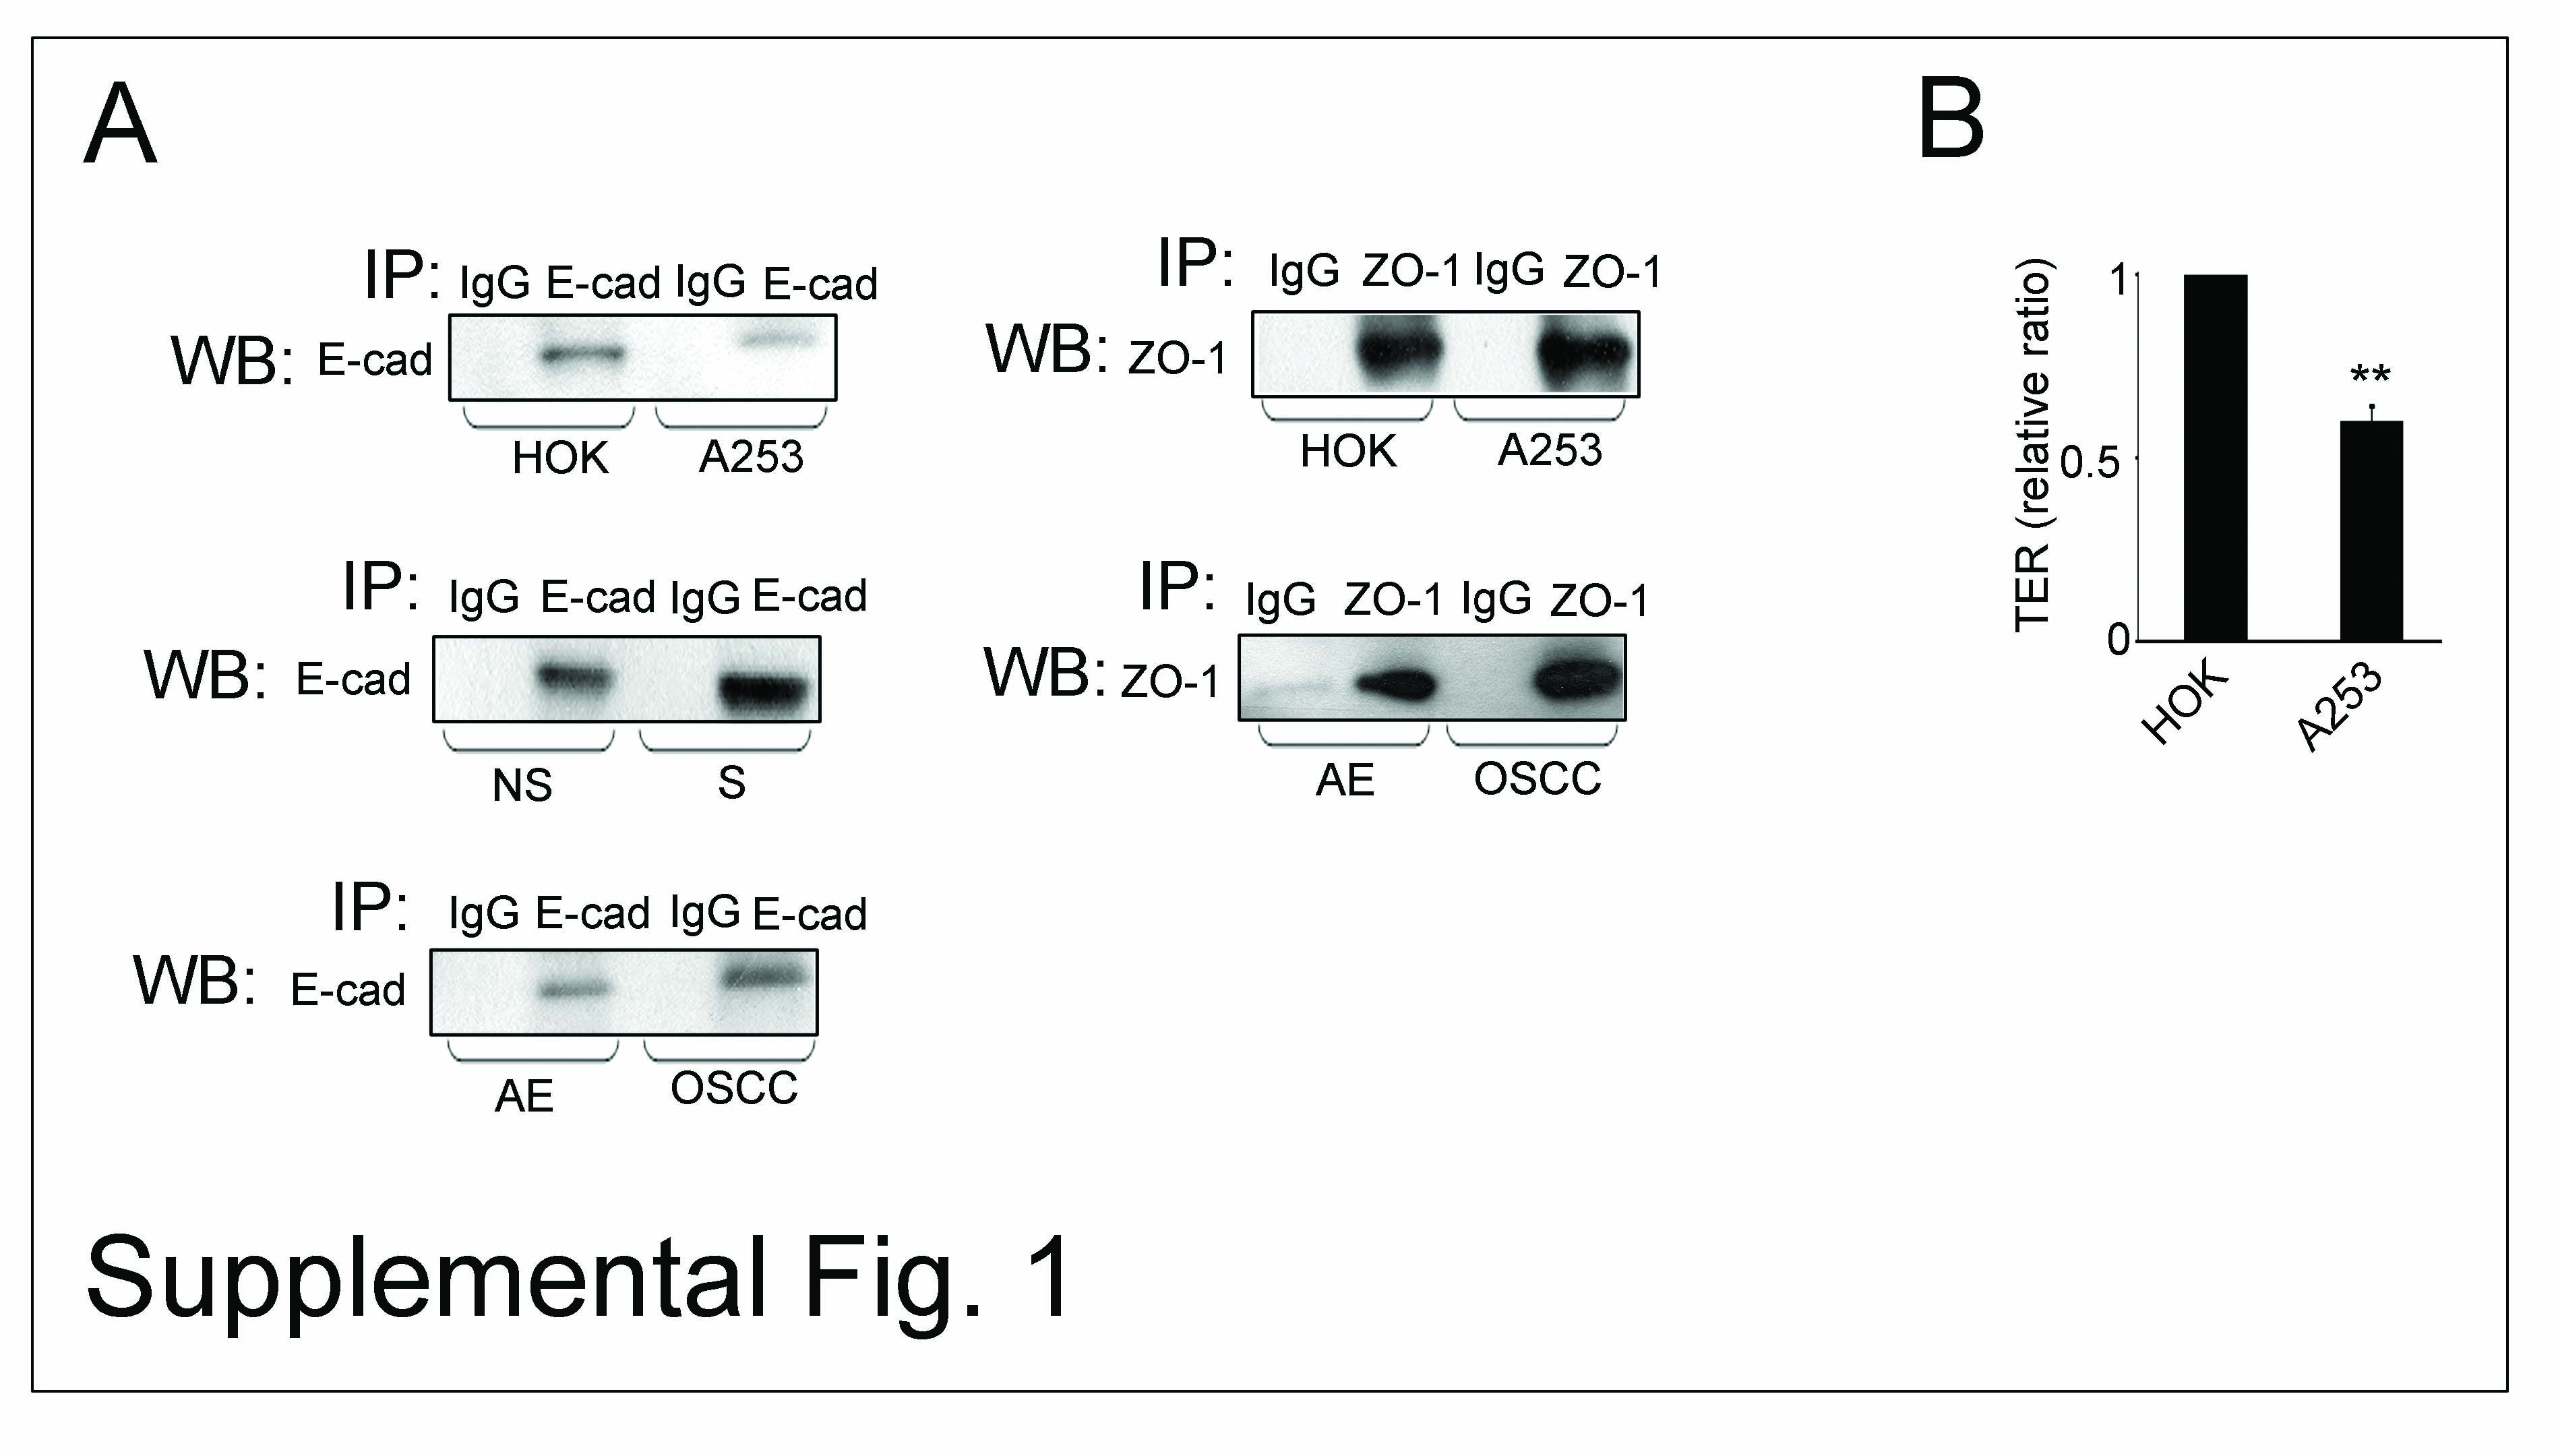
Equal amounts of protein (200 µg) were precleared with antibody isotype controls and protein G beads (Sigma) (Supplemental Fig. 1A). The resulting supernatants were incubated with 2.5 µg of antibody against either E-cadherin or ZO-1 and 30 µl of protein G beads for 2 h at 4°C. The beads were washed with lysis buffer and samples were analyzed by Western blot as described (19).
Transepithelial resistance
Transepithelial resistance (TER) was measured in Transwells (polycarbonate membrane, 12-mm diameter, 0.4 µm pore size; Corning Costar) using an epithelial voltohmmeter (World Precision Instruments). Values were calculated after subtracting background readings from blank Transwells with the media that were cultured in parallel. Statistical analysis was by ANOVA.
Section preparation
For immunohistochemical analyses, sections (3 µm) of archival tissues were placed on OptiPlus ™ Positive-Charged Barrier Slides (BioGenex), deparaffinized, treated with Retrievit-6 ™ Target Retrieval Solution (BioGenex) and processed for immunostaining.
OTC-embedded fresh tumor tissues were used for preparation of frozen sections (5 µm). One frozen section was set aside for hematoxylin and eosin (H&E) staining, while the remaining sections were processed for immunofluorescence analyses, described below.
Microscopy, immunofluorescence and imaging
Morphologies of A253 cells transfected with NS and S were examined using a Nikon Eclipse TE300 microscope. For indirect immunofluorescence analyses, transfected cells were grown to confluence, fixed in 3.7% paraformaldehyde, permeabilized with 0.1% Triton X-100, blocked with 10% goat serum and incubated with primary antibodies to E-cadherin. Cells were incubated with FITC-tagged secondary antibodies, counterstained for F-actin with rhodamine-phalloidin where indicated, mounted in Vectashield and analyzed with a Zeiss LSM510 META confocal microscope.
For indirect immunofluorescence analyses, tissue sections were blocked with 10% goat serum and incubated with antibodies against selected proteins followed by secondary antibodies conjugated with either FITC or Texas red. Negative controls lacked primary antibodies. The slides were mounted in Vectashield and optical sections (0.74 µm) were analyzed by confocal microscopy. To compare fluorescence intensities between samples, settings were fixed to the most highly stained sample with all other images acquired at those settings.
Results
A253 cells overexpress DPAGT1 and produce E-cadherin modified with complex N-glycans in nascent AJs
Tumor cells frequently exhibit decreased intercellular adhesion and aberrantly high N-glycosylation. Since DPAGT1 is a key regulator of cellular N-glycosylation, we first examined the relationship between DPAGT1 expression and E-cadherin adhesion in dense cultures of primary human oral karatinocytes, HOK cells, and human salivary epidermoid carcinoma, A253 cells. The inverse relationship between DPAGT1 and E-cadherin-mediated AJs (Fig. 1A, diagram) was supported by immunofluorescence staining of E-cadherin and Western blot (WB) assessment of DPAGT1 abundance. While in HOK cells, E-cadherin displayed organization at cell-cell borders, in A253 cells it had mostly cytoplasmic distribution (Fig. 1A, IF, arrows). This correlated with 2-fold higher DPAGT1 expression and greater molecular size of E-cadherin in A253 cells compared to HOK cells (Fig. 1A, WB). To determine if increased molecular size of E-cadherin in A253 cells was caused by increased N-glycosylation, we examined its sensitivity to glycanases, EndoH and PNGaseF. EndoH removes high mannose and hybrid N-glycans, while PNGaseF removes N-glycans at asparagine residues with the exception of complex N-glycans modified by fucose at the chitobiose core. Mobility shifts before and after EndoH and PNGaseF treatments showed that E-cadherin from HOK cells was EndoH-sensitive and thus contained primarily high mannose/hybrid N-glycans (Fig. 1B, lanes 1–3). E-cadherin from A253 cultures was mostly PNGaseF-sensitive, demonstrating that it was modified by complex N-glycans (Fig. 1B, lanes 4–6). Similar to A253 cells, OSCC of the tongue, CAL27 cells, also over-expressed DPAGT1 and hyperglycosylated E-cadherin (data not shown).
Fig. 1.

Salivary epidermoid carcinoma A253 cells produce extensively N-glycosylated E-cadherin and diminished intercellular adhesion. (A) Schematic representation of an inverse relationship between DPAGT1 expression and cell-cell adhesion was reflected in immunofluorescence localization of E-cad in dense HOK and A253 cultures (Size bars: 10 µm) and Western blot of DPAGT1, E-cadherin (E-cad) and ZO-1 expression. Bargraph, Fold changes in expression levels in A253 cells in comparison to HOK cells after normalization to actin. (B) Western blot of EndoH- or PNGaseF-treated E-cad from A253 and HOK cells. (C) Western blot of selected proteins in E-cad immunoprecipitates. Bargraph, Fold changes in expression levels in A253 cells in comparison to HOK cells after normalization to E-cad. (D) Western blot of selected proteins in ZO-1 immunoprecipitates. Bargraph, Fold change of occludin, claudin-1 and E-cadherin levels in A253 cells in comparison to HOK cells after normalization to ZO-1. All studies represent one of three independent experiments (*P<0.01; **P<0.005; ***P<0.001).
E-cadherin immunoprecipitates from A253 cells bound less AJ stabilizing components, γ-catenin and vinculin, and contained four times less PP2A, shown to be essential for AJ adhesive function (36)(Fig. 1C). In contrast, the abundance of IQGAP1, known to destabilize AJs (37), was increased in A253 cells (Fig. 1C).
A253 cells have compromised TJ function
In epithelial cells, formation of mature AJs has been shown to precede the assembly of TJs (38, 39). Overexpression of DPAGT1 in A253 cells correlated with a 2.4-fold decrease in the abundance of ZO-1 (Fig. 1A, WB), a scaffold protein that recruits occludin and claudins for TJ assembly. While in HOK cells, ZO-1 was in a complex with substantial amounts of occludin and claudin-1, this interaction was significantly diminished in A253 cells (Fig. 1D). Since claudins determine the barrier function of TJs, the low abundance of ZO-1/claudin-1 complexes indicated that A253 cells did not assemble stable TJs. This conclusion was supported by a greater interaction between E-cadherin and ZO-1 in A253 cells, known to mark nascent contacts (40). Furthermore, ZO-1 immunoprecipitates from A253 cells had more PP2A, shown to inhibit TJ assembly (Fig. 1D). This decreased association of ZO-1 with occludin and claudin-1 corresponded to reduced integrity of TJs, as determined by TER, a measure of paracellular permeability. After growth to high density for 72 h, A253 cells formed TJs that displayed a steady-state TER of 160 Ohm-cm2, a value significantly lower than a typical TER of > 260 Ohm-cm2 in HOK cell monolayers (Supplemental Fig. 1B) (41). Thus, changes in the molecular organization of AJs and TJs corresponded to reduced A253 cell TER.
Partial inhibition of DPAGT1 in A253 cells reduces E-cadherin N-glycosylation, stablizes AJs and enhances TJ function
Previously, we showed that hypoglycosylated E-cadherin variants formed more mature AJs than extensively N-glycosylated E-cadherin (19). Therefore, we tested the possibility of stabilizing AJs in A253 cells by reducing cellular N-glycosylation using siRNA to DPAGT1. Treatment of A253 cells with 200 nM siRNA (S) resulted in downregulation of DPAGT1 transcript levels by 45% and protein levels by 40% (Fig. 2A). E-cadherin from S cells exhibited faster mobility on SDS-PAGE compared to non-silenced (NS) cells (Fig. 2B, E-cad), suggesting that it was less N-glycosylated. E-cadherin junctional complexes from S cells contained more catenins and vinculin but less IQGAP1 compared to NS cells (Fig. 2B). Immunofluorescence localization of E-cadherin showed more co-localization with F-actin in S cells compared to NS cells (Fig. 2C, S, merge, arrow). We note that similar levels of biotinylated E-cadherin were detected in NS and S cells, indicating that diminished N-glycosylation did not affect the targeting of E-cadherin to the cell surface (data not shown).
Fig. 2.

Partial silencing of DPAGT1 enhances intercellular adhesion in A253 cells. (A). Effects of DPAGT1 siRNA (S) on DPAGT1 expression in NS and S cells. DPAGT1 transcript levels were measured by real-time PCR, and protein levels were determined by Western blot. Bargraph, Fold change of DPAGT1 abundance in S cells in comparison with NS cells after normalization to actin. (B) Western blot of associated proteins in E-cad immunoprecipitates from NS and S cells. Bargraph, Fold changes in expression levels in S cells in comparison to NS cells after normalization to E-cad. (C) Immunofluorescence localization of E-cad in NS and S cells. Cells were counterstained for F-actin with rhodamine-phalloidin to assess cytoarchitecture. Size bars: 20 µm. All studies represent results from three different experiments (*P<0.01; **P<0.005; ***P<0.001).
Importantly, S cell monolayers formed TJs that maintained TER of 210 Ohm-cm2, or 1.3-fold higher than NS cells (Supplemental Fig. 2A, TER), demonstrating that partial inhibition of DPAGT1 caused an increase in A253 cell TER. This treatment did not affect cell viability and did not induce an unfolded protein response (data not shown). Partial inhibition of DPAGT1 did, however, substantially reduce the number of disorganized cells that lacked contact inhibition (Supplemental Fig. 2B). This was associated with diminished proliferation, as indicated by an increase in S cell doubling time (Supplemental Fig. 2C). Thus, by reducing DPAGT1 expression, it is possible to diminish the N-glycosylation status of E-cadherin and to drive the formation of mature AJs and TJs in A253 cells.
Overexpression of DPAGT1 and defective intercellular adhesion are signatures of OSCC
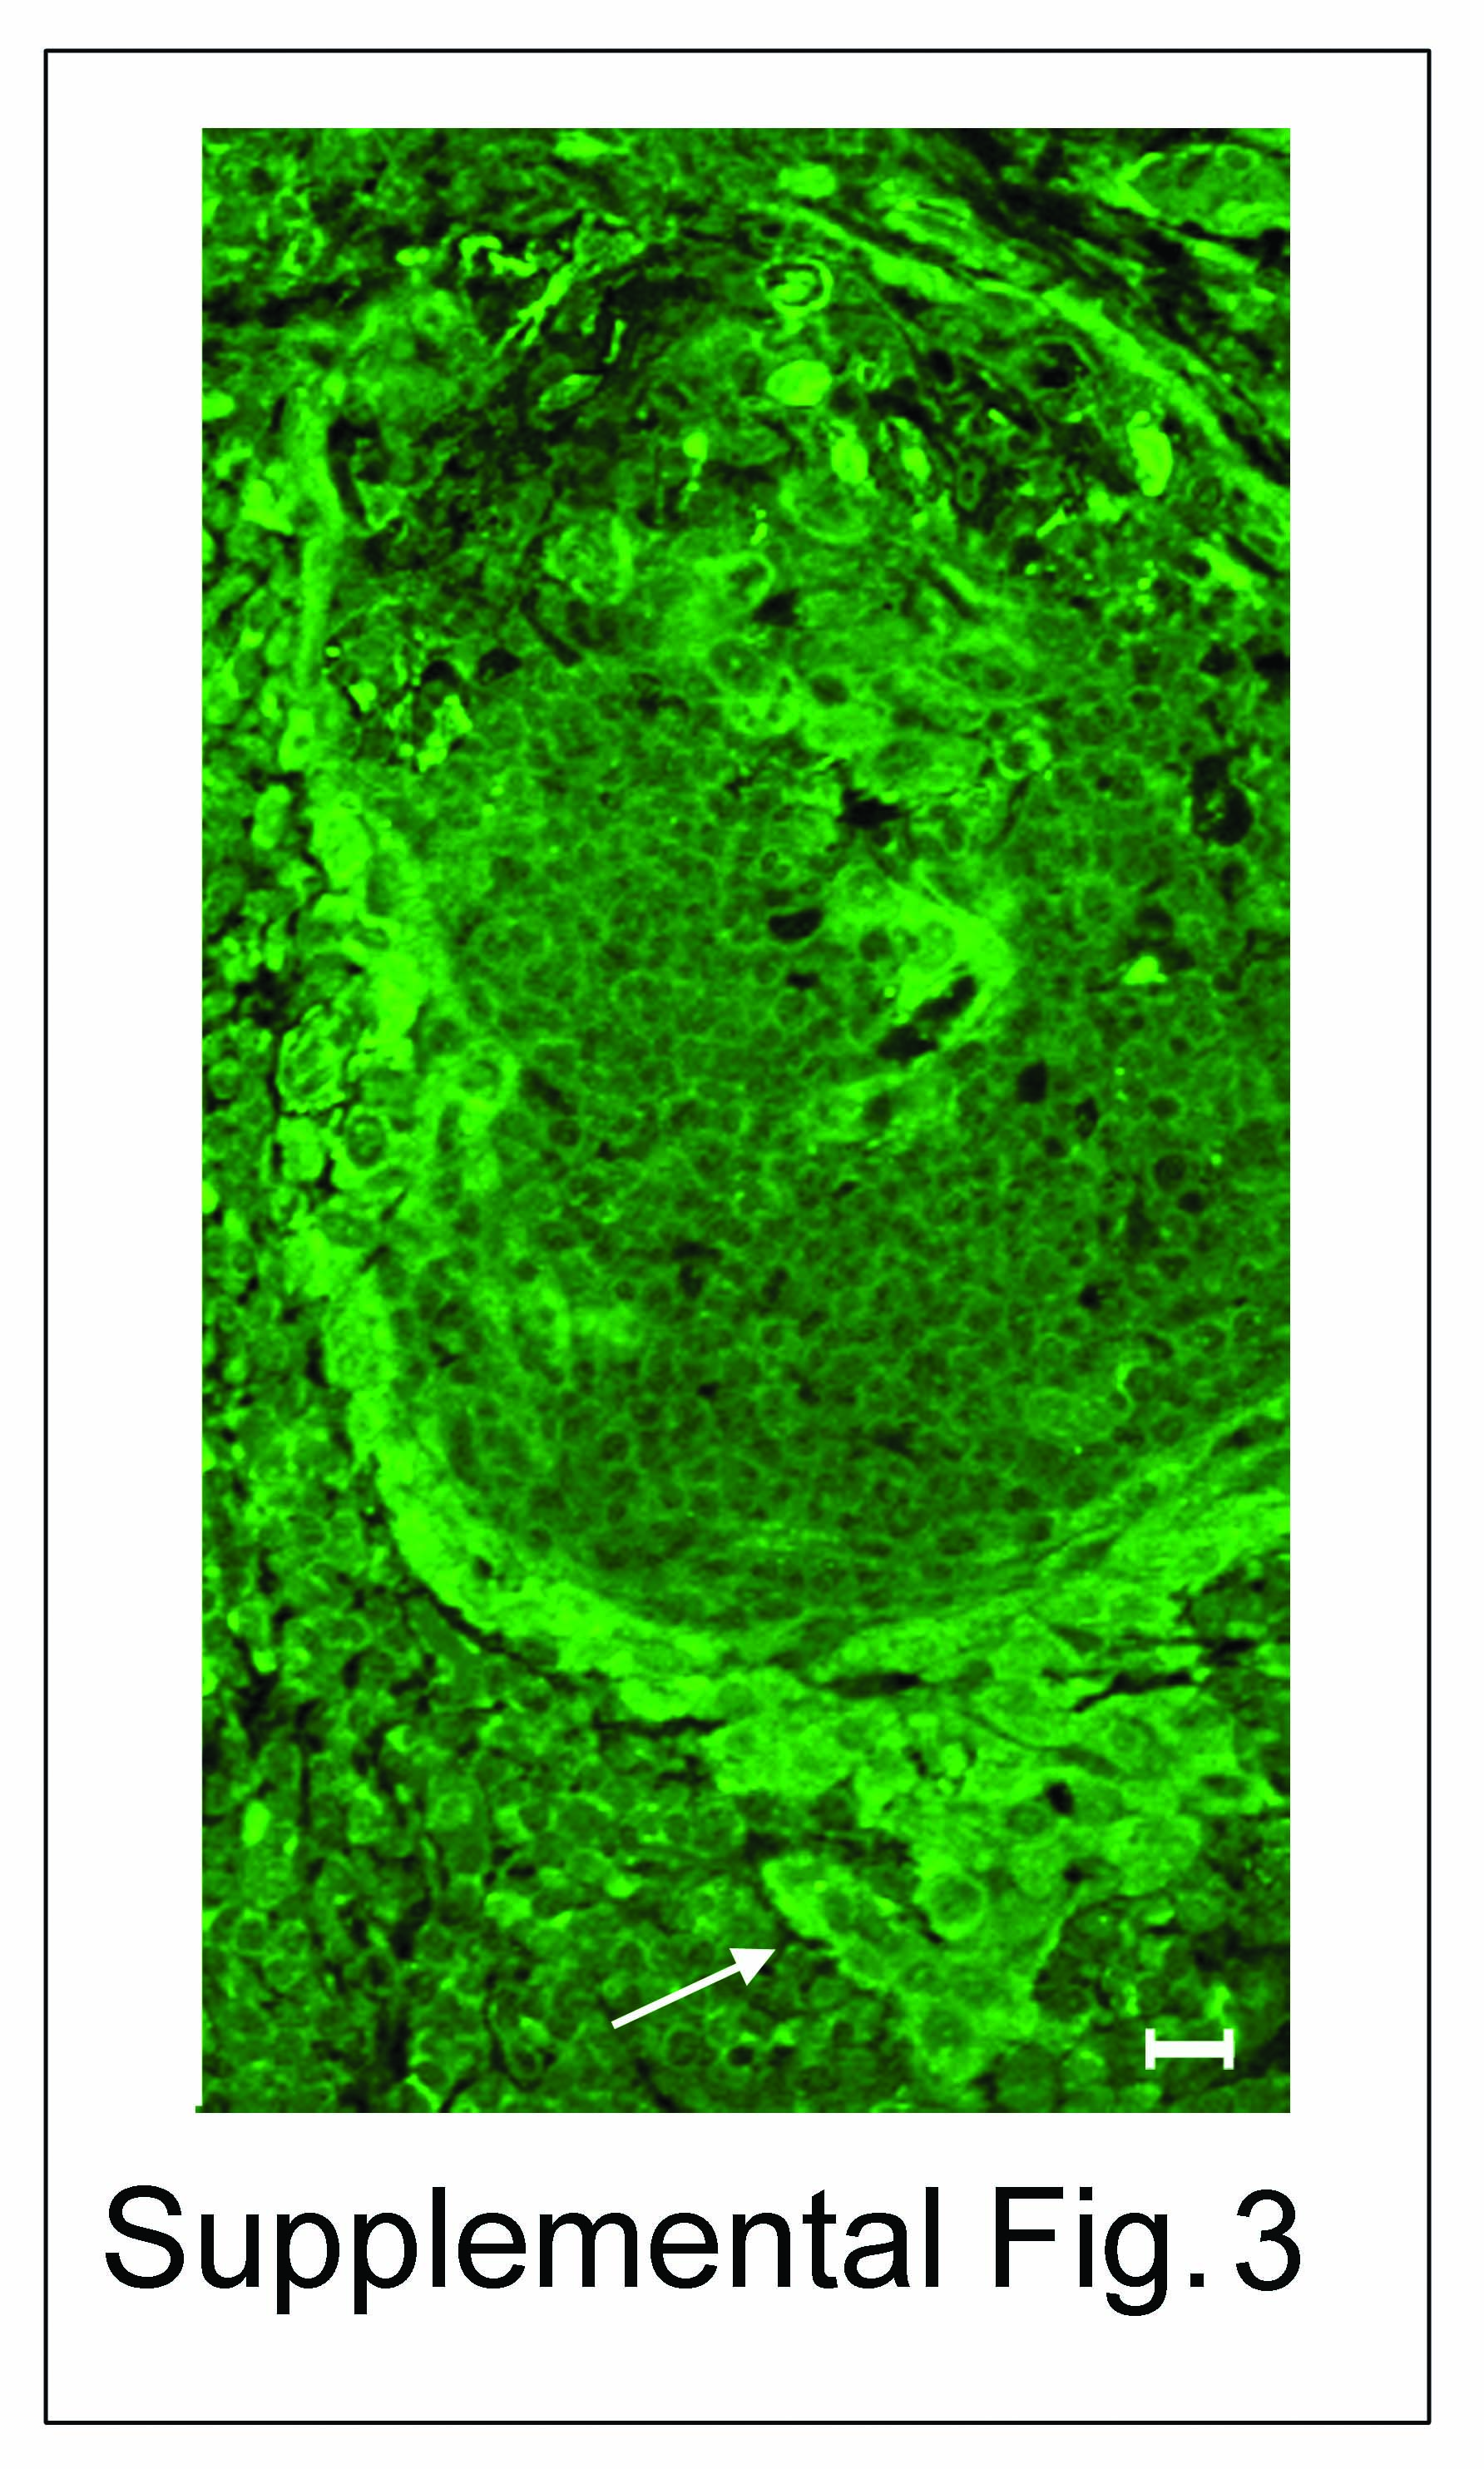
Since extensive N-glycosylation of E-cadherin in A253 cells prevented the formation of mature AJs and TJs, we examined whether a similar scenario was found in oral cancer tissues. Using nine archival specimens, we compared cytologically normal AE with OSCC for markers of proliferation, differentiation and N-glycosylation using Ki67, cytokeratin and DPAGT1, respectively. H&E staining of AE revealed characteristic maturation from the basal epithelial cell layer to the spinous cell layer with subtle surface parakeratosis (Fig. 3A, H&E, filled and unfilled arrows). Well and moderately differentiated OSCC, on the other hand, exhibited invasive nests and cords of atypical squamous epithelium (Fig. 3A, H&E, unfilled arrow) in addition to dyskeratosis, cellular pleomorphism and atypical mitotic figures (data not shown). In contrast to AE, where Ki67 was detected only in the basal cell layer, in OSCC it was distributed throughout the neoplasm (Fig. 3A, Ki67, arrow). Furthermore, cytokeratin was insignificant within the basal layer of AE, but abundant in the spinous and keratin layers, while in OSCC it displayed diminished staining within the spinous epithelium, indicating disruption of cellular maturation (Fig. 3A, cytokeratin, arrows). Prominent DPAGT1 staining was detected in the basal layer of AE, but was diminished in the cytodifferentiated cells of the spinous cell layer (Fig. 4A, AE, DPAGT1, filled and unfilled arrows). In contrast, OSCC exhibited prominent DPAGT1 expression that ceased to be restricted to the basal layer (Fig. 3A, OSCC, DPAGT1, arrow). In some tumor islands, intense DPAGT1 staining in the peripheral cell layer was associated with extensive cellular discohesion, suggesting that aberrantly high DPAGT1 expression was driving oral tumor spread (Supplemental Fig. 3). Thus, DPAGT1 expression was directly related to Ki67 but inversely to cytokeratin, demonstrating that it was a useful marker for dysregulated proliferation and differentiation during oral tumorigenesis (Fig. 3A, DPAGT1/cytokeratin, merge, arrows).
Fig. 3.

Overexpression of DPAGT1 and compromised intercellular adhesion are signatures of OSCC. (A) Comparison of H&E staining of AE and OSCC. Distinct basal cell layer (filled arrow) and characteristic stratification (unfilled arrow) were features of AE, while OSCC was marked by invasive epithelial islands displaying dyskeratosis and keratin pearls (unfilled arrow) with mild cytologic atypia and nuclear pleomorphism. Size bar: 50 µm. Immunofluorescence localization of Ki67, cytokeratin and DPAGT1. In AE, Ki67 was prominent in the basal cell layer (arrow), while in OSCC it was detected throughout the invasive epithelium (arrow). Cytokeratin was insignificant in the basal layer of AE (filled arrow) and increased in intensity with cellular maturation (unfilled arrow); in OSCC, cytokeratin staining was markedly reduced (arrow). In AE, DPAGT1 staining was most intense in the basal layer (filled arrow) being diminished in stratified regions (unfilled arrow); in OSCC, DPAGT1 expression was extensive throughout the invasive tumor islands (arrow). Merged images of cytokeratin (unfilled arrow) and DPAGT1 (filled arrow) in AE and in OSCC highlighted their inverse relationship. Size bars: 20 µm. (B) Immunofluorescence localization of E-cad and associated catenins. Sections were either doubly immunostained for E-cad and α-catenin or for β-catenin only. In AE, E-cad and α-catenin were at cell-cell borders (arrows, insets) while in OSCC, E-cad displayed more punctate staining and α-catenin was diffuse (arrows, insets). Immunostaining of β-catenin did not appear greatly altered between AE and OSCC. Size bar: 20 µm. (C) Immunolocalization of ZO-1. ZO-1 was detected at cell-cell borders in AE (arrow), but was significantly diminished at these sites in OSCC. Size bars: 5 µm. Results represent one of three independent experiments.
Fig. 4.

OSCC exhibits overexpression of DPAGT1 and aberrantly N-glycosylated E-cadherin in nascent AJs. (A) Western blot of DPAGT1, E-cad and ZO-1 expression and immunofluorescence localization of DPAGT1 in AE and well-differentiated OSCC. Bargraph, Fold changes in DPAGT1, E-cad and ZO-1 in OSCC levels in comparison to AE after normalization to actin. Overexpression of DPAGT1 in OSCC correlated with a loss of differentiation-dependent immunofluorescence localization. Size bar: 25 µm. (B) Western blot of EndoH- or PNGaseF-treated E-cad from AE and OSCC. (C) Western blot of proteins in E-cad immunoprecipitates and their immunofluorescence localization in AE and OSCC. Bargraph, Fold changes of γ-catenin, α-catenin, vinculin, IQGAP1 and PP2A levels in OSCC in comparison to AE after normalization to E-cad. Immunofluorescence localization of E-cad, α-catenin and IQGAP1 confirmed that while in AE, E-cad and α-catenin were organized at cell-cell borders (arrows, insets), but in OSCC both exhibited diffuse staining (arrows, insets). IQGAP1 was better organized at cell-cell contacts in OSCC than in AE (unfilled arrows). Size bar: 20 µm. (D) Western blot of PP2A in ZO-1 immunoprecipitates and immunofluorescence localization of ZO-1 in AE and OSCC. Bargraph, Fold change of PP2A OSCC level in comparison to AE after normalization to ZO-1. Increased interaction between ZO-1 and PP2A in OSCC correlated with its diminished organization at cell-cell contact sties. Size bar: 10 µm. Results represent one of three independent experiments (*P<0.01; ***P<0.001).
Although E-cadherin was present at cell-cell interfaces in OSCC, its pattern was frequently more diffuse compared to AE, suggesting that it formed nascent AJs (Fig. 3B, E-cadherin, arrows, insets). Double staining for E-cadherin and α-catenin revealed that altered immunostaining patterns of E-cadherin correlated with a virtual loss of α-catenin from cell-cell contact sites (Fig. 3B, α-catenin, arrows, insets), while β-catenin remained unaltered (Fig. 3B, β-catenin). Thus, examination of nine archival cases of OSCC showed that increased cellular proliferation and loss of differentiation were associated with overexpression of DPAGT1 and compromised E-cadherin adhesion (Table 1). Furthermore, immunofluorescence staining for ZO-1 showed that it was mislocalized in OSCC, indicating lack of TJs (Fig. 3C, ZO-1, arrow).
Table 1.
Quantification of DPAGT1, E-cadherin and α-catenin staining
| marker | AE | OSCC | ||
|---|---|---|---|---|
| DAPGT1 | basal | suprabasal | basement membrane area | tumor body area |
| (n=75) | 205 (2,16,57) | 99 (60,6,9) | 221 (1,2,72) | 206 (2,12,61) |
| E-cadherin | cytosol | plasma membrane | cytosol | plasma membrane |
| (n=75) | 87 (63,12,0) | 218 (1,6,68) | 159 (6,54,15) | 132 (21,51,3) |
| α-catenin | cytosol | plasma membrane | cytosol | plasma membrane |
| (n=75) | 93 (58,16,1) | 210 (3,9,63) | 147 (11,62,2) | 115 (39,32,4) |
n, number of analyzed cells; numbers in parentheses indicate number of samples positive at different intensities (+1, +2, +3)
OSCC produces extensively N-glycosylated E-cadherin, nascent AJs and unstable TJs
To validate the relationship between overexpression of DPAGT1 and loss of intercellular adhesion in OSCC, we carried out biochemical analyses of E-cadherin N-glycosylation status and the composition of AJs and TJs in freshly resected tissues from three patients with moderately differentiated OSCC of the lateral tongue border. DPAGT1 abundance was 4-fold greater in OSCC compared to AE (Fig. 4A, WB), with all invasive tumor islands exhibiting high DPAGT1 immunofluorescence staining (Fig. 4A, IF, OSCC, DPAGT1, arrow). In contrast, DPAGT1 expression in AE was differentiation-dependent (Fig. 4A, IF, AE, DPAGT1, filled and unfilled arrows).
E-cadherin from OSCC migrated with a higher molecular size (Fig. 4B) due to increased modification with complex N-glycans, based on EndoH and PNGaseF treatments (Fig. 4C, lanes 1, 3 and 4, 6, filled and unfilled arrows). Moreover, E-cadherin immunoprecipitates from OSCC exhibited diminished association with α-catenin, γ-catenin and vinculin but a 2-fold greater association with IQGAP1 compared to AE (Fig. 4C). Also, there was less PP2A in complex with E-cadherin in OSCC than in AE (Fig. 4C). These biochemical studies linked the overexpression of DPAGT1 to increased N-glycosylation of E-cadherin and compromised intercellular adhesion in OSCC. Similar to archival specimens, fresh OSCC tissues displayed more diffuse immunofluorescence localization of E-cadherin that correlated with a pronounced cytoplasmic localization of α-catenin, indicating diminished junctional organization (Fig. 4C, IF, arrows, insets). This was coincident with increased organization of IQGAP1 at cell-cell borders, suggesting that in OSCC, AJs were destabilized by the replacement of α-catenin with IQGAP1 (Fig. 4C, IF, arrows). In addition, more PP2A was found in complex with ZO-1 in OSCC than in AE (Fig. 4D). Hence, excessive N-glycosylation of E-cadherin in OSCC was associated with diminished binding of PP2A to AJs and an increased association of PP2A with ZO-1. Accordingly, expression of ZO-1 was reduced by 60% (Fig. 4A, WB) and greatly diminished at the sites of TJs (Fig. 4D, IF, arrow).
Discussion
Aberrant N-glycosylation has been associated with virtually all types of cancers (34, 42). Likewise, loss of intercellular adhesion has been a hallmark of tumor progression to metastasis. The present study reveals a mechanism for how inappropriate upregulation of a metabolic pathway of protein N-glycosylation is deleterious to oral epithelial homeostasis and a likely cause of disrupted intercellular adhesion in OSCC.
Our results indicate that a subset of oral cancer cases overexpresses DPAGT1 and produces extensively N-glycosylated E-cadherin. OSCC of well to moderate histologic grade exhibited abundant DPAGT1 expression throughout the neoplasm. Biochemical analyses revealed that overexpression of DPAGT1 was associated with extensive modification of E-cadherin with complex N-glycans. Characterization of E-cadherin scaffolds confirmed that tumor tissues were impaired in the formation of mature AJs, displaying diminished association with γ-catenin, α-catenin and vinculin. The cadherin-dependent tumor-suppressive functions of γ-catenin and vinculin have been described before (43, 44). Likewise, the involvement of α-catenin in tumor suppression has been shown to be a prognostic indicator of metastasis and survival (45). Thus, our results support the important roles of γ-catenin, α-catenin and vinculin in the maintenance of intercellular adhesion in oral epithelia and suggest that it is through their recruitment to AJs that N-glycans regulate, in part, E-cadherin’s tumor suppressive function. Interestingly, while the association of α-catenin with E-cadherin junctions was diminished in OSCC, the abundance of IQGAP1 was dramatically increased. Since IQGAP1 associates with E-cadherin complexes by competing with α-catenin for the binding to β-catenin, its increased recruitment to AJs in OSCC may be responsible, in part, for the diminished α-catenin binding to E-cadherin complexes. Another protein whose association with AJs was reduced in oral cancer cells and tissues was PP2A. PP2A has been shown to enhance AJ function and to inhibit TJ assembly (46, 47). Therefore, in oral tumorigenesis, E-cadherin N-glycans appear to destabilize AJs through their inhibitory effect on the recruitment of PP2A. Diminished association of PP2A with AJs is likely to promote the interaction between PP2A to ZO-1 and other TJ components, leading to TJ inhibition. Taken together, these studies indicate that N-glycosylation can be a determinant of E-cadherin’s tumor suppressor function in vivo.
Although the precise mechanism of how N-glycans inhibit E-cadherin’s ability to form mature AJs remains unclear, our studies provide the first molecular explanation for the observed impact of N-glycosylation on intercellular adhesion. It is possible that through steric hindrance, N-glycans interfere with the dimerization of E-cadherin’s extracellular domains and homotypic bond formation. In this scenario, removal of N-glycans would facilitate homotypic interactions and lead to conformational changes transduced in cis to the cytoplasmic region to promote association with various components of AJs.
We note that although partial knockdown of DPAGT1 in A253 cells was likely to affect numerous cell surface receptors, this study focused on E-cadherin because its hypoglycosylated variant V13 has been shown to enhance cell-cell adhesion in a manner similar to siRNA knockdown (19).
While the underlying causes for overexpression of DPAGT1 in A253 cells and OSCC are unknown, our studies show that it is possible to downregulate DPAGT1 with siRNA to effectively reduce N-glycosylation capacity of cells and increase intercellular adhesion. A model summarizing these conclusions is shown in Figure 5. It is possible that partial inhibition of DPAGT1 will prove to be a useful functional approach for enhancing intercellular adhesion not only in OSCC but also in other epithelial tumors.
Fig. 5.

Schematic representation of how partial silencing of DPAGT1 enhances intercellular adhesion in cancer cells. Overexpression of DPAGT1 in cancer cells produces E-cad extensively modified with complex N-glycans that is unable to form mature AJs and prevents the assembly of TJs. Attenuation of DPAGT1 expression reduces N-glycosylation of E-cad with complex N-glycans and leads to the remodeling and stabilization of AJs and to the formation of functional TJs. Diminished DPAGT1 expression and enhanced intracellular adhesion revert the cancer phenotype to a more organized epithelial morphology.
Supplementary Material
Acknowledgments
Grant support: NIH/NIDCR grants 5RO1 DE010183 and RO1 DE015304 (M.A.K) and R24 EY 014798-04 (to A. Sue Menko).
References
- 1.Gumbiner B, Stevenson B, Grimaldi A. The role of the cell adhesion molecule uvomorulin in the formation and maintenance of the epithelial junctional complex. J Cell Biol. 1988;107:1575–1587. doi: 10.1083/jcb.107.4.1575. [DOI] [PMC free article] [PubMed] [Google Scholar]
- 2.Wheelock MJ, Johnson KR. Cadherins as modulators of cellular phenotype. Ann Rev Cell Dev Biol. 2003;19:207–235. doi: 10.1146/annurev.cellbio.19.011102.111135. [DOI] [PubMed] [Google Scholar]
- 3.Gumbiner BM. Cell adhesion: the molecular basis of tissue architercture and morphogenesis. Cell. 1996;84:345–357. doi: 10.1016/s0092-8674(00)81279-9. [DOI] [PubMed] [Google Scholar]
- 4.Jamora C, Fuchs E. Intercellular adhesion, signalling and the cytoskeleton. Nat Cell Biol. 2002;4:101–108. doi: 10.1038/ncb0402-e101. [DOI] [PubMed] [Google Scholar]
- 5.Chen H, Paradies NE, Fedor-Chaliken M, Brackenbury R. E-cadherin mediates adhesion and suppresses cell motility via distinct mechanisms. J Cell Sci. 1997;110:345–356. doi: 10.1242/jcs.110.3.345. [DOI] [PubMed] [Google Scholar]
- 6.Lecuit T, Lenne PF. Cell surface mechanics and the control of cell shape, tissue patterns and morphogenesis. Nat Rev Mol Cell Biol. 2007;8:633–644. doi: 10.1038/nrm2222. [DOI] [PubMed] [Google Scholar]
- 7.Mays RW, Nelson WJ, Marrs JA. Generation of epithelial cell polarity: roles for protein trafficking, membrane-cytoskeleton, and E-cadherin-mediated cell adhesion. Cold Spring Harb Symp Quant Biol. 1995;60:763–773. doi: 10.1101/sqb.1995.060.01.082. [DOI] [PubMed] [Google Scholar]
- 8.Halbleib JM, Nelson WJ. Cadherins in development: cell adhesion, sorting , and tissue morphogenesis. Genes Dev. 2006;20:3199–3214. doi: 10.1101/gad.1486806. [DOI] [PubMed] [Google Scholar]
- 9.Birchmeier W, Behrens J. Cadherin expression in carcinomas: role in the formation of cell junctions and the prevention of invasiveness. Biochim Biophys Acta. 1994;1198:11–26. doi: 10.1016/0304-419x(94)90003-5. [DOI] [PubMed] [Google Scholar]
- 10.Yap AS, Briecher WM, Pruschy M, Gumbiner BM. Lateral clustering of the adhesive ectodomain: a fundamental determinant of cadherin function. Curr Biol. 1997;7:308–315. doi: 10.1016/s0960-9822(06)00154-0. [DOI] [PubMed] [Google Scholar]
- 11.Gumbiner BM. Regulation of cadherin adhesive activity. J Cell Biol. 2000;148:399–404. doi: 10.1083/jcb.148.3.399. [DOI] [PMC free article] [PubMed] [Google Scholar]
- 12.Drees F, Pokutta S, Yamada S, Nelson WJ, Weis WI. Alpha-catenin is a molecular switch that binds E-cadherin-beta-catenin and regulates actin filament assembly. Cell. 2005;123:903–915. doi: 10.1016/j.cell.2005.09.021. [DOI] [PMC free article] [PubMed] [Google Scholar]
- 13.Yamada S, Pokutta S, Drees F, Weis WI, Nelson WJ. Deconstructing the cadherin-catenin-actin complex. Cell. 2005;123:889–901. doi: 10.1016/j.cell.2005.09.020. [DOI] [PMC free article] [PubMed] [Google Scholar]
- 14.Watabe-Hchida M, Uchida N, Imamura Y, et al. Alpha-Catenin-vinculin interaction functions to organize the apical junctional complex in epithelial cells. J Cell Biol. 1998;142:847–857. doi: 10.1083/jcb.142.3.847. [DOI] [PMC free article] [PubMed] [Google Scholar]
- 15.Perez-Moreno M, Jamora C, Fuchs E. Sticky business: orchestrating cellular signals at adherens junctions. Cell. 2003;112:535–548. doi: 10.1016/s0092-8674(03)00108-9. [DOI] [PubMed] [Google Scholar]
- 16.Yoshimura M, Ihara Y, Matsuzuwa Y, Taniguchi N. Aberrant glycosylation of E-cadherin enhances cell-cell binding to suppress metastasis. J Biol Chem. 1996;271:13811–13815. doi: 10.1074/jbc.271.23.13811. [DOI] [PubMed] [Google Scholar]
- 17.Kitada T, Miyoshi E, Noda K, et al. The addition of bisecting N-acetylglucosamine residues to E-cadherin down-regulates the tyrosine phosphorylation of β-catenin. J Biol Chem. 2001;276:475–480. doi: 10.1074/jbc.M006689200. [DOI] [PubMed] [Google Scholar]
- 18.Vagin O, Tokhtaeva E, Yakubov I, Shevchenko E, Sachs G. Inverse Correlation between the Extent of N-Glycan Branching and Intercellular Adhesion in Epithelia: CONTRIBUTION OF THE Na,K-ATPase 1 SUBUNIT. J Biol Chem. 2008;283:2192–2202. doi: 10.1074/jbc.M704713200. [DOI] [PMC free article] [PubMed] [Google Scholar]
- 19.Liwosz A, Lei T, Kukuruzinska MA. N-glycosylation affects the molecular organization and stability of E-cadherin junctions. J Biol Chem. 2006;281:23138–23149. doi: 10.1074/jbc.M512621200. [DOI] [PubMed] [Google Scholar]
- 20.Mendelsohn RD, Helmerhorst E, Cipollo JF, Kukuruzinska MA. A hypomorphic allele of the first N-glycosylation gene, ALG7, causes mitochondrial defects in yeast. Biochim Biophys Acta. 2005;1723:33–44. doi: 10.1016/j.bbagen.2005.01.017. [DOI] [PubMed] [Google Scholar]
- 21.Wu X, Rush JS, Karaoglu D, et al. Deficiency of UDP-GlcNAc:Dolichol Phosphate N-Acetylglucosamine-1 Phosphate Transferase (DPAGT1) causes a novel congenital disorder of Glycosylation Type Ij. Hum Mutat. 2003;22:144–150. doi: 10.1002/humu.10239. [DOI] [PubMed] [Google Scholar]
- 22.Fernandes RP, Cotanche DA, Lennon-Hopkins K, Erkan F, Menko AS, Kukuruzinska MA. Differential expression of proliferative, cytoskeletal, and adhesive proteins during postnatal development of the hamster submandibular gland. Histochem Cell Biol. 1999;111:153–162. doi: 10.1007/s004180050345. [DOI] [PubMed] [Google Scholar]
- 23.Sakaki T, Wato M, Tamura I, et al. Correlation of E-cadherin and alpha-catenin expression with differentiation of oral squamous cell carcinoma. J Osaka Dent Univ. 1999;33:75–81. [PubMed] [Google Scholar]
- 24.Downer SC, Speight PM. E-cadherin expression in normal, hyperplastic and malignant oral epithelium. Eur J Cancer. 1993;29:303–305. doi: 10.1016/0964-1955(93)90053-h. [DOI] [PubMed] [Google Scholar]
- 25.Schipper JH, Frixen UH, Behrens J, Unger A, Jahnke K, Birchmeier W. E-cadherin expression in squamous cell carcinomas of head and neck: inverse correlation with tumor dedifferentiation and lymph node metastasis. Cancer Res. 1991;51:6328–6337. [PubMed] [Google Scholar]
- 26.Doki Y, Shiozaki H, Tahara H, et al. Correlation between E-cadherin expression and invasiveness in vitro in a human esophageal cancer cell line. Cancer Res. 1993;15:3421–3426. [PubMed] [Google Scholar]
- 27.Thomas GJ, Speight PM. Cell adhesion molecules and oral cancer. Crit Rev Oral Biol Med. 2001;12:479–498. doi: 10.1177/10454411010120060301. [DOI] [PubMed] [Google Scholar]
- 28.Diniz-Freitas M, Garcia-Caballero T, Antunez-Lopez J, Gandara-Rey JM, Garcia-Garcia A. Reduced E-cadherin expression is an indicator of unfavourable prognosis in oral squamous cell carcinoma. Oral Oncol. 2006;42:190–200. doi: 10.1016/j.oraloncology.2005.07.010. [DOI] [PubMed] [Google Scholar]
- 29.Tanaka N, Odajima T, Ogi K, Ikeda T, Satoh M. Expression of E-cadherin, alpha-catenin, and beta-catenin in the process of lymph node metastasis in oral squamous cell carcinoma. Br J Cancer. 2003;89:557–563. doi: 10.1038/sj.bjc.6601124. [DOI] [PMC free article] [PubMed] [Google Scholar]
- 30.Guo HB, Lee I, Kamar M, Pierce M. N-acetylglucosaminyltransferase V expression levels regulate cadherin-associated homotypic cell-cell adhesion and intracellular signaling pathways. J Biol Chem. 2003;278:52412–52424. doi: 10.1074/jbc.M308837200. [DOI] [PubMed] [Google Scholar]
- 31.Lau KS, Partridge EA, Grigorian A, et al. Complex N-glycan number and degree of branching cooperate to regulate cell proliferation and differentiation. Cell. 2007;129:123–134. doi: 10.1016/j.cell.2007.01.049. [DOI] [PubMed] [Google Scholar]
- 32.Guo HB, Lee I, Kamar M, Akiyama SK, Pierce M. Aberrant N-glycosylation of beta1 integrin causes reduced alpha5beta1 integrin clustering and stimulates cell migration. Cancer Res. 2002;62:6837–6845. [PubMed] [Google Scholar]
- 33.Dabelsteen E, Clausen H, Mandel U. Carbohydrate changes in squamous cell carcinomas. APMIS Suppl. 1992;100:130–138. [PubMed] [Google Scholar]
- 34.Dennis JW, Granovsky M, Warren CE. Glycoprotein glycosylation and cancer progression. Biochim Biophys Acta. 1999;1473:21–34. doi: 10.1016/s0304-4165(99)00167-1. [DOI] [PubMed] [Google Scholar]
- 35.Guo HB, Randolph M, Pierce M. Inhibition of a specific N-glycosylation activity results in attenuation of breast carcinoma cell invasiveness-related phenotypes: inhibition of epidermal growth factor-induced dephosphorylation of focal adhesion kinase. J Biol Chem. 2007;282:22150–22162. doi: 10.1074/jbc.M611518200. [DOI] [PubMed] [Google Scholar]
- 36.Suzuki K, Takahashi K. Induction of E-cadherin endocytosis by loss of protein phosphatase 2A expression in human breast cancers. Biochem Biophys Res Commun. 2006;349:255–260. doi: 10.1016/j.bbrc.2006.08.037. [DOI] [PubMed] [Google Scholar]
- 37.Kuroda S, Fukata M, Nakagawa M, et al. Role of IQGAPI, a target of the small GTPases Cdc42 and Rac1, in regulation of E-cadherin-mediated cell-cell adhesion. Sci. 1998;281:832–835. doi: 10.1126/science.281.5378.832. [DOI] [PubMed] [Google Scholar]
- 38.Tunggal JA, Helfrich I, Schmitz A, et al. E-cadherin is essential for in vivo epidermal barrier function by regulating tight junctions. EMBO J. 2005;24:1146–1156. doi: 10.1038/sj.emboj.7600605. [DOI] [PMC free article] [PubMed] [Google Scholar]
- 39.Hartsock A, Nelson WJ. Adherens and tight junctions: structure, function and connections to the actin cytoskeleton. Biochim Biophys Acta. 2008;1778:660–669. doi: 10.1016/j.bbamem.2007.07.012. [DOI] [PMC free article] [PubMed] [Google Scholar]
- 40.Rajasekaran AK, Hojo M, Huima T, Rodriguez-Boulan E. Catenins and zonula occludens-1 form a complex during early stages in the assembly of tight junctions. J Cell Biol. 1996;132:451–463. doi: 10.1083/jcb.132.3.451. [DOI] [PMC free article] [PubMed] [Google Scholar]
- 41.Pollack AL, Apodaca G, Mostov KE. Hepatocyte growth factor induces MDCK cell morphogenesis without causing loss of tight junction functional integrity. Am J Physiol Cell Physiol. 2004;286:C482–C494. doi: 10.1152/ajpcell.00377.2003. [DOI] [PubMed] [Google Scholar]
- 42.Zhao YY, Takahashi M, Gu JG, et al. Functional roles of N-glycans in cell signaling and cell adhesion in cancer. Cancer Sci. 2008;99:1304–1310. doi: 10.1111/j.1349-7006.2008.00839.x. [DOI] [PMC free article] [PubMed] [Google Scholar]
- 43.Simcha I, Geiger B, Yehuda-Levenberg S, Salomon D, Ben-Ze'ev A. Suppression of tumorigenicity by plakoglobin: an augmenting effect of N-cadherin. J Cell Biol. 1996;133:199–209. doi: 10.1083/jcb.133.1.199. [DOI] [PMC free article] [PubMed] [Google Scholar]
- 44.Subauste MC, Nalban P, Adamson ED, Hahn KM. Vinculin controls PTEN protein level by maintaining the interaction of the adherens junction protein β-catenin with the scaffolding protein MAGI-2. J Biol Chem. 2005;280:5676–5681. doi: 10.1074/jbc.M405561200. [DOI] [PubMed] [Google Scholar]
- 45.Benjamin JM, Nelson WJ. Bench to bedside and back again: molecular mechanisms of alpha-catenin function and roles in tumorigenesis. Semin Cancer Biol. 2008;18:53–64. doi: 10.1016/j.semcancer.2007.08.003. [DOI] [PMC free article] [PubMed] [Google Scholar]
- 46.Sontag JM, Sontag E. Regulation of cell adhesion by PP2A and SV40 small tumor antigen: an important link to cell transformation. Cell Mol Life Sci. 2006;63:2979–2991. doi: 10.1007/s00018-006-6300-7. [DOI] [PMC free article] [PubMed] [Google Scholar]
- 47.Nunbhakdi-Craig V, Machleidt T, Ogris E, Bellotto D, White CL, III, Sontag E. Protein phosphatase 2A associates with and regulates atypical PKC and the epithelial tight junction complex. J Cell Biol. 2002;158:967–978. doi: 10.1083/jcb.200206114. [DOI] [PMC free article] [PubMed] [Google Scholar]
Associated Data
This section collects any data citations, data availability statements, or supplementary materials included in this article.