Abstract
Compound 5 ([5-(3-nitrophenoxy)-1,3-dioxo-1,3-dihydro-2-isoindol-2-yl]acetic acid) was identified as a weak selective LPA3 antagonist (IC50=4504 nM) in a virtual screening effort to optimize a dual LPA2&3 antagonist. Structure-based drug design techniques were used to prioritize similarity search matches of compound 5. This strategy rapidly identified 10 novel antagonists. The two most efficacious compounds identified inhibit activation of the LPA3 receptor by 200 nM LPA with IC50 values of 752 nM and 2992 nM. These compounds additionally define changes to our previously reported pharmacophore that will improve its ability to identify more potent and selective LPA3 receptor antagonists. The results of the combined computational and experimental screening are reported.
1. Introduction
LPA receptors comprise a family of eight G protein-coupled receptors (GPCRs), made of two subclasses (endothelial differentiation gene (EDG) and purinergic like receptors).1-4 These receptors play pathological and physiological roles regulating cell proliferation, migration, and survival.5 LPA receptors have been implicated in diseases that include breast cancer and cardiovascular disease.5-8 Bioactive molecules targeting LPA receptors have explored due to the potential therapeutic value of such compounds.9-18 The majority of these compounds have been evaluated only at receptors in the EDG subclass, LPA1-3, due to their earlier association with LPA signaling. Among LPA receptors in the EDG subclass, both LPA2 and LPA3 have restricted expression patterns, whereas LPA1 is broadly expressed.6 LPA2 is found in the nervous tissue, kidney, testis, lung, and prostate. LPA3 is found in the testis, prostate, heart, brain, lung, and kidney. Selective bioactive molecules for these receptors offer therapeutic potential for several diseases.5, 6, 17, 19
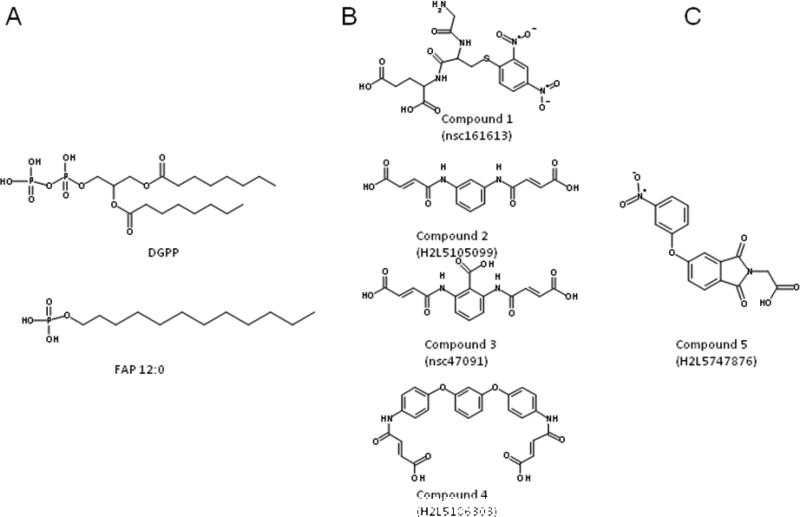
During previous virtual screening efforts, several novel antagonists were identified.11 Identification of these antagonists relied upon a rhodopsin-based homology model of the LPA3 receptor previously developed to study interactions of the binding site with known LPA antagonists.20 Based on these interactions, we defined a three-point pharmacophore consisting of an anionic and two hydrophobic sites. Matches to the pharmacophore were further analyzed using flexible docking before selection of candidates for experimental screening. Antagonists identified from virtual screening using the pharmacophore and subsequent similarity searching were diverse in structure and had nanomolar potency (Table 1 and Figure 1 panel B).11 These differed from previously reported LPA antagonists which had lipid-like structures (Figure 1 panel A).9, 21
Table 1.
Previously reported LPA antagonists identified using structure-based approaches. NE no effect
| Antagonists | IC50 (nM) | ||||
|---|---|---|---|---|---|
| LPA1 | LPA2 | LPA3 | LPA4 | LPA5 | |
| Compound 1 | NE | NE | 24 Imax = 69.8% |
NE | NE |
| Compound 2 | 220 | 22 | NE | NE | NE |
| Compound 3 | NE | 355 Imax = 53.3% |
30 Imax = 81.7% |
NE | NE |
| Compound 4 | 27354 | 9 | 1230 | NE | NE |
| Compound 5 | NE | NE | 4504 Imax = 50% |
NE | NE |
Figure 1.
Structures of reported lipid (panel A) and non-lipid (panel B) LPA antagonists. Similarity search target, compound 5 (panel C).
The structure activity relationship (SAR) has been previously reviewed and is briefly summarized here. LPA antagonists were initially developed via changes to the polar head group and altering the length and number of hydrophobic chains present in the glycerol backbone.21 This is the case for DGPP, a nonselective LPA antagonist. DGPP possesses a pyrophosphate headgroup and two hydrocarbon chains rather than a phosphate headgroup and one hydrocarbon chain, as in LPA. Many of the earlier LPA antagonists were described prior to the identification of the newest LPA GPCR family members. Thus the true selectivity of these compounds remains an open question. Compound 1 is the only reported LPA3-selective compound to be tested on the LPA1-5 receptors11, instead of only LPA1-3.
Compound 5 (Figure 1 panel C) emerged as a selective partial antagonist from virtual screening optimizing an LPA2 and LPA3 antagonist. In this present work we use our virtual screening workflow to rapidly identify additional LPA3 antagonists. Two compounds with 1.5- and 6-fold improvements in potency and improved efficacy from 50% to 100% inhibition of the LPA response over compound 5 were identified; however selectivity was reduced.
2. Results & Discussion
2.1. Database searching identifies similar analogs
Compound 5 was found to be a weak selective LPA3 antagonist (IC50=4504 nM). while screening using the pthalamide scaffold. We began to search for more potent and efficacious LPA3 antagonists by 2D similarity searching using compound 5 for our search query. Similarity searching at an 80% threshold produced 183 matches. Compounds were selected for docking that maintained three moieties from compound 5; the phenyl ring, phthalimide, and the anionic group. This reduced the 183 matches to 42 compounds for virtual screening. The structures were then downloaded and prepared for docking.
2.2. Flexible docking
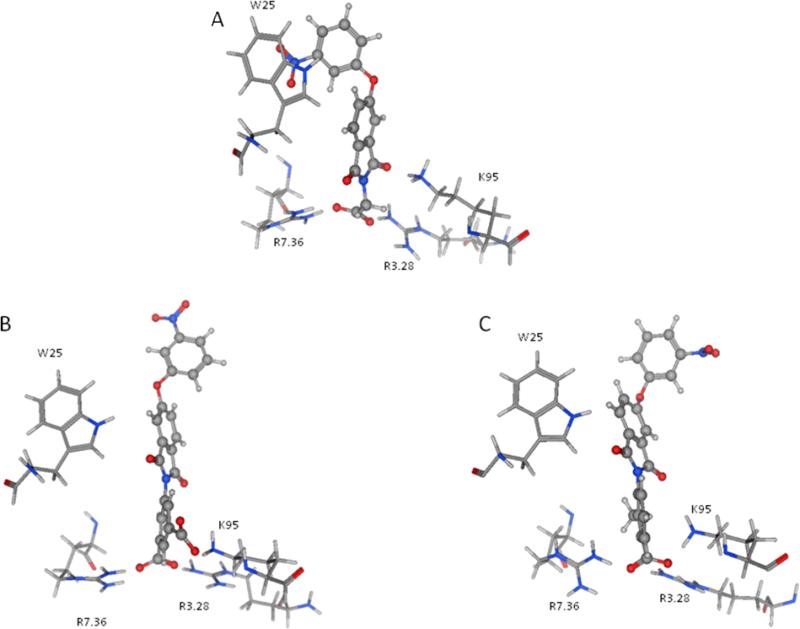
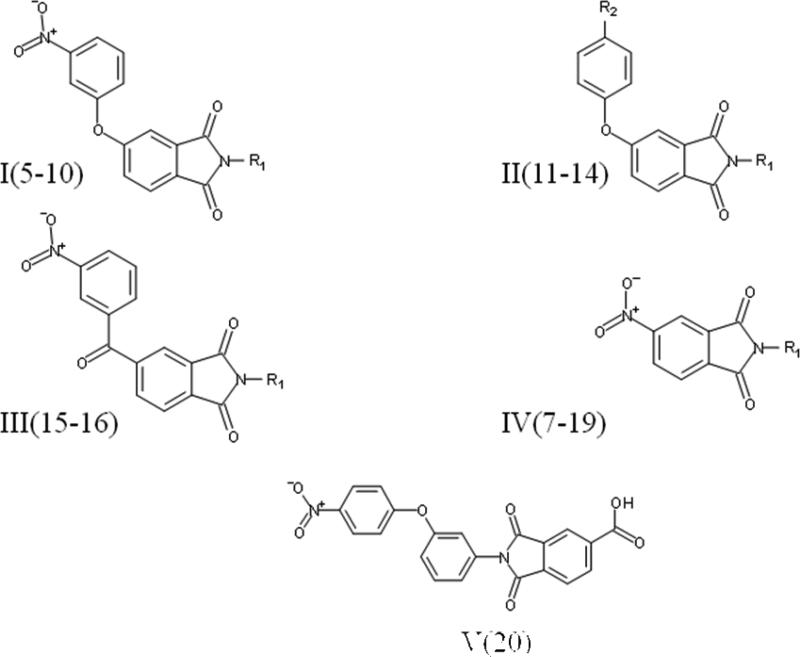
The ligands were flexibly docked into the inactive LPA3 model using Autodock3.0.20, 22 Ligands were evaluated and chosen for experimental screening based on overlap of docked poses with compound 5. The docked complexes were analyzed for interactions analogous to those made compound 5 and any improved interactions (table 2). Figure 2 shows the receptor interactions from our structure-based pharmacophore comparing compound 5 and two of the 42 docked matches. The docked complex of compound 5 in panel A illustrates the minimum interactions that were set as requirement for each matches to have to justify experimental screening. These interactions include ionic interactions with R3.28 and R7.36. The docked complex also needed to have a polar interaction with K95. The docked pose of compound 9 (panel B) showed interactions with R3.28 and R7.36 mimicking our hit, and the interaction with K95 is a stronger ionic interaction than the weak polar interaction observed with compound 5 compound. The compound 10 (panel C) docking pose suggested both a polar interaction and an ionic interaction with K95 as well as showing interactions with R3.28 and R7.36 similar to that of compound 5. Sixteen compounds were chosen for experimental testing grouped into five scaffolds (Figure and Table 3). Scaffold I explored changes to the compound 5 anionic substituent. Scaffold II explored the SAR of compound 5 by evaluating placement of the nitro group on the aromatic ring. In addition the necessity of the anionic group was evaluated with compounds 8 and 14. Compound 8 replaces the anionic group with a pyridine, on the expectation that an aromatic group could interact effectively with cationic sidechains in the receptor through cation-π interactions and still display antagonist activity. Compound 14 was selected with the expectation that replacement of the carboxylic acid with an ether would produce substantially weaker interactions with cationic sidechains in the receptor, giving poor antagonism. Scaffold III replaced the oxygen linker found in compound 5 with a carbonyl group. This provided an opportunity to evaluate conformational rigidification. The fourth scaffold evaluated homologation. Scaffold V is represented solely by compound 20, which reverses the spatial orientation of the anionic group on the phthalimide core relative to compound 5.
Table 2.
Distances from compounds to key residues (Ǻ). Residues selected based on interactions with pharmacophoric features in Compound 5.
| Compound | Percent inhibiton at 10μM | Residues | |||
|---|---|---|---|---|---|
| W25 | K95 | R3.28 | R7.36 | ||
| Compound 11 | NE | 5.20 | 2.84 | 3.85 | 5.56 |
| Compound 5 | 10 | 3.81 | 2.91 | 2.31 | 2.26 |
| Compound 10 | 42 | 9.35 | 2.28 | 2.29 | 2.28 |
| Compound 9 | 43 | 10.17 | 2.39 | 3.25 | 2.33 |
| Compound 12 | 62 | 4.28 | 2.29 | 2.36 | 2.46 |
| Comopund 20 | 82 | 4.10 | 2.45 | 2.38 | 2.29 |
Hydrophobic interactions underlined
Polar interactions bold
Ionic Interactions itacilized
Figure 2.
Interactions of ligands in the LPA3 antagonist binding pocket. Compound 5 (panel A), compound 9 (panel B), and compound 10 (panel C).
Table 3.
Screening assay of Compound 5 and similarity search matches. Comparison of LPA3 inhibition by analog compounds. Compounds were tested using 10 μM against 200 nM LPA. Refer to Figure 3 for scaffold structures.
| Compound | Hit2lead ID | Scaffold | R1 | R2 | % inhibition at 10μM |
|---|---|---|---|---|---|
| 5 | 5747876 | I | 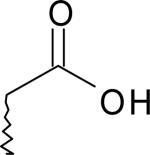 |
10 | |
| 6 | 6582859 | I |  |
agonist | |
| 7 | 7886891 | I |  |
18 | |
| 8 | 5759401 | I | 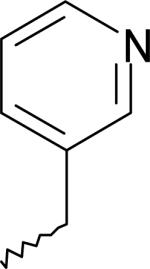 |
38 | |
| 9 | 5233136 | I | 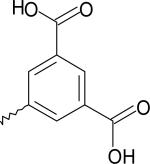 |
43 | |
| 10 | 5751335 | I | 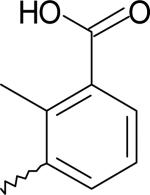 |
42 | |
| 11 | 5770242 | II | 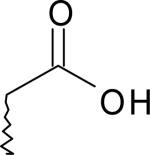 |
NO2 | NE |
| 12 | 7724589 | II | 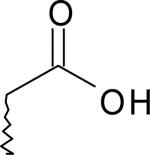 |
CH3 | 62 |
| 13 | 5160780 | II | 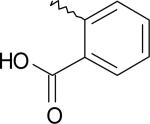 |
NO2 | 38 |
| 14 | 7334533 | II |  |
CH3 | NE |
| 15 | 5750136 | III | 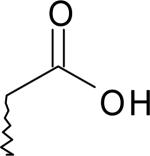 |
Agonist | |
| 16 | 7901752 | III |  |
10 | |
| 17 | 5128706 | IV | 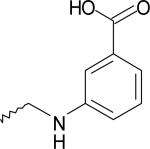 |
NE | |
| 18 | 7890363 | IV |  |
Agonist | |
| 19 | 5233285 | IV |  |
18 | |
| 20 | 5765834 | V | 82 |
2.3. Antagonistic effect and SAR
Selected compounds were experimentally screened by measuring their effect on LPA activity in a Ca2+ assay. Inhibition of LPA was measured by comparing the response of LPA at 200 nM to the response of 200 nM LPA competing against 10 μM test compounds. Ten of the sixteen compounds showed antagonism of an LPA-induced response (Table 3). The fact that nine of the ten antagonists found had better inhibition than our similarity search target, compound 5, shows that our virtual screening approach is able to optimize the efficacy of our matches.
Compound 20 in scaffold V showed the highest in efficacy overall. The replacement of the simple carboxylic group of compound 5 with additional aromatic interactions (compounds 8, 9 and 10) led to compounds up to four times more effective than compound 5. Placement on the phenyl ring in scaffold I seemed to have the biggest impact, as the aromatic insertion in compound 13 relative to compound 11 sharing scaffold II produced a less efficacious compound. Replacement of the flexible ether linker in scaffold I with the more rigid carbonyl linker in scaffold III led to an agonist effect or weak antagonism (compounds 15 and 16). Homologation in compounds 7 versus 5 and 16 versus 15 of scaffolds I and II, respectively, produced little improvement in efficacy but demonstrate that additional length is well-tolerated in the binding pocket. Both compounds w 8 and 14 lack an anionic group, however 8 active and 14 is not active. This tells us that an aromatic group is a adequate replacement for the anionic group but a hydrogen bond acceptor is not.
Dose response curves were generated for the two most efficacious compounds (20 and 12) from the single-point screening. The single dose inhibition for both of these compounds was >50% at 10μM giving us confidence that these two would be full antagonists unlike the similarity search target (5), an expectation that was confirmed (Table 4). Compound 20 was six times more potent than compound 5, with an IC50 of 752 nM versus 4504 nM. Compound 12 was almost twice as potent as compound 5, with an IC50 of 2992 nM. Compound 12 placed the methyl group at the para position compared to the nitro in the meta position in compound 5. Compound 11 was assayed to compare placement of the nitro group on the phenyl ring of scaffold II (Table 2). Compound 11 showed no inhibition of LPA3, indicating that the position of the nitro group has substantial influence on the measured pharmacological activity. Similarity searching for derivatives of compound 5 improved both efficacy and potency, however, selectivity was lost. Both compounds 12 and 20 were LPA1 antagonists and compound 20 was also an LPA5 antagonist.
Table 4.
Dose response data for select compounds.
| LPA1 | LPA2 | LPA3 | LPA4 | LPA5 | |
|---|---|---|---|---|---|
| Compound 5 | NE | NE | IC50 =4504 nM Imax=50 % |
NE | NE |
| Compound 20 | IC50=94 nM Ki=48 nM |
NE | IC50=752 nM Ki=230 nM |
NE | IC50=463 nM Ki=292 nM |
| Compound 12 | IC50=609 nM Ki=311 nM |
NE | IC50=2992 nM Ki=1084 nM |
NE | NE |
| Compound 11 | NE | NE | NE | NE | NE |
2.4. Pharmacophore analysis
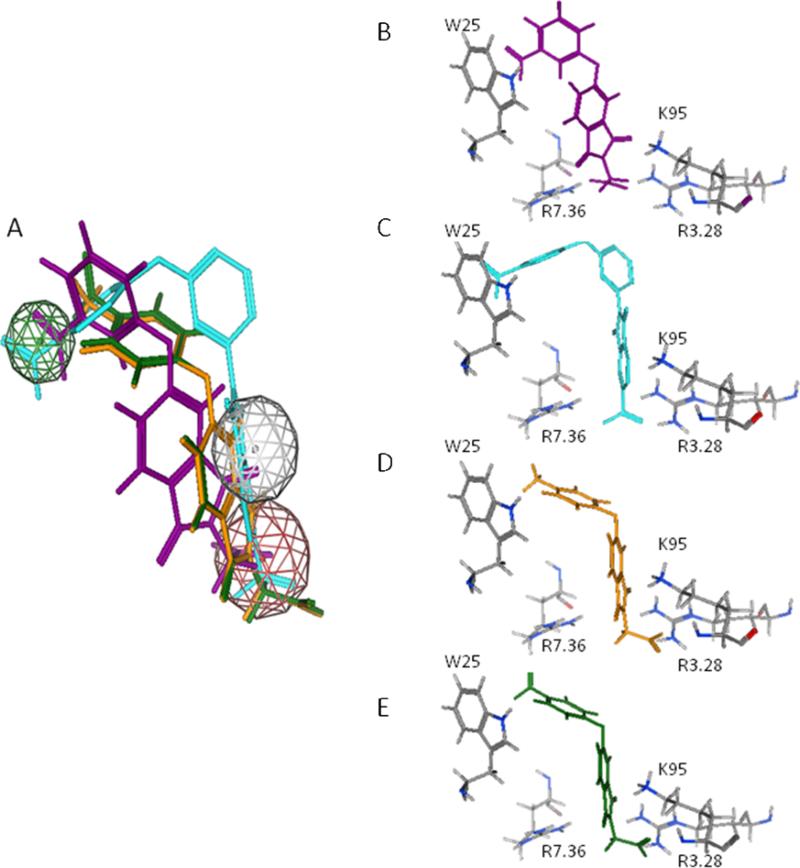
Docking results were utilized to relate select aspects of the experimentally observed SAR to molecular interactions proposed in our LPA3 structure-based pharmacophore. The lowest energy docked positions of compounds 11, 12, and 20 are overlayed on our previously described pharmacophore (Figure 4). We looked at interactions with key residues proposed in our pharmacophore model (Table 1). The aromatic/ionic interaction with R3.28 was common to all of our docked complexes. Our modeling also suggests that W25, K95 and R2.76 affect antagonist activity. Compound 11 showed no activity, consistent with relatively weak interactions reflected in distances to W25 and R2.76 greater than 5.0Å. Compound 12 showed a 1.5 fold increase in potency compared to compound 5. Docked complexes attribute this change to the replacement of the nitro group of compound 5 with a methyl group in compound 12. The docked complex of 12 had a hydrophobic interaction W25 and an ionic interaction with K95 but only a polar interaction with R7.36. Compound 5 interacted at the same sites but displayed polar interactions with W25 and K95 and an anionic interaction with R7.36. While these seem to be very similar interactions differing only in location, the polar interaction of R7.36 with 12 at 2.46 Å is much stronger than the polar interactions between 5 and either W25 at 5.20 Å or K95 at 2.91 Å (Table 2). The fact that compound 20 showed a 6-fold increase in potency can be attributed to the strong ionic interactions with all three cationic sites, K95, R3.28, and R7.36, instead of only two for the other compounds tested.
Figure 4.
Overlayed and individual docked positions of compound 5 (purple, Panels A & B), Compound 20 (cyan, Panels A & C), Compound 12 (orange, Panels A & D) and Compound 11 (green, Panels A& E). The compounds are superposed on our three point pharmacophore consisting of an anionic group, an acceptor/anionic group, and a hydrophobic group.
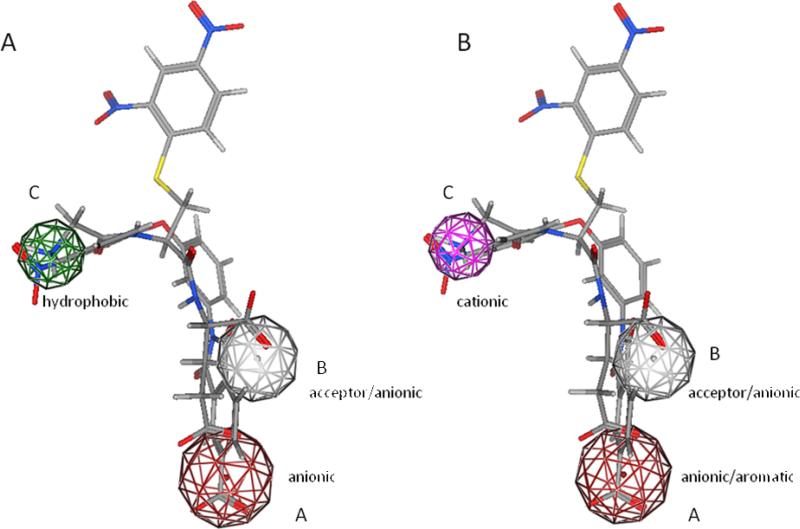
Combining the SAR and modeling data from our current and previous studies,11 we are able to refine our previous selection of the important interactions for LPA3 antagonism. The importance of point B has confirmed in previous SAR study (Figure 5, panel A).11 Compound 8 demonstrates that the type of functional group matching point A can be expanded to include aromatic groups, which have the capacity to form cation-π interactions with the cationic residues in LPA3. The lack of antagonism displayed by compound 14, which lacks an anionic or aromatic group to map onto position A, confirms the importance of point A for receptor affinity. Placing a nitro group (compound 5) or an amine (compound 1)11 at point C has resulted in selective LPA3 antagonists. When replacing the nitro group of compound 5 with a methyl group (12) we lost selectivity. Thus point C should be occupied by a cationic functional group to promote LPA3 selectivity. Figure 5 shows our refined pharmacophore, which consists of three points including anionic/aromatic, acceptor/anionic, and cationic sites (Figure 5, panel B).
Figure 5.
Newly proposed LPA3 antagonist pharmacophore (panel B) compared to old pharmacophore (panel A). Docking overlay of selective LPA3 antagonist, Compound 1, and Compound 20, the most potent compound identifed in the current study
3. Conclusion
The use of similarity searching, docking, and pharmacophore modeling identified a series of 10 LPA3 antagonists based on their similarity to a weak partial antagonist, compound 5. Both the potency and efficacy of our target was improved in the matching compounds. Here we have identified two full LPA antagonists that had 1.5 and 6 fold increases in potency. The location and identity of the aryl group substituent in compound 5 was examined. Placement of a nitro group at the para position of scaffold II, as in compound 11, resulted in no antagonist activity. Placement of a methyl group at the para position of the same scaffold, as in compound 12, gave a more potent compound than compound 5. Compound 12 inhibited LPA3 with an IC50 of 2992 nM and showed activity at only two of five LPA receptors tested and was selected as a promising template for development of additional LPA3 antagonists. The importance of key pharmacophore features was studied. Compound 8 revealed that the pharmacophore point formerly defined as anionic can be broadened to allow either aromatic or anionic features. The loss of antagonist activity in compound 14 showed that hydrogen bonding of the ether is not sufficient for antagonist activity. The emergence of Compound 20 as an LPA1/3/5 antagonist with Ki values less than 300 nM for all three receptors provides an additional compound to stimulate the design of modifications in future SAR studies.
4. Experimental
4.1. Chemical database for virtual screening
Similarity searching was performed using the ChemBridge online database, www.hit2lead.com. Similarity searching using compound 5 as the search target was performed with a threshold of 80% using MACCS fingerprints.23 Compounds were visually assessed to determine how closely the structure reflected compound 5. Similarity matches to compound 5 were chosen to create a selection of analogs that fit one of five structural scaffolds (Figure 3). Filtered matches were then flexibly docked into the previously published, rhodopsin-based inactive LPA3 receptor model.20 The protonation states of the small molecules were assigned using the MOE program.24 Each of the ligands was modeled in the ionization state expected at pH 7 and partial charges were assigned using MMFF94.25
Figure 3.
Scaffolds of compounds selected for pharmacological screening. R1 and R2 groups are defined in Table 3.
4.2. Docking calculations
Docking simulations were performed using Autodock 3.0.22 Default parameters of Autodock 3.0 were used with the following exceptions: energy evaluations (9× 10¹⁰), genetic algorithm search generations (3×10⁴), maximum local search iterations (3×10³), and runs (15). The docking box dimensions, as previously described,11 were 21.375 Ǻ × 21.375 Ǻ × 34.875 Ǻ, with the long dimension following a line from the top of TM1 to the top of TM4. The box was centered to include residues R276, K275, I173, L86, R105, W102, C171, N172, N89, and T90. Fifteen complexes of each ligand were generated. The lowest docked energy complex of each antagonist was then minimized using the MMFF94 forcefield.25
4.3. Compound Selection
A qualitative assessment was done in MOE comparing the docked analogs to compound 5. The individual complexes of the analogs were superimposed on compound 5. Compounds that exhibited interactions at amino acid residues closely mimicking compound 5 were chosen for testing. Compounds exhibiting similar interactions to those of compound 5 were expected to have similar activity as compound 5. Priority was given particularly to those compounds that had additional key interactions at other amino acid residues. It was anticipated the compounds having additional interactions would be more potent than compound 5.
4.4. Pharmacological Assay
The test compounds were purchased from ChemBridge (San Diego, USA) in 5 mg quantities. They were dissolved in methanol and diluted to the required concentrations in buffer. LPA receptor-promoted intracellular Ca2+ mobilization was measured for LPA receptors in stably expressed cells as previously described.11, 20 Briefly, cells were plated in 96-well plates and cultured overnight. The following day the Ca2+ assay was performed using a FLEXstation II (Molecular Devices, Sunnyvale, CA). The cells were loaded with fura-2 after transfer to serum-free media for 4-6 hours. Changes in the intracellular Ca2+ concentration were then measured by determining the ratio of emitted light intensities at 520 nm in response to excitation at 340 and 380 nm. The compounds were tested for agonist and antagonist activity. Each sample was run in quadruplicate. IC50 values were determined from concentration-response curves for selected compounds.
5. Acknowledgments
This work was supported by grants from the National Institutes of Health (RO1 HL84007 to AP and RO1 CA92160 to GT) and the Greater Southeast Affiliate of the American Heart Association (0715125B to JF). The MOE program was donated by the Chemical Computing Group and is greatly appreciated.
References
- 1.Parrill AL. Biochim. Biophys. Acta. 2008;1781:540. doi: 10.1016/j.bbalip.2008.04.011. [DOI] [PMC free article] [PubMed] [Google Scholar]
- 2.Kotarsky K, Boketoft A, Bristulf J, Nilsson NE, Norberg A, Hansson S, Owman C, Sillard R, Leeb-Lundberg LM, Olde B. J. Pharmacol. Exp. Ther. 2006;318:619. doi: 10.1124/jpet.105.098848. [DOI] [PubMed] [Google Scholar]
- 3.Pasternack SM, von Kügelgen I, Aboud KA, Lee YA, Rüschendorf F, Voss K, Hillmer AM, Molderings GJ, Franz T, Ramirez A, Nürnberg P, Nöthen MM, Betz RC. Nat. Genet. 2008;40:329. doi: 10.1038/ng.84. [DOI] [PubMed] [Google Scholar]
- 4.Gardell SE, Dubin AE, Chun J. Trends Mol. Med. 2006;12:65. doi: 10.1016/j.molmed.2005.12.001. [DOI] [PubMed] [Google Scholar]
- 5.Rivera R, Chun J. Rev. Physiol. Biochem. Pharmacol. 2008;160:25. doi: 10.1007/112_0507. [DOI] [PubMed] [Google Scholar]
- 6.Choi JW, Lee CW, Chun J. Biochim. Biophys. Acta. 2008;1781:531. doi: 10.1016/j.bbalip.2008.03.004. [DOI] [PMC free article] [PubMed] [Google Scholar]
- 7.Chun J, Rosen H. Curr. Pharm. Des. 2006;12:161. doi: 10.2174/138161206775193109. [DOI] [PubMed] [Google Scholar]
- 8.Smyth SS, Cheng HY, Miriyala S, Panchatcharam M, Morris AJ. Biochim. Biophys. Acta. 2008;1781:563. doi: 10.1016/j.bbalip.2008.05.008. [DOI] [PMC free article] [PubMed] [Google Scholar]
- 9.Durgam GG, Tsukahara R, Makarova N, Walker MD, Fujiwara Y, Pigg KR, Baker DL, Sardar VM, Parrill AL, Tigyi G, Miller DD. Bioorg. Med. Chem. Lett. 2006;16:633. doi: 10.1016/j.bmcl.2005.10.031. [DOI] [PubMed] [Google Scholar]
- 10.Durgam GG, Virag T, Walker MD, Tsukahara R, Yasuda S, Liliom K, van Meeteren LA, Moolenaar WH, Wilke N, Siess W, Tigyi G, Miller DD. J. Med. Chem. 2005;48:4919. doi: 10.1021/jm049609r. [DOI] [PubMed] [Google Scholar]
- 11.Fells JI, Tsukahara R, Fujiwara Y, Liu J, Perygin DH, Osborne DA, Tigyi G, Parrill AL. Bioorg. Med. Chem. 2008;16:6207. doi: 10.1016/j.bmc.2008.04.035. [DOI] [PMC free article] [PubMed] [Google Scholar]
- 12.Fischer DJ, Nusser N, Virag T, Yokoyama K, Wang D, Baker DL, Bautista D, Parrill AL, Tigyi G. Mol. Pharmacol. 2001;60:776. [PubMed] [Google Scholar]
- 13.Heasley BH, Jarosz R, Carter KM, Van SJ, Lynch KR, Macdonald TL. Bioorg. Med. Chem. Lett. 2004;14:4069. doi: 10.1016/j.bmcl.2004.05.023. [DOI] [PubMed] [Google Scholar]
- 14.Heasley BH, Jarosz R, Lynch KR, Macdonald TL. Bioorg. Med. Chem. Lett. 2004;14:2735. doi: 10.1016/j.bmcl.2004.03.076. [DOI] [PubMed] [Google Scholar]
- 15.Heise CE, Santos WL, Schreihofer AM, Heasley BH, Mukhin YV, Macdonald TL, Lynch KR. Mol. Pharmacol. 2001;60:1173. doi: 10.1124/mol.60.6.1173. [DOI] [PubMed] [Google Scholar]
- 16.Lynch KR, Macdonald TL. Biochim. Biophys. Acta. 2002;1582:289. doi: 10.1016/s1388-1981(02)00183-x. [DOI] [PubMed] [Google Scholar]
- 17.Prestwich GD, Gajewiak J, Zhang H, Xu X, Yang G, Serban M. Biochim. Biophys. Acta. 2008;1781:588. doi: 10.1016/j.bbalip.2008.03.008. [DOI] [PMC free article] [PubMed] [Google Scholar]
- 18.Ohta H, Sato K, Murata N, Damirin A, Malchinkhuu E, Kon J, Kimura T, Tobo M, Yamazaki Y, Watanabe T, Yagi M, Sato M, Suzuki R, Murooka H, Sakai T, Nishitoba T, Im DS, Nochi H, Tamoto K, Tomura H, Okajima F. Mol. Pharmacol. 2003;64:994. doi: 10.1124/mol.64.4.994. [DOI] [PubMed] [Google Scholar]
- 19.Kano K, Arima N, Ohgami M, Aoki J. Curr. Med. Chem. 2008;15:2122. doi: 10.2174/092986708785747562. [DOI] [PubMed] [Google Scholar]
- 20.Sardar VM, Bautista DL, Fischer DJ, Yokoyama K, Nusser N, Virag T, Wang DA, Baker DL, Tigyi G, Parrill AL. Biochim. Biophys. Acta. 2002;1582:309. doi: 10.1016/s1388-1981(02)00185-3. [DOI] [PubMed] [Google Scholar]
- 21.Virag T, Elrod DB, Liliom K, Sardar VM, Parrill AL, Yokoyama K, Durgam G, Deng W, Miller DD, Tigyi G. Mol. Pharmacol. 2003;63:1032. doi: 10.1124/mol.63.5.1032. [DOI] [PubMed] [Google Scholar]
- 22.Morris GM, Goodsell DS, Halliday RS, Huey R, Hart WE, Belew RK, Olson AJ. J. Comput. Chem. 1998;19:1639. [Google Scholar]
- 23.Durant JL, Leland BA, Henry DR, Nourse JG. Journal of Chemical Information and Computer Sciences. 2002;42:1273. doi: 10.1021/ci010132r. [DOI] [PubMed] [Google Scholar]
- 24.MOE . Chemical Computing Group, Inc.; Montreal: [Google Scholar]
- 25.Halgren TA. J. Comput. Chem. 1996;17:490. [Google Scholar]


