

Abstract
In vivo quantitative magnetic resonance imaging (MRI) was employed to detect brain pathology and map its distribution within control, disomic mice (2N) and in Ts65Dn and Ts1Cje trisomy mice with features of human Down syndrome (DS). In Ts65Dn, but not Ts1Cje mice, transverse proton spin-spin (T2) relaxation time was selectively reduced in the medial septal nucleus (MSN) and in brain regions that receive cholinergic innervation from the MSN, including the hippocampus, cingulate cortex, and retrosplenial cortex. Basal forebrain cholinergic neurons (BFCNs) in the MSN, identified by choline acetyltransferase (ChAT) and nerve growth factor receptors p75NTR and TrkA immunolabeling were reduced in Ts65Dn brains and in situ acetylcholinesterase (AChE) activity was depleted distally along projecting cholinergic fibers, and selectively on pre- and post-synaptic profiles in these target areas. T2 effects were negligible in Ts1Cje mice that are diploid for APP and lack BFCN neuropathology, consistent with the suspected relationship of this pathology to increased App dosage. These results establish the utility of quantitative MRI in vivo for identifying Alzheimer's disease-relevant cholinergic changes in animal models of DS and the selective vulnerability of cholinergic neuron subpopulations.
Keywords: functional imaging, acetylcholine, medial septal nucleus, Alzheimer's disease, Ts65Dn trisomic mice, basal forebrain, Ts1Cje trisomic mice
Introduction
An extra copy of human chromosome 21 (HSA21) causes Down syndrome (DS), a disorder associated with mental retardation, congenital abnormalities, and, in later life, Alzheimer's disease (AD) [2,78]. Triplication of the App gene in DS appears critical for the manifestation of AD, and is further supported by data showing that a 78 year-old DS individual with partial trisomy 21 and only two copies of App did not develop AD [61]. Moreover, trisomy of App and only a few flanking genes causes early-onset AD [65].
Ts65Dn mice exhibit morphological, biochemical, and transcriptional changes seen in DS [1,14,21,22,41,63]. Ts65Dn mice possess a third copy of a region of mouse chromosome 16 (MMU16) from App to Mx1, orthologous to the DS critical region of HSA21. These mice exhibit cognitive abnormalities during early postnatal development and, in later life, additional memory and learning deficits arise, associated with reduced hippocampal long-term potentiation (LTP) and increased long-term depression (LTD) [19,45,70,71]. The emergence of these early and late life defects coincide in brain with the enlargement of presynaptic and postsynaptic elements within target areas of the septohippocampal system [10]. Age-related loss of the low-affinity nerve growth factor receptor (p75NTR) phenotype is also seen in basal forebrain cholinergic neurons (BFCNs), accompanied by astrocytic hypertrophy and microglial activation [18,31,41]. BFCNs, which supply most cholinergic innervation to the hippocampal formation and cerebral cortex [50,55], are integral anatomic substrates of memory and attention [7,9], and their reduced receptor expression or loss in AD correlates with cognitive decline [11,20,53,77]. Dysfunction of magnocellular BFCNs in AD within the nucleus basalis (NB) and medial septal nucleus (MSN)/diagonal band complex involves both basocortical and septohippocampal projection systems. Additionally, loss of high-affinity neurotrophin receptor expression (TrkA) within BFCNs also correlates with cognitive decline in AD [27,54]. Slowing or preventing cholinergic cell death or minimizing its consequences are the objectives of clinical trials with neurotrophins [75] and most FDA-approved drugs for AD [7].
Cholinergic deficits and cognitive impairment in adult Ts65Dn mice are related to altered retrograde nerve growth factor (NGF) transport from the hippocampus to the basal forebrain [18]. Retrograde NGF signals are mediated by endosomes, which exhibit abnormalities in Ts65Dn mice similar to those in very early-stage AD and DS [58]. These age-related deficits depend on App triplication [16,68], and are absent in a second trisomic mouse model, the Ts1Cje mouse, which is trisomic for a smaller segment of MMU16 from Sodl to Mx1 that does not include triplication of App [67]. Ts1Cje mice survive to adulthood, exhibit no apparent dysmorphic features or BFCN degeneration, and do not display the severe cognitive deficits observed in adult Ts65Dn mice.
Herein, we have used high resolution quantitative MRI in vivo to detect pathophysiological and neurodegenerative changes in Ts65Dn and Ts1Cje mice using transverse proton spin-spin (T2) relaxation time as a sensitive pathophysiological index. Our experience has indicated that T1 relaxography is not as sensitive to this type of pathology in mice. Therefore, we have attempted to obtain the highest resolution data via T2 relaxography because of the specificity to pathology this measure has provided in our previous studies of mouse models of AD [25,32]. In Ts65Dn mice, but not Ts1Cje mice or disomic (2N) controls, MRI revealed changes likely involved in the damage to cholinergic circuits and the atrophy of BFCNs and their hippocampal and cortical targets, which we confirmed by immunohistochemical and biochemical analyses.
Materials and Methods
MRI Protocols
MRI protocols
Male Ts65Dn mice (n = 12), Ts1Cje mice (n = 12), and 2N control mice (2N littermates of Ts65Dn mice; n = 12; 2N littermates of Ts1Cje mice; n = 12) ranging from 12 to 16 months were analyzed. MRI was performed with a 7T 40 cm horizontal bore magnet (Magnex Scientific, Oxford, UK) with an SMIS spectrometer (Surrey Medical Imaging Systems, Guilford, UK). Animals were anesthetized with isoflurane (2.0 %) in NO2 (75%) and O2 (23%), and transferred to an MR safe holder, and isoflurane was reduced to 1%. Rectal temperature was maintained at 37° C ± 0.5°C during imaging with a warm water pad, and respiration rate was monitored continuously using an S.A. 1025 monitoring system (SA Instruments Inc., Stony Brook, NY). T2 images were acquired with a multi-slice single-echo sequence with 2 averages. Forty-eight slices, 200 μm thick (gap = 100 μm) were acquired with 128 × 128 lines of data over a field of view (FOV) of 25.6 mm. Images were obtained at 6 echo times (TE) of 15, 20, 25, 35, 55, and 75 ms with a repetition time (TR) of 4000 ms. Imaging voxel resolution was 0.2 × 0.2 × 0.2 mm3. The total MR scanning time, including shimming and radio frequency calibrations, was about 128 minutes per animal. Absolute T2 maps were calculated on a voxel-by-voxel basis by fitting the MRI data to a single exponential as a function of TE using the MEDX software package (MEDX, Medical Numerics Inc, Sterling, VA).
Post-acquisition Image Analysis
Regional comparison
For each animal, all images were reconstructed on the same scale with Hanning filters applied. Following reconstruction, images were converted to the analyze format and read into the MEDX image processing package. After brain masking, the T2 relaxation time was fit to each voxel time series within each brain using a two parameter, single compartment fit (M0 and T2) via linear regression on the log-linear data. This produced a T2 map for each of the 48 slices of each animal. Regions of interest (ROIs) were manually drawn on the T2-weighted images in the MEDX software package and used to define regions from which T2 was extracted from the T2 maps. Anatomical guidelines for outlining these regions were determined by comparing anatomical structures in the MRI slices with a standard mouse atlas [60]. Regions analyzed included frontal cortex (bregma 1.70 mm to -4.72 mm), cingulate cortex (1.70 mm to -0.82 mm), hippocampus (-0.94 mm to -4.16 mm), MSN (1.18 mm to 0.26 mm), striatum (1.54 mm to 0.14 mm), corpus callosum (1.70 mm to -4.72 mm), and cerebellum (-5.88 mm to 8.12 mm). For each animal, 48 slices with equivalent anatomy were selected to achieve a comparable measure between animals. For each ROI, mean T2 was calculated using the MEDX software. Volumes of each structure were estimated by multiplying the number of pixels within a given area by the size of each voxel and slice thickness. Statistical analysis was performed by one-way analysis of variance (ANOVA) to assess the variance between groups of the mean T2 values and volumes, with post-hoc analysis (Neumann-Keuls test; level of significance was set at p < 0.05) for individual comparisons where appropriate as described previously for MRI studies [23,66].
Voxel-wise analysis
The calculated multi-slice T2 maps (48 slices) for each mouse (n = 12) were spatially registered to a common template (determined from the entire dataset average) using a non-linear image registration algorithm [4]. Clusters of voxels from the Ts65Dn or Ts1Cje experimental groups exhibiting significant differences from the 2N group were determined as follows: group mean registered images from each experimental group were compared to the 2N group by means of a voxel-wise analysis using two-tailed t tests (p < 0.05). This analysis was complemented by cluster thresholding for a minimum cluster of 12 voxels, a minimum cluster (t < 0.005) and a positive threshold (t > 0), so that only those clusters for which the T2 decreased compared to 2N animals were identified. Voxel clusters from Ts65Dn or Ts1Cje groups exhibiting significant differences from the 2N group (voxel of black, or low, T2 {VBT2}) were loaded onto standard anatomical images to locate their spatial distribution. The transverse and three-dimensional (3D) reconstructions were performed using the Slicer software package (www.slicer.org) to further identify regions of VBT2 voxel clusters in the trisomy mouse brains compared to 2N mice.
Tissue Preparation for Histological and Biochemical Analyses
A second cohort of Ts65Dn, Ts1Cje, and 2N mice, 12-15 months of age (n = 6 animals in each group) were employed for histological evaluation. The imaging cohort was not intended to be utilized for biochemical and histochemical analyses due to the differing logistics of the imaging and histochemical protocols. These inbred mouse strains are extremely well characterized, and using two separate cohorts should not be deleterious to the overall study design. Mice were anesthetized with sodium pentobarbital (60 mg/kg) and perfused transcardially with 4% paraformaldehyde in 0.1 M phosphate buffer (pH 7.5). Brains were removed and postfixed overnight in the same fixative solution at 4°C. Forty μm thick coronal sections were cut on a vibratome (VT1000S, Leica, Germany) and placed in Tris-buffered saline (TBS; pH 7.5).
Immunocytochemistry
Immunocytochemistry was performed as previously described [16,27] using a goat polyclonal antibody directed against choline acetyltransferase (ChAT, Chemicon, Temecula, CA; 1:250 dilution) and rabbit polyclonal antibodies against p75NTR (Promega, Madison, WI; 1:250 dilution), high-affinity nerve growth factor receptor, TrkA (Upstate/Millipore, Cell Signaling Solutions, Temecula CA; 1:250 dilution), and microtubule-associated protein 2 (MAP2, Chemicon; 1:200 dilution) overnight at 4 °C. The diluent for the primary antibody contained 0.4% Triton X-100, 2% normal horse serum and 1% bovine serum albumin. Immunoreactivity was detected using rabbit (ChAT) or goat (p75, TrkA, MAP2) biotinylated secondary antibodies followed by processing using an ABC kit (Vector Labs, Burlingame, CA). Signal was detected using 0.05% 3′ 3′ diaminobenzidine (Sigma) and 0.005% hydrogen peroxide (pH 7.2) as described previously [16,27]. Tissue sections incubated in the absence of primary antibody served as negative controls. After processing, the tissue sections were mounted onto gelatin-coated slides and air-dried. Counterstaining was performed using cresyl violet. Sections were examined by light microscopy using a Zeiss Axioskop 2 microscope equipped with an AxioCam HRc digital camera.
Assessment of Dendritic Changes by MAP2 Immunocytochemistry
A total of 6-8 sections per animal were stained by MAP2 immunohistochemistry and visualized microscopically using a CCD camera attached to the Zeiss microscope. Morphometric analysis of MAP2 immunostaining within cell bodies and neuropil was measured in optical slices in the dorsal hippocampus, cingulate cortex, and temporal cortex. Background staining was corrected by subtracting the values measured over the corpus callosum, which lacks MAP2 immunoreactivity [29].
Acetylcholinesterase (AChE) Histochemistry
Tissue sections used for detection of in situ AChE activity [3,36] were obtained as described for immunocytochemistry. Sections were mounted on gelatin-coated slides, dried, and then preincubated twice for 5 min each at 37 °C in 0.1 M sodium acetate buffer (pH 6.0) containing 30 μM tetra-isopropyl pyrophosphoramide (iso-OMPA, Sigma) to inhibit nonspecific background staining. Sections were incubated for 3 hours at 37 °C in a medium consisting of 1.7 mM acetylthiocholine iodide, 4 mM sodium citrate, 3 mM cupric sulfate, 0.1 mM potassium ferricyanide, 30 μM iso-OMPA, and 65 mM sodium acetate buffer (pH 6.0). The reaction was stopped by rinsing sections in 0.1 M sodium acetate buffer (pH 6.0) followed by incubations in 1% ammonium sulfide, 100 mM sodium nitrate, and 0.1% silver nitrate. Sections were dehydrated, coverslipped, and examined by light microscopy. Additional sections were incubated in the absence of acetylthiocholine iodide and served as negative controls.
Quantitative Assessment of AChE Histochemistry
Quantitative morphometric analysis of AChE enzyme histochemical reactivity was performed on sections obtained from the hippocampus, cingulate cortex and temporal cortex from Ts65Dn, Ts1Cje, and 2N mice [52]. An average of 6 sections with 40 μm thickness and 240 μm interleave distance was used to quantitate regional immunoreactivity for each group. Morphometric analysis of AChE-reactive fibers was performed through the dorsal hippocampus, cingulate cortex, and temporal cortex by digitizing 20× microscope images to a computer workstation via a CCD camera and use of NIH Image (Version 6.1) analysis software. An average of 6 tissue sections chosen at random were evaluated per brain. Statistical analysis among the three groups of mice for histochemical labeling was performed using a one-way ANOVA with post-hoc analysis (Neumann-Keuls test; level of significance was set at p < 0.05) for individual comparisons as described previously for quantitative morphometry assessments [16,28].
Western Blot Analysis
For Western blot analyses, hippocampus, cingulate cortex, and temporal cortex from Ts65Dn, Ts1Cje, and 2N brains (n = 4 each) were dissected from coronal slabs, immediately frozen on dry ice, and stored at −80 °C until use. Regional brain homogenates were obtained and analyzed by sodium dodecyl sulfate polyacrylamide gel electrophoresis (SDS-PAGE) as previously described [30]. Briefly, tissues were homogenized in RIPA buffer containing protease inhibitors purchased from Sigma (1% Tween 20, 0.5% sodium deoxycholate, 1 mM sodium orthovanadate, 10 mM sodium fluoride, 10 mg/ml aprotinin, 1 mg/ml leupeptin, and 1 mM phenylmethylsulfonyl fluoride). Protein concentrations were measured using the Bradford assay (Bio-Rad, Hercules, CA). Samples (30 - 50 μg) were boiled in SDS-PAGE loading buffer for 5 minutes, loaded onto 3-8% gradient precast SDS-PAGE gels (Bio-Rad) and separated based on molecular weight. Proteins were transferred to PVDF membranes and probed for MAP2 {Chemicon; 1:5000 dilution in 5% nonfat dry milk in a PBS solution containing 0.02% Tween 20 (Sigma)}. Immunoreactive proteins were detected using species-specific horseradish peroxidase-conjugated secondary antibodies and enhanced chemiluminescence (1:2000 dilution; GE Healthcare, Piscataway, NJ). Equal protein loading was determined using an antibody to β-tubulin (Sigma, 1:5000 dilution). Autoradiographic films were scanned into Adobe Photoshop (Adobe Systems Incorporated, San Jose, CA) and densitometric analysis was performed by quantitating optical density (OD) of the appropriate bands via NIH Image (Version 6.1). Relative values were calculated by subtracting the background OD value from the measured OD of each immunolabeled band. A Student's t-test was used for statistical evaluations between groups.
Results
Mapping of Region-Specific Brain Pathology by MRI
T2 values from brain regions with clearly defined anatomic boundaries were determined from approximately 48 coronal slices per animal collected from multi-slice data sets. Compared to 2N and Ts1Cje trisomic mice, Ts65Dn mice exhibited significantly smaller mean T2 relaxation times within regions known to exhibit age-related atrophic cholinergic changes, including the MSN (p < 0.01), hippocampus (p < 0.05), and cingulate cortex (p < 0.01) (Fig. 1). This reduction was not evident in the striatum, corpus callosum, or brainstem, which exhibited T2 relaxation values equivalent to those found in Ts1Cje and 2N mice (Fig. 1). Volumetric measurements obtained from high resolution T2 images confirmed previous observations in Ts65Dn mice, and revealed a significant decrease in volume of the cerebellum (p < 0.05) [8,59].
Figure 1.
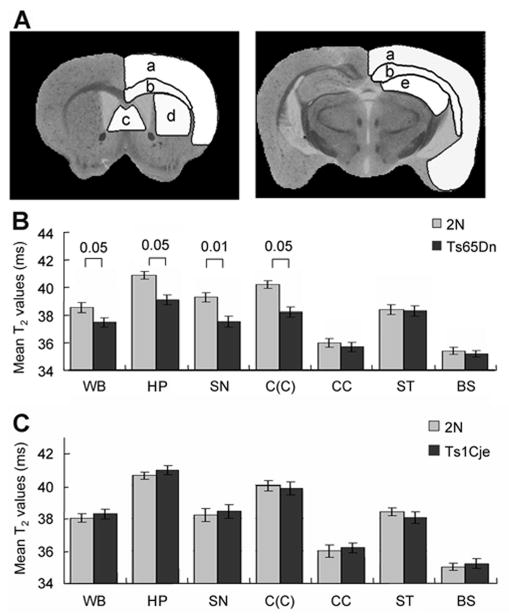
Mean T2 assessments in Ts65Dn, Ts1Cje, and 2N mice.
Regional comparisons of mean T2 values and MRI volumetric findings between 2N mice and Ts65Dn, Ts1Cje trisomic mice. Anatomical guidelines for outlining regions of interest (ROIs) were determined by comparing anatomical structures in the MRI slices with standard atlas {A: ROIs of cortex (a), corpus callosum (b), medial septal nucleus (c), striatum (d), and hippocampus (e)} (A). Detailed comparisons are available in bar graph B, indicating significant overall regional decrease in mean T2 values ± SEM in Ts65Dn mice in the whole brain (WB; p < 0.05). Region-specific reduction in T2 was identified in the hippocampus (HP; p < 0.05), medial septal nucleus (MS; p < 0.01), and the cingulate cortex (C(C); p< 0.05), but not in the corpus callosum (CC), striatum (ST), or brainstem (BS) (B). By contrast, as illustrated in bar graph in panel C, there was no significant difference of T2 relaxation times in the WB or any regions in Ts1Cje mice.
Following volumetric measurements, a detailed voxel-wise analysis was undertaken to map the distribution of altered T2 (VBT2) more precisely to anatomical subregions of brain in Ts65Dn mice. VBT2 clusters, representing reduced T2 were significantly different between the 2N and Ts65Dn mice, and between the 2N and Ts1Cje mice, and are illustrated in Figure 2. In Ts65Dn mice, T2 was reduced in various regions of the cortex where we found increased VBT2 clustering to be prominent in the cingulate and retrosplenial cortices compared to 2N mice (Fig. 2A). We also observed concentrations of VBT2s in the MSN and VDB of Ts65Dn mice albeit to a lesser degree than those detected in the cortical regions. Significant VBT2 clustering was identified in the hippocampus from Ts65Dn mice compared to 2N mice. In the hippocampus, concentrations of VBT2s were present within CA subfields and the dentate gyrus. Transverse and 3D reconstructions, which were performed using the Slicer software package (www.slicer.org), showed similar results (Fig. 2). In contrast to the T2 reductions in Ts65Dn mice, fewer, randomly distributed VBT2s clusters were identified in brains of Ts1Cje mice (Fig. 2).
Figure 2.
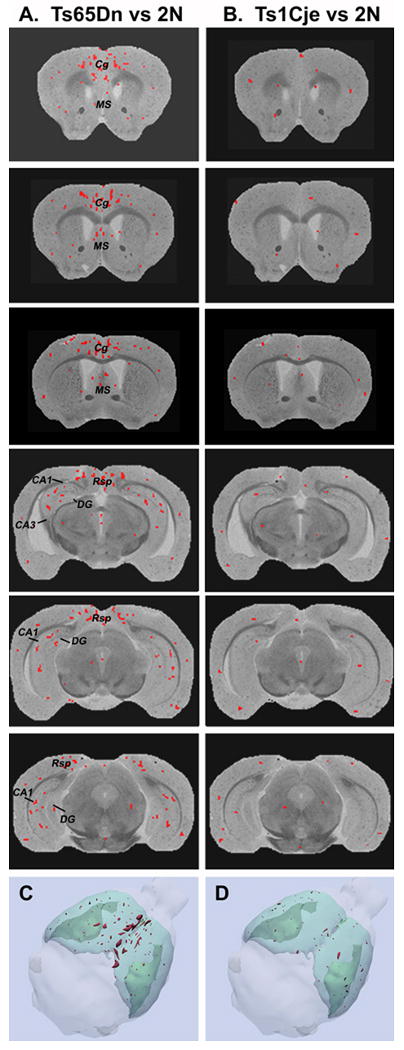
Spatial distribution of VBT2 in Ts65Dn mice.
Occurrence of VBT2 clusters of reduced T2 identified by voxel-wise analysis of T2 maps from Ts65Dn mice compared with 2N mice (A) or Ts1Cje mice compared with 2N mice (B). The red pixels represent voxels of reduced VBT2 (p < 0.05). In Ts65Dn mice, VBT2s are distributed predominantly within the cingulate cortex (Cg), retrosplenial cortex (Rsp), hippocampal subfields (CA1, and CA3), dentate gyrus (DG), and medial septal nucleus (MS). In contrast to Ts65Dn mice, Ts1Cje mice (B) exhibited fewer and randomly distributed VBT2s within the same brain regions. Computer-generated 3-D image renderings of VBT2s in Ts65Dn (C) and Ts1Cje (D) mice illustrate that in Ts65Dn mice, the VBT2 clusters are located predominantly within the cingulate cortex and retrosplenial cortex, whereas VBT2 clusters were fewer or absent in similar regions from Ts1Cje mice.
Regional MRI Abnormalities in Ts65Dn Mice Correspond to Selective BFCN Deficits
Consistent with several previous studies [17,69], immunocytochemistry using established markers of cholinergic neurons, including ChAT (Fig. 3A-C and insets), TrkA (Fig. 3D-F), and p75NTR (Fig. 3G-I) revealed a decrease in the number of immunopositive neurons within the MSN and NB (not shown) of Ts65Dn mice compared to Ts1Cje and 2N mice and consistent with the selective vulnerability and loss of cholinergic phenotype. Many BFCNs in the Ts65Dn MSN that were relatively depleted of ChAT immunoreactivity appeared shrunken by Nissl stain (cresyl violet) (Fig. 3L and inset) compared to BFCNs in the MSN of 2N and Ts1Cje mice (Fig. 3 J and K and insets) and by ultrastructural examination (data not shown). Coincident with the loss of cholinergic immunoreactivities in the MSN, we observed a concomitant reduction of immunostaining within cholinergic efferents in the hippocampus and in laminae III and V of the cingulate cortex (data not shown). By contrast, age-matched Ts1Cje mice exhibited no significant changes in the number of ChAT, TrkA, or p75NTR immunopositive cells compared to 2N controls (Fig. 3).
Figure 3.
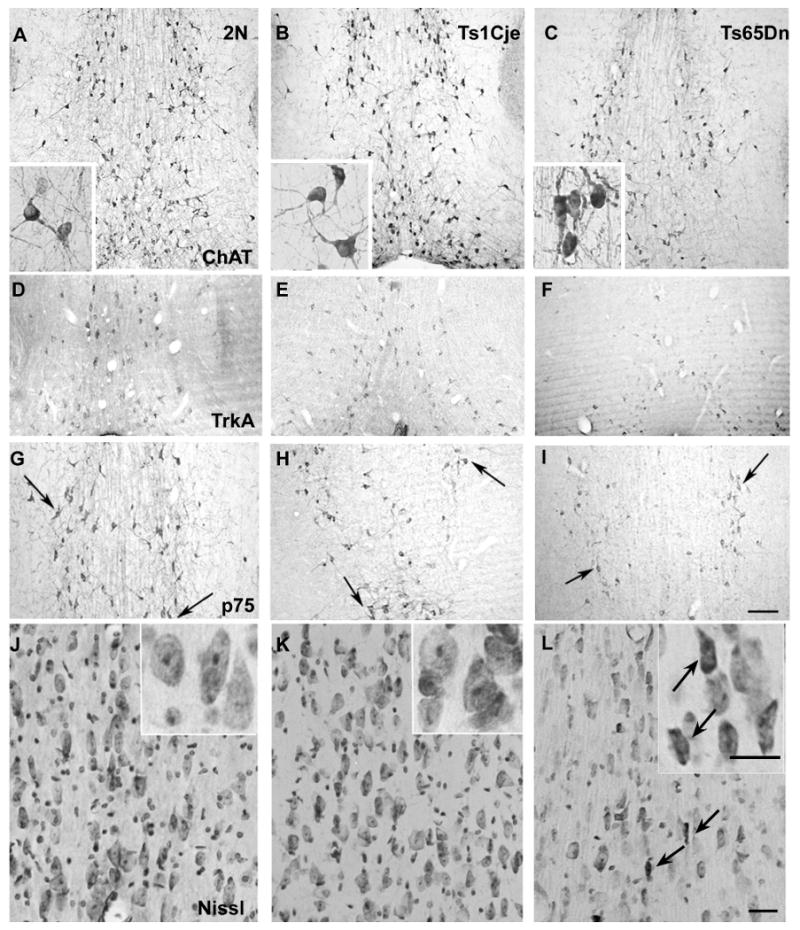
Expression of cholinergic markers within the MSN of Ts65Dn, Ts1Cje, and 2N mice.
Immunocytochemical analysis of BFCNs within the MSN of 2N (A, D, G) and Ts1Cje (B, E, H) and Ts65Dn (C, F, I) trisomic mice revealed a decrease in the numbers of immunoreactive neurons in the MSN of Ts65Dn mice compared with Ts1Cje and 2N controls. This reduction in cholinergic phenotype was evident using established cholinergic markers including ChAT (A-C, arrows), high-affinity NGF receptor TrkA (D-F, arrows), and low-affinity NGF receptor p75NTR (G-I, arrows). In Ts65Dn mice, many BFCNs in the MSN exhibited atrophic changes such as shrunken perikarya (L and L inset arrows), condensed or swollen nuclei and the appearance of apoptotic bodies detected by light microscopy using Nissl stain and by electron microscopy (not shown). No significant differences in BFCN number or morphology were seen in the MSN of Ts1Cje compared with 2N controls (K and K inset, J and J inset). Scale bar A-I: 200 μm, J-L 20 μm.
AChE enzyme histochemistry (Fig. 4) revealed regional and laminar differences in Ts65Dn mice compared to 2N and Ts1Cje mice in cholinergic terminal field distribution particularly within the hippocampus (A-C) and cingulate cortex (D-F), and corresponding to postsynaptic dendritic regions. Within the hippocampal formation of 2N mice (A, arrowheads), AChE-rich cholinergic fibers were dense within CA1-CA3 fields as well as the inner molecular layer of the dentate gyrus. In the cingulate cortex, the density of cholinergic innervation was greatest in layers III and V (Fig. 4D, D′, and D″). In contrast to the pattern observed in 2N mice, Ts65Dn mice exhibited decreased AChE staining associated with the loss of cholinergic innervation within all CA fields (p < 0.01), but particularly CA3 (p < 0.01) (Fig. 4C), and a marked reduction in reactive fibers in layers III and V of cingulate cortex (Fig. 4F, F′, and F″). Ts1Cje mice showed no overt differences in the magnitude of AChE staining in the hippocampus (Fig. 4B) and in the laminae of the cingulate cortex (Fig. 4 E, E′, and E″) compared to 2N control mice. The temporal cortex, which does not receive its major cholinergic input from the MSN, showed no difference in AChE activity in Ts65Dn mice compared to Ts1Cje and 2N mice (Fig. 4G-I and G′-I′). Semiquantitative morphometric analysis of AChE reactivity of these regions confirmed the morphologic observations (Fig. 4J).
Figure 4.
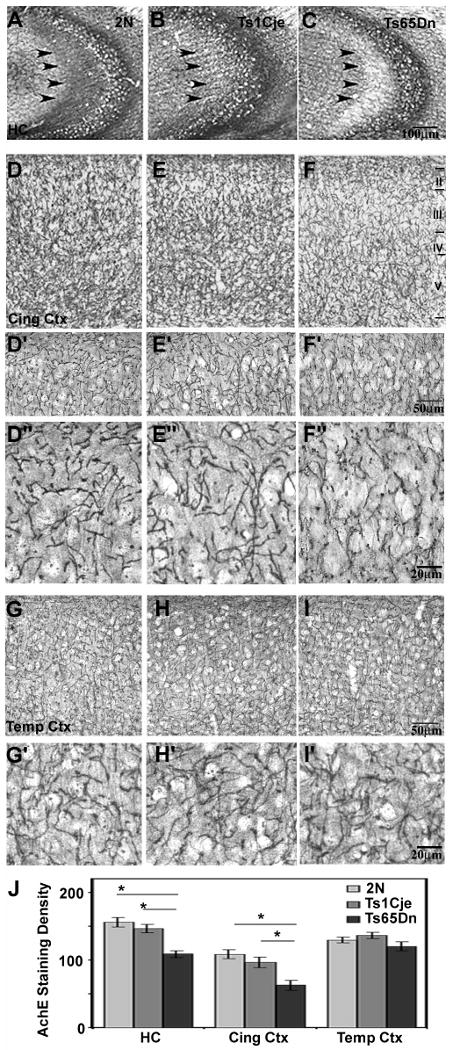
Loss of AChE expression in the hippocampus and cingulate cortex in Ts65Dn trisomic mice.
Enzyme histochemical analysis of in situ AChE activity in the dorsal hippocampus (AC), cingulate cortex (D-F), and temporal cortex (G-I) of 2N (A, D, G), Ts1Cje (B, E, H), and Ts65Dn (C, F, I) mice. In Ts65Dn mice compared with Ts1Cje and 2N littermate controls, a qualitative decrease in the number of AChE reactive cholinergic fibers was detected in CA3 of the hippocampus (C, arrowheads) and in the cingulate cortex (F, F′, and F″), particularly in laminae III and V. F′ and F″ are high magnification views demonstrating the loss of AChE reactivity in lamina III. This loss of fiber staining, which reflects loss of cholinergic terminals in the hippocampus and cingulate cortex, was not evident in cingulate lamina III and V from 2N (D, D′, and D″) and Ts1Cje (E, E′, and E″) mice and could be attributed to the decrease in cholinergic projection neurons in the MSN (see Figure 3) leading to the loss of innervation to these brain regions. No differences in the density of AChE reactive fibers were seen throughout the laminae of temporal cortex from 2N control mice (G, G′) and Ts1Cje (H, H″) and Ts65Dn (I, I′) trisomic mice brains. Higher magnification images of lamina III of the temporal cortex, which receives its main cholinergic input from more posterior areas of the cholinergic system, are shown in panels G″-I″. Densitometric analysis of AChE activity ± SEM in the hippocampus, and cingulate cortex (J) revealed a significant decrease in the AChE-reactive fibers in Ts65Dn mice compared to 2N and Ts1Cje mice. Asterisk denotes (p < 0.05).
Postsynaptic Neuron Alterations in BFCN Projection Areas
In 2N mice, MAP2 antibodies labeled the apical dendrites of pyramidal neurons in layer V of the cingulate cortex (Fig. 5A), and hippocampus, and granule cells in the dentate gyrus (Fig. 5D). In Ts65Dn mice, MAP2 immunoreactivity was increased in apical dendrites within these neuronal populations (Fig. 5C, 5F). This increase in MAP2 immunoreactivity occurred concomitantly with a loss of AChE-positive afferent fibers (compare Figs. 4 and 5). These dendritic alterations were not apparent in all brain regions in Ts65Dn mice. For example, compared to the cingulate cortex, the temporal cortex (Fig. 5G-I) showed no alteration in the pattern of MAP2 immunoreactivity. The increase in MAP2 levels in the cingulate cortex and hippocampus of Ts65Dn mice detected by immunocytochemistry was confirmed in tissue sections by morphometry (Fig. 5J). Western blot analysis using an antibody directed against MAP2 revealed a 2- to 3-fold elevation in MAP2 expression in Ts65Dn mice compared to 2N and Ts1Cje mice (p < 0.01) (Fig. 5K). In contrast to Ts65Dn mice, Ts1Cje trisomic mice exhibited no significant changes compared to 2N mice in MAP2 by immunohistochemistry (Fig. 5B, 5E, 5J) or immunoblot analysis (Fig 5K).
Figure 5.
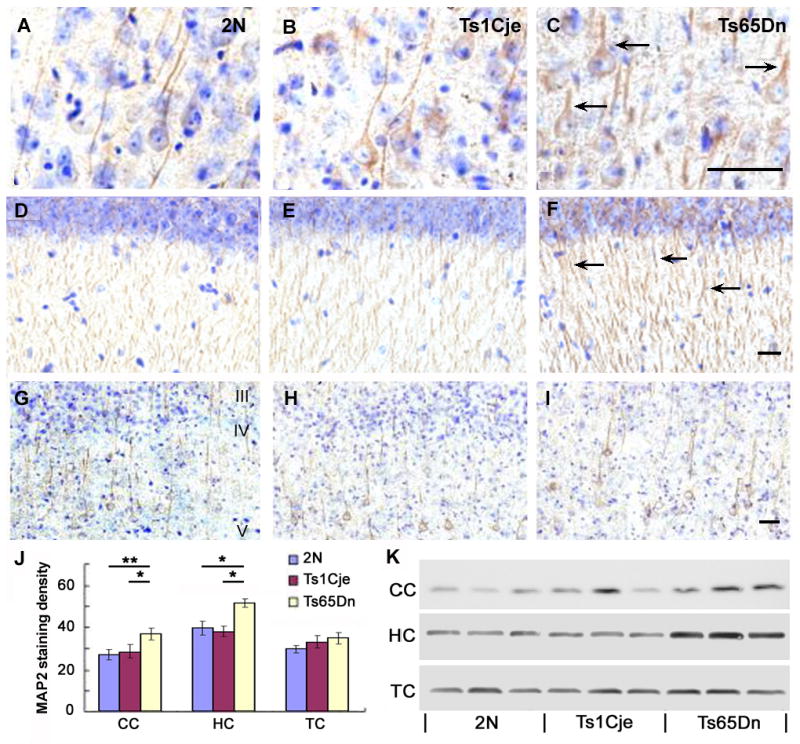
Alterations in MAP2 expression within Ts65Dn mice.
In Ts65Dn mice, MAP2 immunocytochemistry revealed a qualitative increase in the levels of MAP2 immunostaining in the apical dendrites of pyramidal cells in layer V of the cingulate cortex (C, arrows) and within the hippocampal CA fields (F, arrows) compared to the levels of MAP2 dendritic staining in the cingulate cortex and hippocampus from 2N control (A, D, arrows) and Ts1Cje trisomic mice (B, E, arrows). In Ts65Dn mice, MAP2-immunoreactive dendrites of large pyramidal neurons were shorter and thicker and less tapered compared with 2N and Ts1Cje mice. No significant changes in the magnitude of MAP2 immunolabeling or in dendrite morphology were detected in the temporal cortex of Ts65Dn mice compared to 2N and Ts1Cje mice (G-I). Morphometric analysis (J) of MAP2 immunoreactivity in brain sections from Ts65Dn, Ts1CJe and 2N mice confirmed the qualitative immunocytochemical observations. Quantitative densitometric analysis of MAP2 immunoreactive protein (± SEM) measured by Western blot analysis (K) revealed an increase in MAP2 levels in the cingulate cortex and hippocampus, but not in the temporal cortex in Ts65Dn mice compared to 2N and Ts1Cje mice. Single asterisk denotes (p < 0.05) and double asterisk indicates (p < 0.01). Scale bar: 20 μm.
Discussion
Our results establish in the Ts65Dn model of DS that in vivo quantitative MRI is a valuable assessment tool sufficiently sensitive to detect changes associated atrophy and degeneration of subpopulations of BFCNs and associated changes in cortical and hippocampal cholinergic circuitry. Significant T2 hypointensities (VBT2) were observed in the MSN, hippocampus, cingulate cortex, and retrosplenial cortex of Ts65Dn mice, and correlate anatomically with the loss of cholinergic markers specifically within the MSN, the efferent projection path of MSN neurons, and the corresponding postsynaptic targets of this cholinergic innervation. Although cholinergic MSN neurons comprise approximately 5% of the total cholinergic neuron population in brain, they provide the major cholinergic innervation to the hippocampal formation as well as innervate the cingulate cortex and retrosplenial cortex [12,24,51,55]. In Ts65Dn mice, cholinergic fibers were decreased in CA fields of the hippocampus, notably in CA3, a region which receives an especially rich projection from the MSN [51]. A previous report found no alterations in ChAT activity within the hippocampus of Ts65Dn mice [17,69]. These results could be explained by the investigators' use of total hippocampal homogenates and not the analysis of discrete brain regions and subfields, resulting in the dilution of any biochemical differences that exist between Ts65Dn and 2N mice. Using in vivo imaging techniques, our results show that the T2 changes were regionally selective and pathway-specific, as the MSN projection path to the cingulate cortex and retrosplenial cortex displayed T2-related deficits, whereas other regions of neocortex that do not receive significant afferent input from the MSN did not show significant changes in VBT2. Our MRI findings, therefore, provide correlative evidence that strongly implicates the MSN and its projection pathways in the neuropathology of Ts65Dn mice (Fig. 6).
Figure 6.
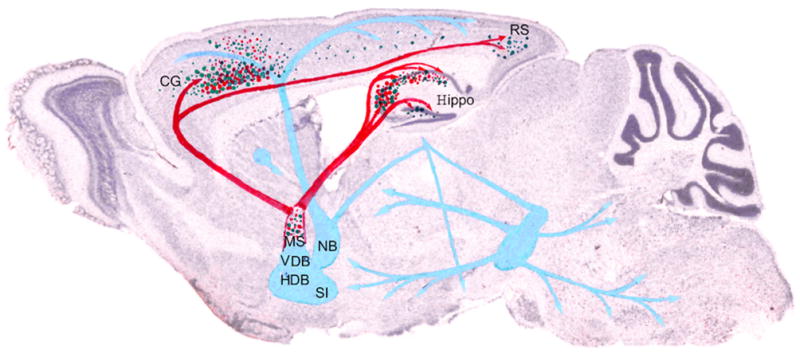
Schematic of VBT2 changes in Ts65Dn mice.
Decreases in T2 correlate with cholinergic deficits observed in Ts65Dn mice. Green dots show the distribution of VBT2 and red dots represent areas with a dramatic loss of the cholinergic phenotype. Red arrows indicate MSN cholinergic pathways and blue arrows indicate additional cholinergic pathways. Cholinergic deficits in Ts65Dn mice are located predominantly within the MSN as well as the projection path to the cingulate cortex and hippocampus, where VBT2 hypointensities also were prominent Key: CG, cingulate cortex; HDB, horizontal limb of the diagonal band; Hippo, hippocampus; NB, nucleus basalis; RS, retrosplenial cortex; SI, substantia innominata, VDB, ventral limb of the diagonal band.
Previous studies have shown that Ts65Dn mice exhibit selective age-dependent atrophy of BFCNs, a progressive decline in numbers of cholinergic neurons in the basal forebrain detected by established cholinergic marker proteins, and astrocytic hypertrophy [18,31,40,41]. The present study combined quantitative MRI and immunocytochemical and enzyme histochemical studies to demonstrate that the loss of cholinergic neurons in Ts65Dn mice is selective for a specific subgroup of cholinergic neurons localized to the MSN and to a lesser degree, the NB. The other major cholinergic cell populations within the basal forebrain, including the VDB and HDB, displayed no detectable changes in cholinergic phenotype or abnormalities detected by MRI. Furthermore, regional mean T2 levels were normal in the pontomesencephalon, an area rich in cholinergic neurons, as well as the striatum, which contains a population of cholinergic interneurons.
Septal forebrain projections which originate from cholinergic and γ-aminobutyric acid (GABAergic) neurons within the MSN and VDB terminate topographically throughout the hippocampus, cingulate cortex, and retrosplenial cortex [46,56,74]. Selectively reducing cholinergic neurons in the MSN and VDB by treatment with 192 IgG-saporin dramatically decreases immunopositive axons in the hippocampus [80]. In Ts65Dn mice (but not Ts1Cje mice) and rodents subjected to axotomy of the fimbria-fornix, expression of the cholinergic phenotype of neurons within the MSN is decreased, as a significant population of these neurons atrophy but continue to survive rather than die outright [29,72]. The persistence of many MSN neurons in an atrophic or nonfunctional state is consistent with nearly twenty years worth of data demonstrating that loss of cholinergic markers is largely ameliorated by infusions of neurotrophic factors [37,47], indicating that MSN neurons are sustained by target-derived trophic factors from the hippocampus. The ligand-receptor interaction for NGF and related neurotrophins in the septohippocampal system takes place via a signaling endosome complex [42]. The signaling endosome undergoes retrograde axonal transport to cholinergic MSN neurons while transducing signals that promote neuronal survival and phenotypic viability. This system has been demonstrated to be perturbed in Ts65Dn mice [16,18,68], and is one of the components critical to BFCN survival and phenotypic homeostasis.
There appears to be a close interrelationship between the cholinergic, endosomal, neurotrophic, and APP systems, all of which are altered to varying degrees in AD and DS [16,57,68]. Although they do not display amyloid plaques, Ts65Dn mice show increased levels of full-length APP mRNA and protein in the cortex. This up regulation, which leads to alterations in APP processing and function, possibly involving retrograde transport of NGF [13,18,33,44], may play a prominent role in the cholinergic degeneration of BFCNs in Ts65Dn mice [43,68]. The absence of cholinergic and MRI deficits in Ts1Cje mice, which have a triplicated MMU16 region without App triplication, supports this close relationship.
Neurons within areas of VBT2 that are the postsynaptic targets of MSN cholinergic fibers also exhibit significant biochemical and morphological abnormalities suggesting pervasive pre- and post-synaptic alterations within the MSN cholinergic forebrain projection path in the Ts65Dn mouse. Corresponding dendritic pathology has been characterized within the hippocampal formation and neocortex of DS patients [26,73]. Similarly within in an animal model of excitotoxic damage to the NB, cholinergic afferents modulate MAP2 expression [79], and lesions of the basal forebrain complex in neonatal mice retard the dendritic development of cortical pyramidal cells [35,64]. Synaptic spine enlargement on neurons throughout the cortex has been shown recently in Ts65Dn mice [10,76], although its appearance at early postnatal ages throughout the cortex suggests that this may be a pathologic process distinct from the one associated with the later-onset regionally-selective cholinergic deficit observed here.
Our MRI results indicate that T2 relaxation time is altered in aged Ts65Dn mice, which involve principally the cholinergic system (Fig. 6). The absence of detectable focal MRI alterations in Ts1Cje mice, which do not develop the cholinergic deficits seen in Ts65Dn, further supports a conclusion that the MRI changes in Ts65Dn are related to the cholinergic neuronal degeneration. These findings are consistent with recent observations that chronic cholinergic imbalance induced by overexpression of synaptic AChE alters water diffusion and ion transport and influences diffusion-weighted and perfusion MRI parameters [49].
Several research studies have established that paramagnetic iron increases proton transverse relaxation rates (R2=1/T2), and that the relaxation of solvent protons is proportional to the concentration of paramagnetic ions [34]. Aberrant iron deposition has been described in numerous age-related neurodegenerative diseases including AD and DS [34,38,48]. For example, individuals with DS display impaired iron metabolism and abnormal iron and lactotransferrin accumulation in the cerebral cortex [39,62]. Observed T2 changes may also arise from elevated iron accumulation or alterations of normal iron homeostasis [5,6] secondary to neuronal atrophy. Moreover, dendritic branches and endosomes express a high density of the transferrin receptor [15]. Therefore, the increased endocytosis implied by the endosome pathology seen in Ts65Dn might contribute to the development of regions of VBT2 by altering the distribution of iron-containing proteins in endosomal/lysosomal compartments in a cell-specific manner.
In conclusion, using quantitative MRI, we were able to detect pathophysiology in regions displaying a loss of the cholinergic phenotype that is observed in the Ts65Dn mouse model of DS. The observed selective vulnerability of this circuit is relevant to the study of human pathobiology, as selective vulnerability of specific neuronal populations is a consistent feature of several neurodegenerative disorders including AD and DS. Cholinergic abnormalities and the associated MRI abnormalities were not found in Ts1Cje mice where the region of MMU16 from App to Sod1 is at 2N levels, underscoring the importance of App triplication as well as possibly one or more adjacent candidate genes that await further characterization. The studies highlight the potential value of in vivo quantitative imaging in concert with chemoanatomic quantitative morphometry to characterize the nature and distribution of brain pathology in mouse models of human neurodegenerative disorders.
Acknowledgments
These studies were supported by grants from the National Institute on Aging AG17617 and AG09466.
Footnotes
Disclosure Statement: The authors have no actual or potential conflicts of interest to disclose.
Publisher's Disclaimer: This is a PDF file of an unedited manuscript that has been accepted for publication. As a service to our customers we are providing this early version of the manuscript. The manuscript will undergo copyediting, typesetting, and review of the resulting proof before it is published in its final citable form. Please note that during the production process errors may be discovered which could affect the content, and all legal disclaimers that apply to the journal pertain.
References
- 1.Antonarakis SE, Lyle R, Chrast R, Scott HS. Differential gene expression studies to explore the molecular pathophysiology of Down syndrome. Brain Res Brain Res Rev. 2001;36(23):265–74. doi: 10.1016/s0165-0173(01)00103-5. [DOI] [PubMed] [Google Scholar]
- 2.Antonarakis SE, Lyle R, Dermitzakis ET, Reymond A, Deutsch S. Chromosome 21 and down syndrome: from genomics to pathophysiology. Nat Rev Genet. 2004;5(10):725–38. doi: 10.1038/nrg1448. [DOI] [PubMed] [Google Scholar]
- 3.Apelt J, Kumar A, Schliebs R. Impairment of cholinergic neurotransmission in adult and aged transgenic Tg2576 mouse brain expressing the Swedish mutation of human beta-amyloid precursor protein. Brain Res. 2002;953(12):17–30. doi: 10.1016/s0006-8993(02)03262-6. [DOI] [PubMed] [Google Scholar]
- 4.Ardekani BA, Guckemus S, Bachman A, Hoptman MJ, Wojtaszek M, Nierenberg J. Quantitative comparison of algorithms for inter-subject registration of 3D volumetric brain MRI scans. J Neurosci Methods. 2005;142(1):67–76. doi: 10.1016/j.jneumeth.2004.07.014. [DOI] [PubMed] [Google Scholar]
- 5.Bakshi R, Benedict RH, Bermel RA, Caruthers SD, Puli SR, Tjoa CW, Fabiano AJ, Jacobs L. T2 hypointensity in the deep gray matter of patients with multiple sclerosis: a quantitative magnetic resonance imaging study. Arch Neurol. 2002;59(1):62–8. doi: 10.1001/archneur.59.1.62. [DOI] [PubMed] [Google Scholar]
- 6.Bakshi R, Dmochowski J, Shaikh ZA, Jacobs L. Gray matter T2 hypointensity is related to plaques and atrophy in the brains of multiple sclerosis patients. J Neurol Sci. 2001;185(1):19–26. doi: 10.1016/s0022-510x(01)00477-4. [DOI] [PubMed] [Google Scholar]
- 7.Bartus RT. On neurodegenerative diseases, models, and treatment strategies: lessons learned and lessons forgotten a generation following the cholinergic hypothesis. Exp Neurol. 2000;163(2):495–529. doi: 10.1006/exnr.2000.7397. [DOI] [PubMed] [Google Scholar]
- 8.Baxter LL, Moran TH, Richtsmeier JT, Troncoso J, Reeves RH. Discovery and genetic localization of Down syndrome cerebellar phenotypes using the Ts65Dn mouse. Hum Mol Genet. 2000;9(2):195–202. doi: 10.1093/hmg/9.2.195. [DOI] [PubMed] [Google Scholar]
- 9.Baxter MG, Chiba AA. Cognitive functions of the basal forebrain. Curr Opin Neurobiol. 1999;9(2):178–83. doi: 10.1016/s0959-4388(99)80024-5. [DOI] [PubMed] [Google Scholar]
- 10.Belichenko PV, Masliah E, Kleschevnikov AM, Villar AJ, Epstein CJ, Salehi A, Mobley WC. Synaptic structural abnormalities in the Ts65Dn mouse model of Down Syndrome. J Comp Neurol. 2004;480(3):281–98. doi: 10.1002/cne.20337. [DOI] [PubMed] [Google Scholar]
- 11.Bierer LM, Haroutunian V, Gabriel S, Knott PJ, Carlin LS, Purohit DP, Perl DP, Schmeidler J, Kanof P, Davis KL. Neurochemical correlates of dementia severity in Alzheimer's disease: relative importance of the cholinergic deficits. J Neurochem. 1995;64(2):749–60. doi: 10.1046/j.1471-4159.1995.64020749.x. [DOI] [PubMed] [Google Scholar]
- 12.Bigl V, Woolf NJ, Butcher LL. Cholinergic projections from the basal forebrain to frontal, parietal, temporal, occipital, and cingulate cortices: a combined fluorescent tracer and acetylcholinesterase analysis. Brain Res Bull. 1982;8(6):727–49. doi: 10.1016/0361-9230(82)90101-0. [DOI] [PubMed] [Google Scholar]
- 13.Busciglio J, Pelsman A, Wong C, Pigino G, Yuan M, Mori H, Yankner BA. Altered metabolism of the amyloid beta precursor protein is associated with mitochondrial dysfunction in Down's syndrome. Neuron. 2002;33(5):677–88. doi: 10.1016/s0896-6273(02)00604-9. [DOI] [PubMed] [Google Scholar]
- 14.Capone GT. Down syndrome: advances in molecular biology and the neurosciences. J Dev Behav Pediatr. 2001;22(1):40–59. doi: 10.1097/00004703-200102000-00007. [DOI] [PubMed] [Google Scholar]
- 15.Cataldo AM, Hamilton DJ, Barnett JL, Paskevich PA, Nixon RA. Properties of the endosomal-lysosomal system in the human central nervous system: disturbances mark most neurons in populations at risk to degenerate in Alzheimer's disease. J Neurosci. 1996;16:186–99. doi: 10.1523/JNEUROSCI.16-01-00186.1996. [DOI] [PMC free article] [PubMed] [Google Scholar]
- 16.Cataldo AM, Petanceska S, Peterhoff CM, Terio NB, Epstein CJ, Villar A, Carlson EJ, Staufenbiel M, Nixon RA. App gene dosage modulates endosomal abnormalities of Alzheimer's disease in a segmental trisomy 16 mouse model of down syndrome. J Neurosci. 2003;23(17):6788–92. doi: 10.1523/JNEUROSCI.23-17-06788.2003. [DOI] [PMC free article] [PubMed] [Google Scholar]
- 17.Contestabile A, Fila T, Bartesaghi R, Ciani E. Choline acetyltransferase activity at different ages in brain of Ts65Dn mice, an animal model for Down's syndrome and related neurodegenerative diseases. J Neurochem. 2006;97(2):515–26. doi: 10.1111/j.1471-4159.2006.03769.x. [DOI] [PubMed] [Google Scholar]
- 18.Cooper JD, Salehi A, Delcroix JD, Howe CL, Belichenko PV, Chua-Couzens J, Kilbridge JF, Carlson EJ, Epstein CJ, Mobley WC. Failed retrograde transport of NGF in a mouse model of Down's syndrome: reversal of cholinergic neurodegenerative phenotypes following NGF infusion. Proc Natl Acad Sci U S A. 2001;98(18):10439–44. doi: 10.1073/pnas.181219298. [DOI] [PMC free article] [PubMed] [Google Scholar]
- 19.Costa AC, Grybko MJ. Deficits in hippocampal CA1 LTP induced by TBS but not HFS in the Ts65Dn mouse: a model of Down syndrome. Neurosci Lett. 2005;382(3):317–22. doi: 10.1016/j.neulet.2005.03.031. [DOI] [PubMed] [Google Scholar]
- 20.Davies P, Maloney AJ. Selective loss of central cholinergic neurons in Alzheimer's disease. Lancet. 1976;2(8000):1403. doi: 10.1016/s0140-6736(76)91936-x. [DOI] [PubMed] [Google Scholar]
- 21.Davisson MT, Schmidt C, Akeson EC. Segmental trisomy of murine chromosome 16: a new model system for studying Down syndrome. Prog Clin Biol Res. 1990;360:263–80. [PubMed] [Google Scholar]
- 22.Davisson MT, Schmidt C, Reeves RH, Irving NG, Akeson EC, Harris BS, Bronson RT. Segmental trisomy as a mouse model for Down syndrome. Prog Clin Biol Res. 1993;384:117–33. [PubMed] [Google Scholar]
- 23.Dijkhuizen RM, Ren J, Mandeville JB, Wu O, Ozdag FM, Moskowitz MA, Rosen BR, Finklestein SP. Functional magnetic resonance imaging of reorganization in rat brain after stroke. Proc Natl Acad Sci USA. 2001;98(22):12766–71. doi: 10.1073/pnas.231235598. [DOI] [PMC free article] [PubMed] [Google Scholar]
- 24.Eckenstein FP, Baughman RW, Quinn J. An anatomical study of cholinergic innervation in rat cerebral cortex. Neuroscience. 1988;25(2):457–74. doi: 10.1016/0306-4522(88)90251-5. [DOI] [PubMed] [Google Scholar]
- 25.Falangola MF, Dyakin VV, Lee SP, Bogart A, Babb JS, Duff K, Nixon R, Helpern JA. Quantitative MRI reveals aging-associated T2 changes in mouse models of Alzheimer's disease. NMR Biomed. 2007;20(3):343–51. doi: 10.1002/nbm.1163. [DOI] [PubMed] [Google Scholar]
- 26.Ferrer I, Gullotta F. Down's syndrome and Alzheimer's disease: dendritic spine counts in the hippocampus. Acta Neuropathol (Berl) 1990;79(6):680–5. doi: 10.1007/BF00294247. [DOI] [PubMed] [Google Scholar]
- 27.Ginsberg SD, Che S, Wuu J, Counts SE, Mufson EJ. Down regulation of trk but not p75 gene expression in single cholinergic basal forebrain neurons mark the progression of Alzheimer's disease. J Neurochem. 2006;97(2):475–87. doi: 10.1111/j.1471-4159.2006.03764.x. [DOI] [PubMed] [Google Scholar]
- 28.Ginsberg SD, Martin LJ. Axonal transection in adult rat brain induces transsynaptic apoptosis and persistent atrophy of target neurons. J Neurotrauma. 2002;19:99–109. doi: 10.1089/089771502753460277. [DOI] [PubMed] [Google Scholar]
- 29.Ginsberg SD, Martin LJ. Ultrastructural analysis of the progression of neurodegeneration in the septum following fimbria-fornix transection. Neuroscience. 1998;86:1259–72. doi: 10.1016/s0306-4522(98)00136-5. [DOI] [PubMed] [Google Scholar]
- 30.Ginsberg SD, Rothstein JD, Price DL, Martin LJ. Fimbria-fornix transections selectively down-regulate subtypes of glutamate transporter and glutamate receptor proteins in septum and hippocampus. J Neurochem. 1996;67:1208–16. doi: 10.1046/j.1471-4159.1996.67031208.x. [DOI] [PubMed] [Google Scholar]
- 31.Granholm AC, Sanders LA, Crnic LS. Loss of cholinergic phenotype in basal forebrain coincides with cognitive decline in a mouse model of Down's syndrome. Exp Neurol. 2000;161(2):647–63. doi: 10.1006/exnr.1999.7289. [DOI] [PubMed] [Google Scholar]
- 32.Guilfoyle DN, Dyakin VV, O'Shea J, Pell GS, Helpern JA. Quantitative measurements of proton spin-lattice (T1) and spin-spin (T2) relaxation times in the mouse brain at 7.0 T. Magn Reson Med. 2003;49(3):576–80. doi: 10.1002/mrm.10371. [DOI] [PubMed] [Google Scholar]
- 33.Gyure KA, Durham R, Stewart WF, Smialek JE, Troncoso JC. Intraneuronal abeta-amyloid precedes development of amyloid plaques in Down syndrome. Arch Pathol Lab Med. 2001;125(4):489–92. doi: 10.5858/2001-125-0489-IAAPDO. [DOI] [PubMed] [Google Scholar]
- 34.Haacke EM, Cheng NY, House MJ, Liu Q, Neelavalli J, Ogg RJ, Khan A, Ayaz M, Kirsch W, Obenaus A. Imaging iron stores in the brain using magnetic resonance imaging. Magn Reson Imaging. 2005;23(1):1–25. doi: 10.1016/j.mri.2004.10.001. [DOI] [PubMed] [Google Scholar]
- 35.Harmon KM, Wellman CL. Differential effects of cholinergic lesions on dendritic spines in frontal cortex of young adult and aging rats. Brain Res. 2003;992(1):60–8. doi: 10.1016/j.brainres.2003.08.029. [DOI] [PubMed] [Google Scholar]
- 36.Hebert LE, Beckett LA, Scherr PA, Evans DA. Annual incidence of Alzheimer disease in the United States projected to the years 2000 through 2050. Alzheimer Dis Assoc Disord. 2001;15(4):169–73. doi: 10.1097/00002093-200110000-00002. [DOI] [PubMed] [Google Scholar]
- 37.Hefti F. Nerve growth factor promotes survival of septal cholinergic neurons after fimbrial transections. J Neurosci. 1986;6:2155–62. doi: 10.1523/JNEUROSCI.06-08-02155.1986. [DOI] [PMC free article] [PubMed] [Google Scholar]
- 38.Helpern JA, Jensen J, Lee SP, Falangola MF. Quantitative MRI assessment of Alzheimer's disease. J Mol Neurosci. 2004;24(1):45–8. doi: 10.1385/JMN:24:1:045. [DOI] [PubMed] [Google Scholar]
- 39.Hodgkins PS, Prasher V, Farrar G, Armstrong R, Sturman S, Corbett J, Blair JA. Reduced transferrin binding in Down syndrome: a route to senile plaque formation and dementia. Neuroreport. 1993;5(1):21–4. doi: 10.1097/00001756-199310000-00005. [DOI] [PubMed] [Google Scholar]
- 40.Holtzman DM, Li YW, DeArmond SJ, McKinley MP, Gage FH, Epstein CJ, Mobley WC. Mouse model of neurodegeneration: atrophy of basal forebrain cholinergic neurons in trisomy 16 transplants. Proc Natl Acad Sci U S A. 1992;89(4):1383–7. doi: 10.1073/pnas.89.4.1383. [DOI] [PMC free article] [PubMed] [Google Scholar]
- 41.Holtzman DM, Santucci D, Kilbridge J, Chua-Couzens J, Fontana DJ, Daniels SE, Johnson RM, Chen K, Sun Y, Carlson E, Alleva E, Epstein CJ, Mobley WC. Developmental abnormalities and age-related neurodegeneration in a mouse model of Down syndrome. Proc Natl Acad Sci U S A. 1996;93(23):13333–8. doi: 10.1073/pnas.93.23.13333. [DOI] [PMC free article] [PubMed] [Google Scholar]
- 42.Howe CL, Mobley WC. Signaling endosome hypothesis: A cellular mechanism for long distance communication. J Neurobiol. 2004;58(2):207–16. doi: 10.1002/neu.10323. [DOI] [PubMed] [Google Scholar]
- 43.Hunter CL, Bimonte-Nelson HA, Nelson M, Eckman CB, Granholm AC. Behavioral and neurobiological markers of Alzheimer's disease in Ts65Dn mice: effects of estrogen. Neurobiol Aging. 2004;25(7):873–84. doi: 10.1016/j.neurobiolaging.2003.10.010. [DOI] [PubMed] [Google Scholar]
- 44.Iwatsubo T, Mann DMA, Odaka A, Suzuki N, Ihara Y. Amyloid-β protein (Aβ) deposition: Aβ42(43) precedes Aβ40 in Down's syndrome. Ann Neurol. 1995;37:294–9. doi: 10.1002/ana.410370305. [DOI] [PubMed] [Google Scholar]
- 45.Kleschevnikov AM, Belichenko PV, Villar AJ, Epstein CJ, Malenka RC, Mobley WC. Hippocampal long-term potentiation suppressed by increased inhibition in the Ts65Dn mouse, a genetic model of Down syndrome. J Neurosci. 2004;24(37):8153–60. doi: 10.1523/JNEUROSCI.1766-04.2004. [DOI] [PMC free article] [PubMed] [Google Scholar]
- 46.Köhler C, Chan-Palay V, Wu JY. Septal neurons containing glutamic acid decarboxylase immunoreactivity project to the hippocampal region in the rat brain. Anatomy and Embryology. 1984;169:41–4. doi: 10.1007/BF00300585. [DOI] [PubMed] [Google Scholar]
- 47.Kromer LF. Nerve growth factor treatment after brain injury prevents neuronal death. Science. 1987;235:214–6. doi: 10.1126/science.3798108. [DOI] [PubMed] [Google Scholar]
- 48.Mattson MP. Metal-catalyzed disruption of membrane protein and lipid signaling in the pathogenesis of neurodegenerative disorders. Ann N Y Acad Sci. 2004;1012:37–50. doi: 10.1196/annals.1306.004. [DOI] [PubMed] [Google Scholar]
- 49.Meshorer E, Biton IE, Ben-Shaul Y, Ben-Ari S, Assaf Y, Soreq H, Cohen Y. Chronic cholinergic imbalances promote brain diffusion and transport abnormalities. Faseb J. 2005;19(8):910–22. doi: 10.1096/fj.04-2957com. [DOI] [PubMed] [Google Scholar]
- 50.Mesulam MM, Mufson EJ, Levey AI, Wainer BH. Cholinergic innervation of cortex by the basal forebrain: cytochemistry and cortical connections of the septal area, diagonal band nuclei, nucleus basalis (substantia innominata), and hypothalamus in the rhesus monkey. J Comp Neurol. 1983;214(2):170–97. doi: 10.1002/cne.902140206. [DOI] [PubMed] [Google Scholar]
- 51.Mesulam MM, Mufson EJ, Wainer BH, Levey AI. Central cholinergic pathways in the rat: an overview based on an alternative nomenclature (Ch1-Ch6) Neuroscience. 1983;10(4):1185–201. doi: 10.1016/0306-4522(83)90108-2. [DOI] [PubMed] [Google Scholar]
- 52.Mufson EJ, Bothwell M, Hersh LB, Kordower JH. Nerve growth factor receptor immunoreactive profiles in the normal, aged human basal forebrain: colocalization with cholinergic neurons. J Comp Neurol. 1989;285(2):196–217. doi: 10.1002/cne.902850204. [DOI] [PubMed] [Google Scholar]
- 53.Mufson EJ, Bothwell M, Kordower JH. Loss of nerve growth factor receptor-containing neurons in Alzheimer's disease: a quantitative analysis across subregions of the basal forebrain. Exp Neurol. 1989;105(3):221–32. doi: 10.1016/0014-4886(89)90124-6. [DOI] [PubMed] [Google Scholar]
- 54.Mufson EJ, Counts SE, Che S, Ginsberg SD. Neuronal gene expression profiling: uncovering the molecular biology of neurodegenerative disease. Prog Brain Res. 2006;158:197–222. doi: 10.1016/S0079-6123(06)58010-0. [DOI] [PubMed] [Google Scholar]
- 55.Mufson EJ, Ginsberg SD, Ikonomovic MD, DeKosky ST. Human cholinergic basal forebrain: chemoanatomy and neurologic dysfunction. J Chem Neuroanat. 2003;26(4):233–42. doi: 10.1016/s0891-0618(03)00068-1. [DOI] [PubMed] [Google Scholar]
- 56.Naumann T, Linke R, Frotscher M. Fine structure of rat septohippocampal neurons. I. Identification of septohippocampal projections neurons by retrograde tracing combined with electron microscopic immunocytochemistry and intracellular staining. J Comp Neurol. 1992;325:207–18. doi: 10.1002/cne.903250206. [DOI] [PubMed] [Google Scholar]
- 57.Nixon RA. Endosome function and dysfunction in Alzheimer's disease and other neurodegenerative diseases. Neurobiol Aging. 2005;26(3):373–82. doi: 10.1016/j.neurobiolaging.2004.09.018. [DOI] [PubMed] [Google Scholar]
- 58.Nixon RA, Cataldo AM. Lysosomal system pathways: genes to neurodegeneration in Alzheimer's disease. J Alzheimers Dis. 2006;9(3 Suppl):277–89. doi: 10.3233/jad-2006-9s331. [DOI] [PubMed] [Google Scholar]
- 59.Olson LE, Roper RJ, Baxter LL, Carlson EJ, Epstein CJ, Reeves RH. Down syndrome mouse models Ts65Dn, Ts1Cje, and Ms1Cje/Ts65Dn exhibit variable severity of cerebellar phenotypes. Dev Dyn. 2004;230(3):581–9. doi: 10.1002/dvdy.20079. [DOI] [PubMed] [Google Scholar]
- 60.Paxinos G, Franklin KBJ. The Mouse Brain in Stereotaxic Coordinates. Second. San Diego: Academic Press; 2001. [Google Scholar]
- 61.Prasher VP, Farrer MJ, Kessling AM, Fisher EM, West RJ, Barber PC, Butler AC. Molecular mapping of Alzheimer-type dementia in Down's syndrome. Ann Neurol. 1998;43(3):380–3. doi: 10.1002/ana.410430316. [DOI] [PubMed] [Google Scholar]
- 62.Prasher VP, Gosling P, Blair J. Role of iron in Alzheimer-type dementia in Down syndrome. Int J Geriatr Psychiatry. 1998;13(11):818–9. doi: 10.1002/(sici)1099-1166(1998110)13:11<818::aid-gps864>3.0.co;2-k. [DOI] [PubMed] [Google Scholar]
- 63.Reeves RH, Irving NG, Moran TH, Wohn A, Kitt C, Sisodia SS, Schmidt C, Bronson RT, Davisson MT. A mouse model for Down syndrome exhibits learning and behaviour deficits. Nat Genet. 1995;11(2):177–84. doi: 10.1038/ng1095-177. [DOI] [PubMed] [Google Scholar]
- 64.Robertson RT, Gallardo KA, Claytor KJ, Ha DH, Ku KH, Yu BP, Lauterborn JC, Wiley RG, Yu J, Gall CM, Leslie FM. Neonatal treatment with 192 IgG-saporin produces long-term forebrain cholinergic deficits and reduces dendritic branching and spine density of neocortical pyramidal neurons. Cereb Cortex. 1998;8(2):142–55. doi: 10.1093/cercor/8.2.142. [DOI] [PubMed] [Google Scholar]
- 65.Rovelet-Lecrux A, Hannequin D, Raux G, Meur NL, Laquerriere A, Vital A, Dumanchin C, Feuillette S, Brice A, Vercelletto M, Dubas F, Frebourg T, Campion D. APP locus duplication causes autosomal dominant early-onset Alzheimer disease with cerebral amyloid angiopathy. Nat Genet. 2006;38(1):24–6. doi: 10.1038/ng1718. [DOI] [PubMed] [Google Scholar]
- 66.Rovira A, Alonso J, Cucurella G, Nos C, Tintore M, Pedraza S, Rio J, Montalban X. Evolution of multiple sclerosis lesions on serial contrast-enhanced T1-weighted and magnetization-transfer MR images. AJNR Am J Neuroradiol. 1999;20(10):1939–45. [PMC free article] [PubMed] [Google Scholar]
- 67.Sago H, Carlson EJ, Smith DJ, Kilbridge J, Rubin EM, Mobley WC, Epstein CJ, Huang TT. Ts1Cje, a partial trisomy 16 mouse model for Down syndrome, exhibits learning and behavioral abnormalities. PNAS. 1998;95(11):6256–61. doi: 10.1073/pnas.95.11.6256. [DOI] [PMC free article] [PubMed] [Google Scholar]
- 68.Salehi A, Delcroix JD, Belichenko PV, Zhan K, Wu C, Valletta JS, Takimoto-Kimura R, Kleschevnikov AM, Sambamurti K, Chung PP, Xia W, Villar A, Campbell WA, Kulnane LS, Nixon RA, Lamb BT, Epstein CJ, Stokin GB, Goldstein LS, Mobley WC. Increased App expression in a mouse model of Down's syndrome disrupts NGF transport and causes cholinergic neuron degeneration. Neuron. 2006;51(1):29–42. doi: 10.1016/j.neuron.2006.05.022. [DOI] [PubMed] [Google Scholar]
- 69.Seo H, Isacson O. Abnormal APP, cholinergic and cognitive function in Ts65Dn Down's model mice. Exp Neurol. 2005;193(2):469–80. doi: 10.1016/j.expneurol.2004.11.017. [DOI] [PubMed] [Google Scholar]
- 70.Siarey RJ, Carlson EJ, Epstein CJ, Balbo A, Rapoport SI, Galdzicki Z. Increased synaptic depression in the Ts65Dn mouse, a model for mental retardation in Down syndrome. Neuropharmacology. 1999;38(12):1917–20. doi: 10.1016/s0028-3908(99)00083-0. [DOI] [PubMed] [Google Scholar]
- 71.Siarey RJ, Stoll J, Rapoport SI, Galdzicki Z. Altered long-term potentiation in the young and old Ts65Dn mouse, a model for Down Syndrome. Neuropharmacology. 1997;36(1112):1549–54. doi: 10.1016/s0028-3908(97)00157-3. [DOI] [PubMed] [Google Scholar]
- 72.Sofroniew MV, Galletly NP, Isacson O, Svendsen CN. Survival of adult basal forebrain cholinergic neurons after loss of target neurons. Science. 1990;247:338–42. doi: 10.1126/science.1688664. [DOI] [PubMed] [Google Scholar]
- 73.Suetsugu M, Mehraein P. Spine distribution along the apical dendrites of the pyramidal neurons in Down's syndrome. A quantitative Golgi study. Acta Neuropathol (Berl) 1980;50(3):207–10. doi: 10.1007/BF00688755. [DOI] [PubMed] [Google Scholar]
- 74.Swanson LW, Cowan WM. The connections of the septal region in the rat. J Comp Neurol. 1979;186:621–56. doi: 10.1002/cne.901860408. [DOI] [PubMed] [Google Scholar]
- 75.Tuszynski MH, Thal L, Pay M, Salmon DP, U HS, Bakay R, Patel P, Blesch A, Vahlsing HL, Ho G, Tong G, Potkin SG, Fallon J, Hansen L, Mufson EJ, Kordower JH, Gall C, Conner JM. A Phase I clinical trial of nerve growth factor gene therapy for Alzheimer's disease. Nat Med. 2005;11:551–5. doi: 10.1038/nm1239. [DOI] [PubMed] [Google Scholar]
- 76.Villar AJ, Belichenko PV, Gillespie AM, Kozy HM, Mobley WC, Epstein CJ. Identification and characterization of a new Down syndrome model, Ts[Rb(12.1716)]2Cje, resulting from a spontaneous Robertsonian fusion between T(171)65Dn and mouse chromosome 12. Mamm Genome. 2005;16(2):79–90. doi: 10.1007/s00335-004-2428-7. [DOI] [PubMed] [Google Scholar]
- 77.Whitehouse PJ, Price DL, Struble RG, Clark AW, Coyle JT, Delong MR. Alzheimer's disease and senile dementia: loss of neurons in the basal forebrain. Science. 1982;215(4537):1237–9. doi: 10.1126/science.7058341. [DOI] [PubMed] [Google Scholar]
- 78.Wisniewski KE, Dalton AJ, Crapper McLachlan DR, Wen GY, Wisniewski HM. Alzheimer's disease in Down's syndrome: clinicopathologic studies. Neurology. 1985;35:957–61. doi: 10.1212/wnl.35.7.957. [DOI] [PubMed] [Google Scholar]
- 79.Woolf NJ. Cholinoceptive cells in rat cerebral cortex: somatodendritic immunoreactivity for muscarinic receptor and cytoskeletal proteins. J Chem Neuroanat. 1993;6(6):375–90. doi: 10.1016/0891-0618(93)90012-s. [DOI] [PubMed] [Google Scholar]
- 80.Zheng F, Khanna S. Selective destruction of medial septal cholinergic neurons attenuates pyramidal cell suppression, but not excitation in dorsal hippocampus field CA1 induced by subcutaneous injection of formalin. Neuroscience. 2001;103(4):985–98. doi: 10.1016/s0306-4522(01)00006-9. [DOI] [PubMed] [Google Scholar]