

Abstract
Lack of physical activity may be an important etiological factor in the current epidemiological transition characterised by increasing prevalence of obesity and chronic diseases in sub-Sahara Africa. However, there is a dearth of data on objectively measured physical activity energy expenditure (PAEE) in this region. We sought to develop regression equations using body composition and accelerometer counts to predict PAEE. We conducted a cross-sectional study of 33 adult volunteers from an urban (n=16) and a rural (n=17) residential site in Cameroon. Energy expenditure was measured by doubly labelled water over a period of 7 consecutive days. Simultaneously, a hip-mounted Actigraph® accelerometer recorded body movement. PAEE prediction equations were derived using accelerometer counts, age, sex and body composition variables, and cross-validated by the jack-knife method. The Bland and Altman limits of agreement (LOA) approach was used to assess agreement. Our results show that PAEE (kJ·kg−1·day−1) was significantly and positively correlated with activity counts from the accelerometer (r=0.37, p=0.03). The derived equations explained 14 to 40% of the variance in PAEE. Age, sex and accelerometer counts together explained 34% of the variance in PAEE, with accelerometer counts alone explaining 14%. The LOA between DLW and the derived equations were wide, with predicted PAEE being up to 60 kJ·kg−1·day−1 below or above the measured value. In summary, the derived equations performed better than existing published equations in predicting PAEE from accelerometer counts in this population. Accelerometry could be used to predict PAEE in this population and therefore has important applications for monitoring population levels of total physical activity patterns.
INTRODUCTION
Sub-Sahara Africa and other developing regions of the world are undergoing an epidemiologic transition (1) characterised by rising prevalence of obesity, diabetes and cardiovascular diseases (CVDs) (2-4). This transition is closely associated with the adoption of urban-industrial lifestyles with large shifts in diet and physical activity patterns (4-6). Over the past few decades, the physical activity patterns in the developing regions of the world have been changing from labour-intensive lifestyles to more sedentary and less physically demanding activities. Few studies using objective methods (7, 8) have examined the association between various dimensions or domains of physical activity with obesity, diabetes and other CVD risk factors in Sub-Sahara African populations. Many others have assessed physical activity only by self-report (9, 10). There is little objective data to confirm the declining population physical activity levels worldwide. Reports on levels, time trends or patterns of physical activity in the SSA population and other developing countries have been more speculative or based on subjective methods rather than on data from objectively measured physical activity (6, 10-12).
This is not surprising since physical activity is a complex multi-dimensional behaviour, including different dimensions (type, intensity, duration, frequency) and domains where activity takes place. Gold standard methods for measurement of free-living total energy expenditure (TEE) such as doubly labelled water (DLW) are not suitable for large population studies. The accuracy of questionnaires is limited by recall bias as well as the difficulty in assessing all dimensions and domains of physical activity by these types of instruments (13, 14). Objective methods such as accelerometry (15), heart rate monitoring (16) and combined movement and heart rate monitoring (17) are considered to be more accurate than self-report methods and are becoming more solicited for measuring physical activity in epidemiological studies in developed countries, and probably also in developing countries in the near future.
Accelerometry has the advantage that it can provide objective information on the amount, intensity, frequency and duration of PA, and could also be used for prediction of physical activity energy expenditure (PAEE) in field settings (18, 19). The use of accelerometry may therefore offer an opportunity to more accurately predict PAEE and investigate how this variable and its different subcomponents relate to disease outcomes such as obesity and type 2 diabetes in the Sub-Sahara African population.
The aim of this study was therefore to develop prediction equations for PAEE using accelerometry-derived variables and other individual characteristics in free-living adults in Sub-Sahara Africa using PAEE measured by the DLW method combined with a measure of resting energy expenditure (REE) as the criterion. We also evaluated the validity of three other previously published equations for estimating free-living PAEE (18-20).
METHODS AND PROCEDURES
Participants
The participants for this study were 35 adult volunteers recruited from an urban (Yaoundé: 9 men and 8 women) and a rural (Bafut: 9 men and 9 women) area of Cameroon to take into account potential differences in physical activity due to residential area (10). The volunteers were all between 25 and 50 years old – data on age, occupational history and other descriptive socio-demographic variables were collected through an interview. The urban site was a middle class residential area of Yaoundé, the capital city of Cameroon. The houses here are grouped closely together and arranged in blocks with paved road access. The rural site is a rural settlement area where the inhabitants are mainly farmers and/or traders. The rural habitation pattern is sparse with most of the homes and farms accessed only via foot paths.
Ethical approval for the study was obtained from the Cameroon National Ethics Committee and all participants provided signed informed consent. One volunteer withdrew from the study and is therefore excluded from the analyses. Another volunteer who had a very rapid turnover rate of the DLW isotopes resulting in unrealistic data was also excluded from these analyses (the volunteer had an exaggerated rate of turnover of body water due to excessive drinking). The present analyses were therefore carried out in 33 volunteers.
Anthropometry
Height without shoes was measured using a standard rigid stadiometer. Waist and hip circumferences were measured to the nearest 0.1 cm using a D-loop non-stretch fibreglass tape measure with participants wearing light indoor clothing. The waist circumference was measured at the mid-point between the lower costal margin and the level of the anterior superior iliac crests. The hip circumference was measured to the nearest 0.1 cm at the level of the greater trochanters. Body weight and body composition were measured using bio-impedance (Tanita® TBF-531 scales, Tanita UK Ltd, Uxbridge, Middlesex, UK) according to manufacturer's instructions.
Resting energy expenditure
Resting energy expenditure (REE) was measured using the MedGem® handheld indirect calorimeter (HealtheTech Inc., Golden, Colorado, USA). This device has previously been validated in adults in field settings against indirect calorimetry (21) and the Douglas bag method (22). Briefly, this device measures oxygen consumption using breath-by-breath sampling over a duration of approximately 10 minutes. The principle of operation is based on the deactivation of ruthenium in the presence of oxygen. The active and reference ruthenium cells are excited by an internal light source and fluoresce. In the presence of oxygen, this reaction is quenched, and the amount of quenching is proportional to the concentration of oxygen in the sampled air (21). REE was calculated on a breath-by-breath interval using the Weir equation (23) assuming an RQ of 0.85. All measurements were performed under thermo-neutral conditions while the volunteers were sitting in a quiet room after an over-night fast and having refrained from caffeine, nicotine or exercise for at least 4 hours. Breath-by-breath data was collected for each volunteer over approximately 8 to 10 minutes. The first 2 minutes of data collected was discarded. Thereafter, data points of less than 1.5 ml O2/kg body weight/min (approximately < 115 ml O2/min) or over 1000 ml O2/min were discarded since these were considered unrealistic resting values. The REE was then calculated as the mean of the interquartile range of the remaining values.
Free-living energy expenditure
The DLW technique was used as criterion measure of TEE for seven continuous days. Two baseline pre-dose urine samples were collected on separate days prior to the administration of the DLW dose. Due to logistic constraints, the DLW-doses could not be prepared in the field during recruitment and testing, so three standard doses were pre-prepared and bottled ready for use in the field. The doses were calculated based on three standard volunteer weights of 65, 75, and 85 kg. For each standard weight a dose containing the equivalent to 174 mg/kg body weight of 18O and 70mg/kg body weight of 2H was prepared by mixing the required quantities together. Each volunteer was given the dose of DLW for the standard weight immediately above their actual weight, except volunteers who weighed more than 85 kg (n=8) who received the dose prepared for 85 kg. All volunteers were requested to provide the first post-dose urine sample approximately 24 hours after the administration of the DLW dose and then at a similar time every day for the next six days, discarding the first void after getting out of bed. The samples were collected in 5-ml plastic screw-top vials, refrigerated by volunteers and then picked up daily from their homes by fieldworkers. Samples were then stored at −20°C at the National Obesity Centre in Yaoundé until transported to the Medical Research Council Collaborative Centre for Human Nutrition Research, Cambridge, UK.
Isotopic enrichment of all samples was analysed in duplicate with minor modifications to procedures described in detail elsewhere (24). Briefly, for 2H/1H ratios 0.4 ml sample was equilibrated with 3 ml H2 gas at 1 bar and 22 °C for 6 hours in the presence of a Pt catalyst. The equilibrated gas samples were then measured relative to an arbitrary hydrogen reference gas using dual inlet isotope ratio mass spectrometry (Sira 10, Micromass, Wythenshaw, UK) and then enrichment values calculated on the SMOW/SLAP scale using laboratory references (traceable to international standards) equilibrated and measured in the same way on each run. For 18O, 0.5 ml samples were equilibrated with 10 ml 5% CO2 in N2 at 1 bar at room temperature, overnight. Ratio measurements were made using an AP2003 continuous flow isotope ratio mass spectrometer (Analytical Precision Ltd, Northwich, Cheshire, UK) and enrichment values calculated on the SMOW/SLAP scale as described for the 2H data.
Rate constants for isotope disappearance were estimated using data from all the samples collected over the 7-day period, after base-line correction using the mean of the two pre-dose samples. If the rate of 18O disappearance exceeded 3 half-lives in this time, only samples taken up to 3 half lives were used in the calculation of TEE to maintain an equivalence in precision throughout the study (25). Isotope dilution spaces were calculated from the zero-time intercepts of the isotope disappearance curves. Average internal error of uncorrected CO2 production measurements was 5%, calculated as described in detail elsewhere (26, 27).
TEE was calculated by means of standard equations (26, 28); using Schoeller's estimation of CO2 production, which normalises 2H/18O space ratios to 1.04 / 1.01 = 1.03. TEE was then calculated from CO2 production assuming a respiratory quotient (RQ) of 0.85 (29). Average daily PAEE (kJ·day−1·kg−1) was calculated as average 24-hr TEE minus awake resting (REE) and sleeping energy expenditure (0.9·REE) assuming an average daily sleep duration of 8 hours, minus 10% of TEE to account for the thermogenic effect of food. The physical activity level (PAL) was calculated as TEE/REE.
Accelerometry
The GT1M Actigraph® accelerometer (Actigraph LLC, Fort Walton Beach, Florida, USA) was used for measuring free-living body movements. The accelerometers were preset to measure activity in 1 minute epochs (data recorded as counts per minute) over a period of 7 days. The volunteers were fitted with an Actigraph monitor worn on the waist using an elastic belt, with the monitor placed anteriorly just above the iliac crest. The volunteers were asked to wear the monitor continuously during both awake and sleep hours, removing them only for bathing, showering or swimming.
The original Actigraph data files (*.dat) were downloaded onto a personal computer and processed on a Microsoft Excel spreadsheet or using a custom-written programme (“MAHUFFE”, available from www.mrc-epid.cam.ac.uk). Volunteers wore the monitor continuously over the measurement period and all data collected were used in the analyses. The mean (SD) duration of wear was 6.5 (1.2) days. Outcome variables obtained were average daily activity counts (counts/day) and time (min/day) spent at different intensity levels. A threshold of 100 counts per minute (counts/min) was used to discriminate between sedentary and active time. Light intensity activity was defined as between 101 and 1951 counts/min, moderate intensity physical activity as 1952 to 5724 counts/min, and vigorous intensity activity > 5724 counts/min, corresponding to physiological intensity cut-points of 3, 6, and 9 METs during treadmill locomotion (20).
TEE was also predicted using 3 published regression equations; the Hendelman (19) and Swartz (18) equations which are based on a variety of lifestyle activities and the Freedson equation (20) which is based on treadmill locomotion. These published equations were applied to the minute-by-minute accelerometer counts (with the use of a correction factor of 1/0.91 to the account for difference in the Actigraph model used in this study) (30) and averaged over the entire measurement duration to obtain predicted daily TEE. All these equations have intercepts well above 1 MET, which if left uncensored would lead to spurious PAEE estimates (31). We dealt with this issue using a movement flex point approach; when accelerometer counts were less than 100 counts/min (i.e. during sedentary activities) resting energy expenditure was assumed, hence attributed a value of 1 MET, or the value of REE estimated using Schofield equations (32) was applied. TEE (in METs) estimated from these equations was converted to kJ·kg−1·day−1 by multiplying by a factor of 0.071. PAEE was calculated as TEE – REE, assuming an average daily sleep period of 8 hours during which basal energy expenditure was estimated at 90% of REE.
Statistical analyses
Analyses were carried out using STATA® version 10.1 (StataCorp, College Station, Texas, USA). Where applicable, the level of statistical significance was considered at P < 0.05.
Descriptive characteristics of the study sample are presented as means with standard deviations or as numbers with proportions, and stratified by rural/urban residential area. Student's t tests were used to assess differences in the descriptive variables between the rural and urban sites. Unadjusted Pearson's correlation was used to examine the association between the average daily activity counts from the accelerometer and mean daily PAEE measured by the DLW technique.
Multiple regression analyses were used to develop equations for predicting PAEE per kg body weight from accelerometer counts, age, sex and total body fat percentage in separate models, with and without a term for residency (rural-urban) (table 2). The jack-knife technique (“leave-one-out”) was employed to cross-validate the prediction equation on the study sample, i.e. calculating predictions of PAEE from n permutations of the equations derived on the whole sample except data from the individual for whom the prediction equation was intended (n-1) and then comparing this against measured PAEE (33). The mean bias (SE) and the root mean square error (RMSE) between PAEE measured by DLW and PAEE estimated by the newly derived equations, and the Hendelman (19), Swartz (18) and Freedson (20) published equations were calculated. The Bland and Altman method (34) was used to explore the limits of agreement between the measured and predicted PAEE.
Table 2.
Regression equations used in analyses to predict PAEE (kJ/kg/day) from recorded Actigraph counts and other descriptive variables in free-living healthy Cameroonian adults (n=33).
| Model | Equation | R2 |
|---|---|---|
| I a | 0.0787 DAC + 26.8199 | 0.14 |
| I b | 0.0778 DAC − 16.6543 urban + 35.9157 | 0.21 |
| II a | 0.0832 DAC + 1.2674 age + 25.8122 male sex − 30.5087 | 0.34 |
| II b | 0.0801 DAC + 1.0913 age + 25.9703 male sex − 15.1914 urban − 15.3301 | 0.40 |
| III a | 0.0842 DAC + 1.392 age + 23.3203 male sex − 0.197 BF − 28.1132 | 0.35 |
| III b | 0.0804 DAC + 1.1302 age + 25.2134 male sex − 0.0597 BF − 15.0907 urban − 14.7041 | 0.40 |
DAC; Daily average Actigraph Counts (×1000 counts/day), urban; residential site (rural=0, urban=1), age in years, male sex; sex (female=0, male=1), BF; body fat (%).
RESULTS
Descriptive characteristics for the volunteers are presented in table 1, for the whole sample and stratified by site (rural vs. urban). There was no significant rural-urban difference in age and anthropometric variables. The rural volunteers reported being engaged in more physically demanding jobs whereas urban volunteers had more sedentary jobs. Of the jobs in the rural site, 63% (15/24) could be classified as physically demanding whereas 74% (14/19) of those in the urban site were sedentary occupations. Seven of the 10 volunteers who reported having 2 jobs were from the rural site.
Table 1.
Descriptive characteristics of the study sample (n=33)
| All | Rural | Urban | P value | |
|---|---|---|---|---|
| Sex (M/F) | 16/17 | 8/9 | 8/8 | |
| Age (years) | 34.2 (7.3) | 35.4 (6.8) | 33.0 (7.8) | 0.3 |
| Occupation | ||||
| Active/physically demanding jobs | 20 | 15 (75%) | 5 (25%) | |
| Mostly sedentary jobs | 23 | 9 (39%) | 14 (61%) | |
| Two jobs/occupation | 10 | 7 (70%) | 3 (30%) | |
| Weight (kg) | 77.4 (13.1) | 77.6 (12.4) | 77.2 (14.3) | 0.9 |
| BMI (kg·m−2) | 27.1 (4.6) | 27.8 (4.7) | 26.25 (4.6) | 0.3 |
| Body Fat (%) | 29.6 (10.7) | 29.9 (9.7) | 29.4 (12) | 0.9 |
| Waist circumference (cm) | 90.5 (10.6) | 91.5 (9.5) | 89.4 (11.9) | 0.6 |
| TEE from DLW (MJ·day−1) | 12.44 (3.53) | 13.13 (4.16) | 11.71 (2.64) | 0.3 |
| REE from MedGem® (MJ·day−1) | 6.91 (0.92) | 6.89 (0.92) | 6.93 (0.96) | 0.9 |
| PAEE from DLW (kJ·kg−1·day−1) | 58.19 (30.95) | 65.74 (36.49) | 50.17 (22.14) | 0.2 |
| PAL | 1.79 (0.37) | 1.89 (0.45) | 1.68 (0.23) | 0.1 |
| Time active (min·day−1) | 375.1 (91.7) | 394.1 (109.3) | 354.9 (65.8) | 0.2 |
| Time sedentary (min·day−1) | 1038 (94.6) | 1002.4 (108.4) | 1075.8 (60) | 0.02 |
| MVPA (min·day−1) | 57.5 (32) | 53.5 (33.3) | 61.7 (35.3) | 0.5 |
| LPA (min·day−1) | 317.6 (94.9) | 340.6 (109.5) | 293.2 (72) | 0.2 |
| Total counts (×1,000 counts·day−1) | 394.3 (150.4) | 391.4 (127.4) | 397.3 (175.8) | 0.9 |
Data are means (SD) or numbers (percent) where indicated. P value for difference between rural and urban groups. MVPA = moderate to vigorous physical activity, LPA = light physical activity
TEE and REE did not differ significantly between rural and urban volunteers. Measured REE did not differ significantly from Schofield (32) predicted values; 95% limits of agreement −0.13, 0.19 MJ·day−1. Mean PAL measured by DLW was about 31% higher in rural compared to urban volunteers (1.89±0.45 vs. 1.68±0.23, p=0.048). A similar difference was observed for mean PAEE (65.74±36.49 vs. 50.17±22.14 kJ·kg−1·day−1, p=0.2). There was a significant difference between rural and urban participants for time spent sedentary as measured by accelerometry (1002.4±108.4 vs. 1075.8±60 min·day−1, p=0.02). There was no significant difference in the average daily time spent in light intensity activities (340.6 ±109.5 vs. 293.2±72 min·day−1, p=0.20) and in moderate-to-vigorous activities (53.5±33.3 vs. 61.7±35.3 min·day−1, p=0.5) between the rural and urban volunteers.
PAEE (kJ·kg−1·day−1) measured by DLW was significantly and positively correlated with average daily activity counts (counts·day−1) from the accelerometer (r=0.37, p=0.03). The correlation was remarkably stronger in urban (r=0.74, p=0.001) compared with rural volunteers (r=0.17, p=0.51).
Derived linear regression models for predicting PAEE are presented in table 2. These models use average daily accelerometer counts, age, sex and body fat percentage derived from bio-impedance, with or without accounting for the residential site. Accelerometer counts, age and male sex were positively associated with PAEE while body fat percentage and residing in the urban site were inversely associated with PAEE. The derived models explained between 14 and 40% of the variance in PAEE. Age, sex and accelerometer counts (model II a) together explained 34% of the variance in PAEE, with accelerometer counts alone (model I a) explaining 14% of the variance. This fraction was similar across all models (data not shown).
Table 3, figures 1 and 2 present criterion-measured PAEE as well as PAEE predicted by jack-knife cross-validation of the derived equations and also predicted from 3 previously published equations (18-20), using a movement flex point of 100 counts·minute−1. There was no significant difference between mean measured and predicted PAEE using the derived equations, with RMSE values ranging from 28.76 to 30.61 kJ·kg−1·day−1. The Hendelman (19) and Swartz (18) equations had a significant positive mean bias (mean [SE] of 23.45 [6.34] and 23.28 [6.08] kJ·kg−1·day−1 respectively) when we used Schofield estimates of REE, but not when REE was estimated as being 1 MET. In contrast, the Freedson equation (20) significantly underestimated DLW-measured PAEE when we used the 1-MET estimate of REE but not when Schofield estimates were used (mean bias [SE] = −20.66 [4.98] and −6.29 [5.56] kJ·kg−1·day−1 respectively). The limits of agreement between PAEE from DLW and the derived equations were wide for all prediction equations (table 3 and figure 1) with predicted PAEE being approximately 60 kJ·kg−1·day−1 below or above the measured value. A similar pattern of accuracy (RMSE ~ 30 to 40 kJ·kg−1·day−1) was seen with the previously published equations (table 3 and figure 2).
Table 3.
Cross validation of free-living PAEE measured by DLW and predicted by 6 derived equations and 3 published equations in healthy adult Cameroonians (n=33)
| Model | PAEE (SD) | Bias (SE) | RMSE | 95% LOA |
|---|---|---|---|---|
| Criterion method | ||||
| DLW | 58.19 (30.95) | |||
| Data derived equations | ||||
| I a | 57.53 (10.85) | −0.67 (5.34) | 30.22 | −60.80, 59.47 |
| I b | 58.04 (14.03) | −0.15 (5.41) | 30.61 | −61.08, 60.77 |
| II a | 57.86 (17.95) | −0.33 (5.24) | 29.64 | −59.31, 58.66 |
| II b | 58.43 (19.58) | 0.23 (5.39) | 29.66 | −58.80, 59.26 |
| III a | 57.55 (20.28) | −0.65 (5.09) | 28.80 | −57.96, 56.67 |
| III b | 58.14 (21.8) | −0.05 (5.08) | 28.76 | −57.30, 57.20 |
| Previously published equations | ||||
| Hendelmana (17) | 81.65 (20.11) | 23.45 (6.34)* | 42.86 | −47.95, 94.86 |
| Swartza (16) | 81.47 (19.45) | 23.28 (6.08)* | 41.52 | −45.15, 91.71 |
| Freedsona (18) | 51.90 (13.76) | −6.29 (5.56) | 32.06 | −68.85, 56.27 |
| Hendelmanb (17) | 67.28 (14.72) | 9.09 (5.52) | 32.54 | −53.11, 71.28 |
| Swartzb (16) | 67.10 (15.39) | 8.91 (5.35) | 31.55 | −51.33, 69.15 |
| Freedsonb (18) | 37.53 (11.03) | −20.66 (4.98) * | 34.92 | −76.70, 35.38 |
Values of PAEE are mean (SD) kJ·kg−1·day−1, bias are means (SE).
Mean bias = predicted - criterion, LOA = limits of agreement, RMSE =root mean square error,
p<0.05,
PAEE calculated from published equations with REE estimated using the Schofield equations,
PAEE calculated from published equations with discounting for REE estimated at 1 MET
Figure 1.
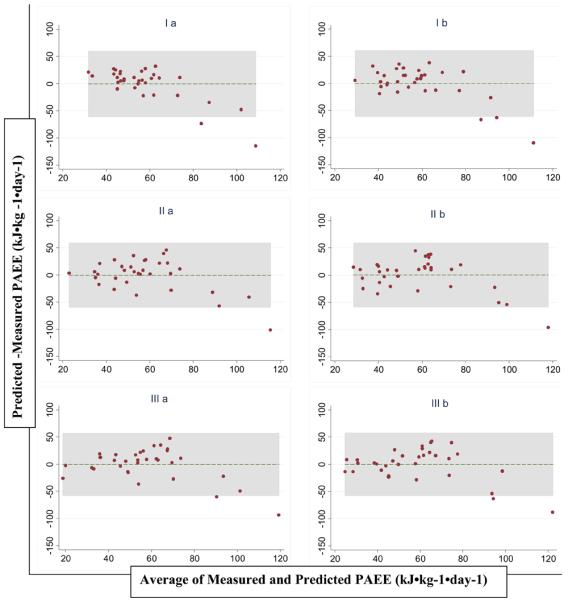
Bland and Altman plots of the difference versus the mean of PAEE measured by DLW and predicted by jack-knife cross validation of 6 derived equations (table 2) based on Actigraph counts in healthy adult Cameroonians (n=33)
Figure 2.

Bland and Altman plots of the difference versus the mean of PAEE measured by DLW and predicted by the Hendelman (19), Swartz (18) and Freedson (20) equations in healthy adult Cameroonians (n=33). a PAEE calculated from published equations with REE estimated using the Schofield equations (32), b PAEE calculated from published equations with discounting for REE estimated at 1 MET
DISCUSSION
This study investigated the use of accelerometry in predicting PAEE in healthy adults in a Sub-Sahara African population, a population which is rapidly adopting western lifestyles and becoming more sedentary (4, 6). Our results show that accelerometer counts alone explained 14% of the variance of the criterion-measured PAEE, while the addition of age and sex to the model increased the explained variance by an additional 20%. Furthermore, there was no significant difference in mean PAEE derived using the developed prediction equations and that measured by DLW, although prediction intervals were wide. These results suggest that mean PAEE can be predicted from accelerometry in adult Sub-Sahara African populations using equations derived from free-living individuals. Therefore, accelerometry could be a useful, feasible and relatively cheap objective method of measuring and monitoring population levels of physical activity in free-living individuals in developing countries, although the direct translation into PAEE may only be valid on a group level.
Our results suggest that laboratory-derived equations based on treadmill walking and running may not be directly applicable to free-living EE estimation since free-living activities that contribute to elevated PAEE involve many activities with only limited acceleration of the waist. The application of such an equation on free-living activity data would tend to underestimate PAEE. On the other hand, field-derived equations (18, 19) based on lifestyle activities should intuitively offer a better estimation of free-living EE from accelerometry. Similar to others (35), we applied a flex point to discriminate sedentary and active time in order to reduce the effect of the positive intercept of the previously derived equations (18-20), which otherwise would result in an overestimation of energy expenditure during rest, sleep and very light intensity activities. In this context, it is important to note that about 70% of the measured time was spent at movement levels below the sedentary cut-point, for which the three equations would produce the same estimate (1 MET or REE estimated by Schofield equations) with the implementation used in the present study. To the best of our knowledge, no accelerometer study has tried to characterize the lower end of the activity continuum to separate sedentary from light intensity activities. In this study, mean PAEE predicted from the Hendelman and Swartz equations (both derived from a variety of lifestyle activities) was not significantly different from PAEE measured by the DLW method when REE was discounted from the original equations as 1 MET. In opposite, these equations significantly overestimated PAEE when REE was estimated from Schofield equations. Conversely, the Freedson equation (derived from treadmill locomotion) significantly underestimated DLW-measured PAEE when a 1-MET estimate of REE was used but not when REE was estimated from Schofield equations. The accuracy of these lifestyle-derived equations in estimating PAEE in free-living individuals depends largely on the choice of REE estimation used. Presumably, the relationship between accelerometer counts and PAEE is more generalizable than that to TEE, so differences between REE in our sample and the true but non-measured REE in the three quoted laboratory-based validation studies (18-20) will contribute to this phenomenon. However, for all models considered, the wide limits of agreement highlight that these models do not perform well in predicting PAEE at the individual level, although a small proportion of the disagreement may be attributed to measurement errors in both REE and DLW-estimated TEE.
The prediction of free-living PAEE in this study is similar to that reported by other authors using free-living regression-generated prediction equations in children (36), as well as other equations generated from treadmill locomotion and lifestyle activities (35, 37, 38). The Actigraph has been shown not to fully capture the intensity of fast running (35, 39, 40), as well as the energy expenditure of a wide range of activities of daily living, especially activities such as load-carrying, climbing, cycling among others (41). Furthermore, the placement of the accelerometer at the waist could result in significant underestimation of activity in a person who performs mostly upper-body movements (35, 42). For example, the Actigraph-predicted PAEE was 30% of the DLW-measured value for one volunteer who was a carpenter, compared to 63% for another volunteer who was a professional footballer, suggesting that if the majority of activity taking place is ambulatory, the method works reasonably well. The rural populations are believed to be more engaged in intense non-locomotion manual work such as digging and carrying heavy loads compared to their urban counterparts whose activities are mainly sedentary or locomotion dependent. These may be possible explanations for the stronger correlation between PAEE from DLW and accelerometer counts seen in urban compared to rural volunteers. In this study, even though the mean daily average accelerometer counts were not different between the urban and rural volunteers, the mean PAEE and PAL from DLW was about 30% higher in the rural volunteers (table 1). When we repeated our analyses excluding the volunteer who showed large residuals (figures 1 and 2), these results remain generally unchanged (data not shown), suggesting that the volunteer with high PAEE who did essentially non-ambulatory activities did not influence the PAEE prediction equation using accelerometer counts to a considerable degree in the present analyses.
This study is potentially limited by its small sample size which was mainly due to the high costs involved in carrying out the DLW measurements. However, to the best of our knowledge, this is the only study reporting the comparative assessment of physical activity by both accelerometry and DLW in an African population. The fact that our sample was limited to healthy adults aged 25 – 50 years may limit the generalizability of these results to older populations or disease-specific subgroups. However, these are generalizable to the population which may be more relevant (2). The few other studies in the literature which used DLW to measure free-living energy expenditure in SSA populations were more restrictive in their sample selection including only sedentary women aged 18 – 28 years (43) or only rural men and women (44, 45). Nonetheless, the PAL of Cameroonian and Nigerian women are more similar (1.71 and 1.77 or 1.78) compared to that of the men (1.87 and 1.70) (7, 46). Rural Gambian men had higher PAEE values compared to Cameroonian men, but the Gambian men were all rural farmers measured during peak agricultural activity season, were younger (mean age: 25 vs. 33 years) and thinner (mean BMI: 21.2 vs. 25.6 kg·m−2) (45). The mean TEE adjusted for body weight in the Cameroonian women (143 kJ·kg−1·day−1) was higher than that of Swazi women (134 kJ·kg−1·day−1) (43) but lower than that of rural Gambian women (173 kJ·kg−1·day−1) (44). These differences may partly be explained by the fact that the Swazi women were younger and confined to a school environment while the Gambian were all rural women and measured during a period of peak agricultural activity. Furthermore, the Cameroonian women on average had higher body fat percentage composition (34.6%) compared to the Gambian and Swazi women (28.1 and 26.2 respectively).
Our study is unique not only because it uses the DLW technique which is the gold standard to measure free-living TEE, but it also compares this method to accelerometry which is a less costly and more feasible objective method for estimating PAEE. Further, accelerometry data can be analysed to examine aspects of activity intensity as well as total volume of activity. This may help to disentangle the various ways by which changes in physical activity are influencing the rising burden of obesity, diabetes and CVD in this population (8, 10, 46). Physical activity is a complex multi-dimensional behaviour and it may be important to know which dimensions of activity are changing and whether or not there is any compensation in other aspects (13). The accelerometry data shows that the rural and urban participants accumulated averagely 54 ± 33 and 62 ± 35 minutes of moderate-to-vigorous activity daily, which, on a group level, meets the recommendations for healthy living as suggested by the Centers for Disease Control (47). However, judging by the World Health Organisation recommendations (48) based on physical activity level (PAL), the rural volunteers with a mean PAL of 1.89 would be classified as having an ‘active or moderately active’ lifestyle while the urban volunteers with a mean PAL of 1.68 would have a ‘sedentary or lightly active’ lifestyle. Although small in sample size, this study suggests a substantial difference in mean PAL and PAEE between urban and rural areas. This difference between the urban and rural sites may be attributable to the significant difference in sedentary time since there was no significant difference in time spent in overall, light and moderate-to-vigorous activities (table 1). It may also be a reflection of differences in the nature of activities between the urban and rural population; in terms of predominance of locomotion or upper-body activities. This underlines the importance of validating other objective methods of measuring PAEE which may capture different dimensions/patterns of activity and possibly discriminate between active and sedentary behaviours.
In summary, accelerometry counts add significantly to the explained variance in DLW-measured PAEE, over and above that of age, sex, and body composition in healthy sub-Sahara African adults. Accelerometry may therefore be envisaged for use in this population in monitoring physical activity levels and patterns in order to appropriately guide primary prevention interventions.
ACKNOWLEDGEMENTS
This research was supported by the Wellcome Trust and the Medical Research Council Epidemiology Unit.
Footnotes
DISCLOSURES
The authors declared no conflict of interest.
Reference List
- 1.Omran AR. The epidemiologic transition: a theory of the epidemiology of population change. Milbank Q. 1971;2005;83(4):731–57. doi: 10.1111/j.1468-0009.2005.00398.x. [DOI] [PMC free article] [PubMed] [Google Scholar]
- 2.Wild S, Roglic G, Green A, Sicree R, King H. Global prevalence of diabetes: estimates for the year 2000 and projections for 2030. Diabetes Care. 2004;27(5):1047–53. doi: 10.2337/diacare.27.5.1047. [DOI] [PubMed] [Google Scholar]
- 3.Mbanya JC, Wilkes R, Bennett F, et al. Standardised study of glucose tolerance and diabetes prevalence in 4 African (origin) populations in Cameroon, Jamaica and migrants to Britain. Diabetologia. 1996;39:728. [Google Scholar]
- 4.Sobngwi E, Mbanya JC, Unwin NC, et al. Exposure over the life course to an urban environment and its relation with obesity, diabetes, and hypertension in rural and urban Cameroon. International Journal of Epidemiology. 2004;33(4):769–76. doi: 10.1093/ije/dyh044. [DOI] [PubMed] [Google Scholar]
- 5.Fezeu L, Minkoulou E, Balkau B, et al. Association between socioeconomic status and adiposity in urban Cameroon. Int J Epidemiol. 2006;35(1):105–11. doi: 10.1093/ije/dyi214. [DOI] [PubMed] [Google Scholar]
- 6.Popkin BM, Gordon-Larsen P. The nutrition transition: worldwide obesity dynamics and their determinants. Int J Obes Relat Metab Disord. 2004;28(Suppl 3):S2–S9. doi: 10.1038/sj.ijo.0802804. [DOI] [PubMed] [Google Scholar]
- 7.Ebersole KE, Dugas LR, Durazo-Arvizu RA, et al. Energy Expenditure and Adiposity in Nigerian and African-American Women. Obesity (Silver Spring) 2008 doi: 10.1038/oby.2008.330. [DOI] [PMC free article] [PubMed] [Google Scholar]
- 8.Luke A, Kramer H, Adeyemo A, et al. Relationship between blood pressure and physical activity assessed with stable isotopes. J Hum Hypertens. 2005;19(2):127–32. doi: 10.1038/sj.jhh.1001790. [DOI] [PubMed] [Google Scholar]
- 9.Pereira MA, Kriska AM, Joswiak ML, et al. Physical inactivity and glucose intolerance in the multiethnic island of Mauritius. Med Sci Sports Exerc. 1995;27(12):1626–34. [PubMed] [Google Scholar]
- 10.Sobngwi E, Mbanya JCN, Unwin NC, et al. Physical activity and its relationship with obesity, hypertension and diabetes in urban and rural Cameroon. International Journal of Obesity. 2002;26(7):1009–16. doi: 10.1038/sj.ijo.0802008. [DOI] [PubMed] [Google Scholar]
- 11.Levitt NS, Steyn K, Lambert EV, et al. Modifiable risk factors for Type 2 diabetes mellitus in a peri-urban community in South Africa. Diabet Med. 1999;16(11):946–50. doi: 10.1046/j.1464-5491.1999.00185.x. [DOI] [PubMed] [Google Scholar]
- 12.Hossain P, Kawar B, El NM. Obesity and diabetes in the developing world--a growing challenge. N Engl J Med. 2007;356(3):213–5. doi: 10.1056/NEJMp068177. [DOI] [PubMed] [Google Scholar]
- 13.Wareham NJ, Rennie KL. The assessment of physical activity in individuals and populations: why try to be more precise about how physical activity is assessed? Int J Obes Relat Metab Disord. 1998;22(Suppl 2):S30–S38. [PubMed] [Google Scholar]
- 14.Rennie KL, Wareham NJ. The validation of physical activity instruments for measuring energy expenditure: problems and pitfalls. Public Health Nutr. 1998;1(4):265–71. doi: 10.1079/phn19980043. [DOI] [PubMed] [Google Scholar]
- 15.Westerterp KR. Physical activity assessment with accelerometers. Int J Obes Relat Metab Disord. 1999;23(Suppl 3):S45–S49. doi: 10.1038/sj.ijo.0800883. [DOI] [PubMed] [Google Scholar]
- 16.Wareham NJ, Hennings SJ, Prentice AM, Day NE. Feasibility of heart-rate monitoring to estimate total level and pattern of energy expenditure in a population-based epidemiological study: the Ely Young Cohort Feasibility Study 1994-5. Br J Nutr. 1997;78(6):889–900. doi: 10.1079/bjn19970207. [DOI] [PubMed] [Google Scholar]
- 17.Brage S, Brage N, Franks PW, Ekelund U, Wareham NJ. Reliability and validity of the combined heart rate and movement sensor Actiheart. Eur J Clin Nutr. 2005;59(4):561–70. doi: 10.1038/sj.ejcn.1602118. [DOI] [PubMed] [Google Scholar]
- 18.Swartz AM, Strath SJ, Bassett DR, Jr., O'Brien WL, King GA, Ainsworth BE. Estimation of energy expenditure using CSA accelerometers at hip and wrist sites. Med Sci Sports Exerc. 2000;32(9 Suppl):S450–S456. doi: 10.1097/00005768-200009001-00003. [DOI] [PubMed] [Google Scholar]
- 19.Hendelman D, Miller K, Baggett C, Debold E, Freedson P. Validity of accelerometry for the assessment of moderate intensity physical activity in the field. Med Sci Sports Exerc. 2000;32(9 Suppl):S442–S449. doi: 10.1097/00005768-200009001-00002. [DOI] [PubMed] [Google Scholar]
- 20.Freedson PS, Melanson E, Sirard J. Calibration of the Computer Science and Applications, Inc. accelerometer. Medicine and Science in Sports and Exercise. 1998;30(5):777–81. doi: 10.1097/00005768-199805000-00021. [DOI] [PubMed] [Google Scholar]
- 21.St Onge MP, Rubiano F, Jones A, Jr., Heymsfield SB. A new hand-held indirect calorimeter to measure postprandial energy expenditure. Obes Res. 2004;12(4):704–9. doi: 10.1038/oby.2004.82. [DOI] [PubMed] [Google Scholar]
- 22.Nieman DC, Trone GA, Austin MD. A new handheld device for measuring resting metabolic rate and oxygen consumption. J Am Diet Assoc. 2003;103(5):588–92. doi: 10.1053/jada.2003.50116. [DOI] [PubMed] [Google Scholar]
- 23.Weir JB. New methods for calculating metabolic rate with special reference to protein metabolism. J Physiol. 1949;109(1-2):1–9. doi: 10.1113/jphysiol.1949.sp004363. [DOI] [PMC free article] [PubMed] [Google Scholar]
- 24.Hoffman DJ, Sawaya AL, Coward WA, et al. Energy expenditure of stunted and nonstunted boys and girls living in the shantytowns of Sao Paulo, Brazil. Am J Clin Nutr. 2000;72(4):1025–31. doi: 10.1093/ajcn/72.4.1025. [DOI] [PubMed] [Google Scholar]
- 25.Coward WA. Stable isotopic methods for measuring energy expenditure. The doubly-labelled-water (2H2(18)O) method: principles and practice. Proc Nutr Soc. 1988;47(3):209–18. doi: 10.1079/pns19880037. [DOI] [PubMed] [Google Scholar]
- 26.Cole TJ, Coward WA. Precision and accuracy of doubly labeled water energy expenditure by multipoint and two-point methods. Am J Physiol. 1992;263(5 Pt 1):E965–E973. doi: 10.1152/ajpendo.1992.263.5.E965. [DOI] [PubMed] [Google Scholar]
- 27.Ritz P, Coward WA. Doubly labelled water measurement of total energy expenditure. Diabete Metab. 1995;21(4):241–51. [PubMed] [Google Scholar]
- 28.Schoeller DA, Ravussin E, Schutz Y, Acheson KJ, Baertschi P, Jequier E. Energy expenditure by doubly labeled water: validation in humans and proposed calculation. Am J Physiol. 1986;250(5 Pt 2):R823–R830. doi: 10.1152/ajpregu.1986.250.5.R823. [DOI] [PubMed] [Google Scholar]
- 29.Elia M, Livesey G. Theory and validity of indirect calorimetry during net lipid synthesis. Am J Clin Nutr. 1988;47(4):591–607. doi: 10.1093/ajcn/47.4.591. [DOI] [PubMed] [Google Scholar]
- 30.Corder K, Brage S, Ramachandran A, Snehalatha C, Wareham N, Ekelund U. Comparison of two Actigraph models for assessing free-living physical activity in Indian adolescents. J Sports Sci. 2007;25(14):1607–11. doi: 10.1080/02640410701283841. [DOI] [PubMed] [Google Scholar]
- 31.Corder K, Ekelund U, Steele RM, Wareham NJ, Brage S. Assessment of physical activity in youth. J Appl Physiol. 2008;105(3):977–87. doi: 10.1152/japplphysiol.00094.2008. [DOI] [PubMed] [Google Scholar]
- 32.Schofield WN. Predicting basal metabolic rate, new standards and review of previous work. Hum Nutr Clin Nutr. 1985;39(Suppl 1):5–41. [PubMed] [Google Scholar]
- 33.Armitage P, Berry G, Mathews JNS. Statistical Methods in Medical Research. Blackwell Science; Oxford: 2002. [Google Scholar]
- 34.Bland JM, Altman DG. Measuring agreement in method comparison studies. Statistical Methods in Medical Research. 1999;8(2):135–60. doi: 10.1177/096228029900800204. [DOI] [PubMed] [Google Scholar]
- 35.Leenders NY, Sherman WM, Nagaraja HN. Energy expenditure estimated by accelerometry and doubly labeled water: do they agree? Med Sci Sports Exerc. 2006;38(12):2165–72. doi: 10.1249/01.mss.0000235883.94357.95. [DOI] [PubMed] [Google Scholar]
- 36.Ekelund U, Sjostrom M, Yngve A, et al. Physical activity assessed by activity monitor and doubly labeled water in children. Medicine and Science in Sports and Exercise. 2001;33(2):275–81. doi: 10.1097/00005768-200102000-00017. [DOI] [PubMed] [Google Scholar]
- 37.Strath SJ, Bassett JR, Swartz AM. Comparison of MTI accelerometer cut-points for predicting time spent in physical activity. International Journal of Sports Medicine. 2003;24(4):298–303. doi: 10.1055/s-2003-39504. [DOI] [PubMed] [Google Scholar]
- 38.Masse LC, Fulton JE, Watson KL, Mahar MT, Meyers MC, Wong WW. Influence of body composition on physical activity validation studies using doubly labeled water. J Appl Physiol. 2004;96(4):1357–64. doi: 10.1152/japplphysiol.00901.2003. [DOI] [PubMed] [Google Scholar]
- 39.Brage S, Wedderkopp N, Franks PW, Andersen LB, Froberg K. Reexamination of validity and reliability of the CSA monitor in walking and running. Med Sci Sports Exerc. 2003;35(8):1447–54. doi: 10.1249/01.MSS.0000079078.62035.EC. [DOI] [PubMed] [Google Scholar]
- 40.Rowlands AV, Stone MR, Eston RG. Influence of speed and step frequency during walking and running on motion sensor output. Med Sci Sports Exerc. 2007;39(4):716–27. doi: 10.1249/mss.0b013e318031126c. [DOI] [PubMed] [Google Scholar]
- 41.Crouter SE, Churilla JR, Bassett DR. Estimating energy expenditure using accelerometers. European Journal of Applied Physiology. 2006;98(6):601–12. doi: 10.1007/s00421-006-0307-5. [DOI] [PubMed] [Google Scholar]
- 42.Bassett DR, Jr., Ainsworth BE, Swartz AM, Strath SJ, O'Brien WL, King GA. Validity of four motion sensors in measuring moderate intensity physical activity. Med Sci Sports Exerc. 2000;32(9 Suppl):S471–S480. doi: 10.1097/00005768-200009001-00006. [DOI] [PubMed] [Google Scholar]
- 43.Huss-Ashmore R, Goodman JL, Sibiya TE, Stein TP. Energy expenditure of young Swazi women as measured by the doubly-labelled water method. Eur J Clin Nutr. 1989;43(11):737–48. [PubMed] [Google Scholar]
- 44.Singh J, Prentice AM, Diaz E, et al. Energy expenditure of Gambian women during peak agricultural activity measured by the doubly-labelled water method. Br J Nutr. 1989;62(2):315–29. doi: 10.1079/bjn19890033. [DOI] [PubMed] [Google Scholar]
- 45.Heini AF, Minghelli G, Diaz E, Prentice AM, Schutz Y. Free-living energy expenditure assessed by two different methods in rural Gambian men. European Journal of Clinical Nutrition. 1996;50(5):284–9. [PubMed] [Google Scholar]
- 46.Luke A, Durazo-Arvizu RA, Rotimi CN, et al. Activity energy expenditure and adiposity among black adults in Nigeria and the United States. American Journal of Clinical Nutrition. 2002;75(6):1045–50. doi: 10.1093/ajcn/75.6.1045. [DOI] [PubMed] [Google Scholar]
- 47.U.S.Department of Health and Human Services . Physical Activity and Health: A Report of the Surgeon General. U.S. Department of Health and Human Services, Centers for Disease Control and Prevention, National Center for Chronic Disease Prevention and Health Promotion, 1996; Atlanta, GA: 1996. [Google Scholar]
- 48.FAO/WHO/UNU Rome, Report of a Joint FAO/WHO/UNU Expert Consultation. (FAO FOOD AND NUTRITION TECHNICAL REPORT SERIES 1).Human energy requirements. 2001 [Google Scholar]