

Abstract
In vivo structural MRI studies in schizophrenia auditory cerebral cortex have reported smaller volumes, and less consistently have reported altered hemispheric asymmetry of volumes. We used autopsy brains from 19 schizophrenia and 18 nonpsychiatric male subjects to measure the volume asymmetry of the planum temporal (PT). We then used the most recently autopsied 11 schizophrenia and 10 non-psychiatric brains to measure the widths and fractional volumes of the upper (I–III) and lower (IV–VI) layers. Measurements of whole PT gray matter volumes did not show significant changes in schizophrenia. Nevertheless, laminar volume measurements revealed that the upper layers of the PT comprise a smaller fraction of the total cortex in schizophrenia than in nonpsychiatric brains. Subdivision of the PT showed that this change was especially prominent caudally, beyond Heschl’s gyrus, whereas similar but less pronounced changes were found in the rostral PT and Heschl’s gyrus. Complementary measures of laminar widths showed that the altered fractional volume in the caudal left PT was due mainly to about 8% thinner upper layers. However, the caudal right PT had a different profile, with thicker lower layers and comparatively unchanged upper layers. Thus, in the present study, laminar measurements provided a more sensitive method to detect changes than measurement of whole PT volumes. Besides findings in schizophrenia, our cortical width measurements also revealed normal hemispheric asymmetries consistent with previous reports. In schizophrenia, the thinner upper layers of the caudal PT suggest disrupted cortico-cortical processing, possibly affecting the multisensory integration and phonetic processing of this region.
Introduction
Schizophrenia is associated with volume and molecular changes in the cerebral cortex. While these changes may be widespread across the cortex, there is evidence that certain regions are especially affected. In particular, the caudal superior temporal gryus is reported to have reduced volume, altered gene expression and neurotransmitter-related changes similar to or even greater than other regions of cortex (Shenton et al., 2001; Katsel et al., 2005; Konopaske et al., 2006; Sweet et al., 2008).
The planum temporale (PT) is the cortical region on the dorsal surface of the superior temporal gyrus lateral and caudal to Heschl’s gyrus (HG). Primary auditory cortex is located on HG, and the rostral PT contains first- and second-order auditory association areas. The caudal PT is less well characterized, but is known to contain higher order association areas involved in language and multisensory processing (Foxe et al., 2002; Vigneau et al., 2006; Bernstein et al., 2008).
Nearly all of the volumetric studies of auditory cortex in schizophrenia have evaluated cortical structures such as the HG, PT and the whole superior temporal gryus. The findings have generally shown cortical volume decrements in the range of 5 to 15% (for reviews see (Wright et al., 2000; Shenton et al., 2001; Smiley, 2009)). A somewhat less consistent finding is that the deficit in cortical volume is more pronounced in the left hemisphere (Shenton et al., 2001; Smiley, 2009). Altered anatomical asymmetry might correspond to numerous functional findings of altered hemispheric asymmetry in this region, during rest, during language activation and during auditory hallucinations (e.g., (Cleghorn, 1992; Woodruff et al., 1997; Gur and Chin, 1999; Dollfus et al., 2005; Sommer et al., 2007)). It is unknown why schizophrenia may preferentially affect the left more than the right auditory cortex, and it may be due to selective vulnerability of certain types of synaptic connections, or to disruption of the development of hemispheric asymmetries (e.g., (Crow, 2000)). Currently, only partial descriptions are available of the detailed anatomical features of auditory cortex asymmetry.
In the present study, we used postmortem brains to attempt to replicate previous reports of altered PT volume asymmetry in schizophrenia. Additionally, we measured the volumes and widths of upper layers (I–III) and lower layers (IV–VI). From the laminar volumes we calculated the fractional volumes, i.e., the percent of total cortex occupied by upper or lower layers. We choose to measure the fractional volumes of these laminar compartments because this parameter can be precisely measured, appears to be quite stable in postmortem brains, and is theoretically unbiased by tissue orientation. To aid in the interpretation of fractional volumes, a complementary method was developed to map the regional distribution of the widths of the same upper and lower layers. While the main goal of this study was to more precisely define the anatomical and hemispheric selectivity of schizophrenia neuropathology, a secondary goal was to further define the normal asymmetries that are present, in order to provide a more complete context for the pathological changes.
Methods and Materials
Tissue samples were taken from 19 schizophrenia and 18 nonpsychiatric male brains that were obtained at autopsy either at the Institute for Forensic Medicine in Skopje Macedonia (matched schizophrenia and nonpsychiatric cases), or from New York State psychiatric hospitals (schizophrenia cases) matched with Columbia-Presbyterian Medical Center (nonpsychiatric cases). DSM-IV clinical diagnoses, or their absence, were established by standardized review of medical records with the Modified Diagnostic Evaluation After Death (mDEAD) (Keilp et al., 1995) applied to all New York cases, or by psychological autopsy interview (Kelly and Mann, 1996) applied to all Macedonian nonpsychiatric cases, or by both. The mDEAD was performed by at least two raters, and the psychological autopsy employed at least two informants. All case histories were reviewed at a consensus conference, at the New York State Psychiatric Institute, where the definitive diagnosis was assigned by the raters and senior clinicians. Most subjects had dominant right hand use, except 1 mixed handed subject and 4 subjects for which handedness was unavailable (Table 1 and Table 2). Brains were included only if the entire HG and PT, extending to the caudal end of the lateral sulcus , was available from both hemispheres. Brains were excluded if they met Khachaturian criteria for Alzheimer pathology or had clinical or pathological diagnoses of neurological disease. Brains were also excluded if there was a history of abuse or dependence of any substance except tobacco (Dwork et al., 1998), with the exception of one schizophrenia and one control brain that had a history of alcohol abuse. The study procedures were approved by the Institutional Review Boards of the New York State Psychiatric Institute, the Nathan Kline Institute, and the School of Medicine, University “Ss. Cyril & Methodius.”
Table 1.
Brain samples, demographic and descriptive data.
| Schiz | age | PMI, | form. | weight, | dom. | tiss. | LNE | diag. | cd | Contr | age | PMI, | form. | weight, | dom. | tiss. | cd |
|---|---|---|---|---|---|---|---|---|---|---|---|---|---|---|---|---|---|
| Case # | yr | h | mo | gr | hand | orig. | yr | Case # | yr | h | mo | gr | hand | orig. | |||
| D37+ | 43 | 19 | 6 | 1363 | R | RM | >10 | PS | 7 | D38+ | 50 | 7 | 8 | 1306 | R | RM | 3 |
| D20 | 53 | 15 | 16 | 1358 | R | RM | >10 | RS | 1 | D14 | 60 | 23 | 17 | 1277 | R | RM | 9 |
| D39 | 58 | 13 | 7 | 1621 | R | RM | >10 | RS | 2 | D16 | 60 | 20 | 7 | 1436 | R | RM | 11 |
| D53 | 33 | 20 | 15 | 1389 | R | RM | >10 | DS | 4 | D52 | 31 | 4 | 15 | 1540 | R | RM | 10 |
| D55 | 49 | 41 | 4 | 1335 | R | RM | >10 | PS | 5 | D54 | 42 | 24 | 7 | 1405 | R | RM | 13 |
| D56 | 73 | 7 | 7 | 1420 | R | RM | >10 | US | 8 | D13 | 80 | 9 | 16 | 1400 | R | RM | 11 |
| D15 | 48 | 7 | 6 | 1395 | R | RM | >10 | SA++ | 8 | D57 | 39 | 13 | 8 | 1230 | R | RM | 9 |
| D44 | 37 | 24 | 111 | 1500 | R | NY | >10 | US | 8 | D12 | 44 | 24 | 111 | 1240 | R | NY | 8 |
| D11 | 79 | 50 | 96 | 1440 | R | NY | >10 | US | 1 | D50 | 80 | 48 | 120 | n.a. | R | NY | 12 |
| D49 | 42 | 24 | 180 | 1450 | R | NY | >10 | PS | 8 | D33 | 42 | 24 | 129 | 1360 | R | NY | 1 |
| D51 | 29 | 24 | 180 | 1540 | n.a. | NY | <5 | US | 6 | ||||||||
| Ave | 49 | 22.2 | 57.1 | 1437.4 | Ave | 53 | 19.6 | 43.8 | 1354.9 | ||||||||
| S.D. | 16 | 13.2 | 71.5 | 86.654 | S.D. | 17 | 12.6 | 52.9 | 101.66 | ||||||||
alcohol abuse;
mild mental retardation.
Abbreviations: cd = cause of death; diag. = diagnosis; dom. hand = dominant hand; form. = formaldehyde; LNE = lifetime neuroleptic exposure; M = mixed handed; n.a.= not available; NY = New York; PMI = postmortem interval; R = right handed; RM = Republic of Macedonia;
Diagnosis: DS = disorganized schizophrenia; PS = paranoid schizophrenia; RS = residual schizophrenia; SA = schizoaffective disorder; US = undifferentiated schizophrenia;
Cause of death: 1=pneumonia, 2=aspiration, 3=accidental electrocution, 4=hypothermia, 5=suicide, pesticide poisining, 6=sucide hanging, 7=suicide jumping, 8=cariorespiratory arrest, 9 =traffic accident, shock traumatic shock, 10=homicide, 11=cerebral contusion, 12=gastrointestinal bleeding, 13=myocarditis, 14=lung cancer and hemmorage, 15=renal failure
Table 2.
Sample B, demographic and descriptive data
| Schiz | age | PMI, | form. | weight, | dom. | tiss. | LNE | diag. | cd | Contr | age | PMI, | form. | weight, | dom. | tiss. | cd |
|---|---|---|---|---|---|---|---|---|---|---|---|---|---|---|---|---|---|
| Case | yr | h | mo | gr | hand | orig. | yr | Case | yr | h | mo | gr | hand | orig. | |||
| D22 | 68 | 50 | 96 | 1540 | R | NY | >10 | US | 1 | D29 | 74 | 24 | 132 | 1160 | R | NY | 8 |
| D24 | 87 | 91 | 96 | 1300 | R | NY | >10 | PS | 8 | D30 | 71 | 24 | 132 | 1510 | M | NY | 8 |
| D25 | 67 | 63 | 288 | 1200 | R | NY | >10 | US | 1 | D31 | 52 | 24 | 120 | 1250 | R | NY | 8 |
| D26 | 80 | 21 | 312 | 1100 | R | NY | >10 | US | 1 | D32 | 87 | 24 | 132 | 1260 | n.a. | NY | n.a. |
| D27 | 86 | 48 | 228 | 1250 | n.a. | NY | >10 | US | 1 | D36 | 51 | 72 | 120 | 1600 | R | NY | 15 |
| D28 | 89 | 82 | 240 | 1250 | R | NY | >10 | US | 1 | D45 | 77 | 24 | 120 | 1150 | R | NY | 1 |
| D40 | 75 | 168 | 84 | 1400 | n.a. | NY | >10 | US | 8 | D46 | 74 | 24 | 120 | 1300 | R | NY | 8 |
| D42 | 65 | 168 | 96 | 1400 | R | NY | >10 | US | 14 | D48 | 88 | 48 | 136 | 1450 | R | NY | 8 |
| Ave | 77 | 86 | 180 | 1305 | Ave | 72 | 33 | 127 | 1335 | ||||||||
| S.D. | 10 | 55 | 97 | 138 | S.D. | 14 | 18 | 7 | 166 | ||||||||
Abbreviations as in Table 1.
A subset of schizophrenia brains had long fixation times and other confounding variables that could not be matched with similar controls. For this reason we separated our brains into 2 samples. Sample A (Table 1) included 11 schizophrenia and 10 nonpsychiatric subjects who were matched as closely as possible for source (New York or Macedonia), time in formalin, age, postmortem interval and race. These brains were used for both cortical volume and for laminar measurements.
Sample B (Table 2) included 8 schizophrenia and 8 nonpsychiatric brains from older schizophrenia and control subjects that could not be matched for time in formalin and postmortem interval. Therefore, these brains were used only to evaluate the asymmetry of whole PT gray matter volumes.
Tissue dissection and processing
Cases were included only if the entirety of the PT and HG were present and clearly identifiable bilaterally. In all cases, the PT and HG were divided into 2 to 5 coronally cut blocks. In sample A, 5 of the schizophrenia and 6 of the control brains were suspended in 10% buffered formalin for several months before removal of the superior temporal plane, which was then coronally cut into 2 or 3 blocks to facilitate sectioning on a sliding microtome. The remaining brains had been fixed in formalin, cut for diagnostic neuropathology into 1–2 cm thick coronal slabs, and returned to 10% formalin. The caudal superior temporal plane was subsequently dissected from these slabs. For all brains, the blocks from the left and right hemisphere were photographed and then simultaneously processed for histology.
Tissue was embedded in celloidin plastic (nitrocellulose; Parlodion) using a standardized protocol. The tissue was dehydrated through graded ethanols over a period of 5 days, then immersed in 1:1 ethanol:diethyl ether for 3 days, and then in a 6% solution of celloidin (Parlodion, Fisher Scientific) in 1:1 ethanol:ether for 2 days, followed by 12% celloidin in 1:1 ethanol:ether for 3 days. Tissue blocks were then placed in paper molds and the celloidin hardened by overnight immersion in chloroform. The hardened blocks were transferred to butanol for short term storage (3 to 5 days) before sectioning. Tissue was sectioned in a coronal orientation at 80um thickness with a sliding microtome. All sections were stored in butanol in serial order in multi-welled plastic boxes.
Every 12th section through the entire extent of HG and the PT was stained for Nissl substance with cresylecht violet (Chroma-Gesellschaft, Cellpoint Scientific, Rockville, MD). The free-floating celloidin sections were rehydrated through graded ethanols to water, exposed to 1% cresylecht violet at 56°C, dehydrated through ascending ethanols, differentiated in 95% ethanol with 1% acetic acid, transferred to 100% ethanol and then xylene, mounted on glass slides and coverslipped with Permount mounting medium.
Measurement of gray matter volume of the PT
During sectioning, a video image of the cutting surface was stored on a computer, to record the appearance of every tissue section. These images were used to confirm the order and orientation of histologically processed sections, and also to make 3-dimensional reconstructions of the aligned consecutive blocks, so that all microscopic observations could be precisely located within the original tissue blocks (Fig. 1A–B).
Figure 1.

An example of the methods used to measure the gray matter volume of the planum temporale (PT). A) The full extent of the PT and Heschl’s gyrus was dissected from each hemisphere. The parietal operculum was also included to prevent loss of any part of the caudal end of the lateral sulcus. The perspective in this image is from the anterior and dorsal view. B) For each hemisphere, a 3-dimensional reconstruction was made from video images of the block face during sectioning. Reconstructions were made from the every 12th section, using the same series of sections used for Nissl staining. The parietal operculum was removed from the reconstruction in order to view the PT surface. Heschl’s sulcus (HS) separates Heschl’s gyrus from the PT. The rostral end of Heschl’s gyrus is typically seen as an obvious end of the gyrus (white arrowheads in A and B). C) Nissl stained sections were digitally imaged, and the volume of cortex extending from Heschl’s gyrus (HG), or from the fundus of the lateral sulcus, to the lateral crest of the lateral sulcus was included as the PT. The white lines (solid and dashed) show the borders of the PT that were used to delimit the PT from adjacent structures, as described in the Methods section. Care was taken to include all cortex extending to the terminal end of the lateral sulcus. In this example, the numbered sections are the same as the corresponding sections in B.
The Cavalieri point counting method was used to measure the cortical volume of the PT (Fig. 1). Because the tissue was sampled in multiple blocks, sections from each block were numbered as a continuation of the previous block, so that the entire PT and HG from each hemisphere was treated as a single series of numbered sections. Care was taken to include all partial sections from the block faces, which were identified by referring to the video images. One randomly selected series of every 12th section through the volume was Nissl stained, and the slide-mounted sections were photographed on a light box with a Nikon Coolpix digital camera. Object-Image software (http://simon.bio.uva.nl/object-image) was used to superimpose a point counting grid onto these images, and to count the points overlaying the PT. On average, 30 +/− 6.4 (S.D.) sections were measured per PT. The coefficient of error for these volume measurements (West and Gundersen, 1990) was 0.022 +/−0.01 (S.D.). Volumes were determined by the equation volume = number of grid points × area per point × section spacing, where section spacing was determined from the section sampling fraction and the section thickness (Howard and Reed, 1998). The average section thickness for each PT was determined by focusing on the top and bottom surfaces of every section with an oil immersion objective and reading the z-position from the stage-mounted Heidenhain micrometer. The average on-slide section thickness across samples was 75.1 +/− 5.2um (S.D.).
The PT (Figure 1) was defined as the cortex on the lower bank of the lateral sulcus, extending from Heschl’s sulcus to the terminal end of the lateral sulcus. Following the commonly used convention (Shapleske et al., 1999), if the caudal PT branched, we followed the ascending branch and excluded the ventral branch. The lateral PT border was the crest of the lateral sulcus, and its medial border behind HG was the fundus of the lateral sulcus. The rostral PT border was the depth of Heschl’s sulus, which separates PT from HG. The identification of HG was confirmed by the presence of cytoarchitectonically identified primary auditory cortex on its caudal-medial part, and it was consistently the first prominent transverse gyrus that originated at the caudal end of the insula (Steinmetz et al., 1990).
The rostral border of the PT at Heschl’s sulcus is easy to identify in most cases where there is a clear HG that extends across the lateral sulcus. However, in cases in which the gyrus branches, has a sulcus intermedius, or does not extend fully across the lateral suclus, we applied the following rules. If a sulcus intermedius was found on the surface of HG, then cortex on either side of it was included as HG, unless the sulcus intermedius clearly extended to the medial fundus of the lateral sulcus, or to its lateral crest, in which case the cortex lateral to it was included as part of the PT. The rostral tip of HG was ended at the crest of the lateral sulcus, but in cases where HG did not extend completely to the lateral crest, its rostral border was usually identifiable by a clearly visible end of the gyrus, or ridge, as its dorsal surface stepped down to join the rostral temporal plane (Penhune et al., 1996). In these cases, the rostral end of the PT was the coronal plane extending from the rostral end of HG. In a few cases the rostral end of HG did not have a clear ridge, and its rostral end was placed at the rostral tip of Heschl’s sulcus.
For some laminar measurements we subdivided the PT into rostral and caudal parts, separated by a coronal plane at the caudal end of Heschl’s sulcus. This method of subdividing the PT was selected in order to compare our results with a previous study of PT cortex width (Harasty et al., 2003), and because it is simple and easily reproduced (Zetzsche et al., 2001). In the few cases where Heschl’s sulcus extended nearly to the end of the PT, the last 25% of the sections through the PT were considered its caudal part. This rule was adopted so that each sample of the caudal PT had a minimum of 6 sections.
Laminar measurements
Laminar measurments were made on photomontages of the Nissl-stained sections. The montages were made with StereoInvestigator software (Microbrightfield, www.mbfbioscience.com) with an Optronics Microfire digital camera and a 2× objective on a Nikon E-600 microscope. The final image resolution (146 pixels per mm) was more than adequate to identify cortical layers. Additionally, in order to assist in the precise localization of borders and layers, the X–Y pixel coordinates of the photomontage were co-registered to a motorized microscope stage, so that viewing of the photomontage could be simultaneously compared with “live-viewing” of the tissue. Control and alignment of the microscope stage, and all measurements, were done with Object-Image software (http://simon.bio.uva.nl/object-image).
The laminar volumes were measured by using interactive software to mark, on the photomontages, the borders of the pial surface, the upper surface of layer IV, and the white matter border. These borders were chosen because they divided cortex into superficial and deep compartments, and because they could be easily identified even in tangentially sectioned tissue. At the white matter border, the boundary was drawn at the more distinct border of layer VI, thus excluding the diffuse distribution of interstitial cells in the superficial with matter. The areas of upper and lower layers were the regions between the marked borders. Volumes were determined by multiplying the areas by the section spacing determined from the section sampling fraction and the section thickness (Howard and Reed, 1998).
The “volume fraction” was defined at the level of the region, and not at the section level. For example, the upper layer fraction of the PT was expressed as the volume of the whole PT upper layer volume, divided by the whole PT volume.
The widths of cortical layers were measured using the same borders used to measure volume fractions (Fig. 6). For these measurements, software was designed that randomly selected a series of points spaced at intervals of 0.68 mm along each marked border, and for each point determined the length of the shortest vector to the adjacent border, omitting any vectors that crossed over the border of origin. Each laminar compartment was measured in two directions: i.e., the width of the upper layers was measured from the pial surface to layer IV, and then again from layer IV to the pial surface, and this sequence was repeated for the lower layers. The width measurements from each section were displayed as a flat-map composed of a linear array of color-coded rectangles. The length of the flat-map was proportional to the length of layer IV in the section, and the color of each rectangle corresponded to a histogram value of the average of the nearest 2 width measurements. Using the average of 2 measurements produced a small amount of smoothing of the maps. Flat maps from sequential sections through the superior temporal plane were aligned either at the fundus of the sulcus that formed the medial border of HG or, in sections caudal to HG, at the fundus of the lateral sulcus. However, to reduce excessive distortion of the maps, sections at the caudal-lateral end of the PT were aligned at the lateral crest of the lateral suclus. The software simultaneously displayed three separate flat-maps that showed the widths of the upper layers, the widths of the lower layers, and the total cortex width. The latter was the sum of the average of the 2 closest upper layer measurements plus the average of the 2 closest lower layer measurements. Regional width estimates were obtained by outlining the regions of interest on the flat-maps, and summing the total numbers of rectangles of each color.
Figure 6.

An example is shown of the methods used to measure the widths of the upper and lower layers. A) The output from width measurements of individual sections was displayed as 3 linear arrays of colored rectangles. The array length corresponded to the length of layer 4, and each rectangle corresponded to an average of the 2 nearest width measurements. Arrows show the corresponding location on the histological section in B. The color scales are shown in C. B) The source of the histological section from A (white arrow) is shown in a reconstruction of the PT in this sample. For purposes of orientation, the location of the cytoarchitectonically identified primary auditory cortex on HG is highlighted in yellow. C) Widths were measured between the same laminar borders used for fractional volume measurements. Evenly spaced points along each border were selected, and the shortest line distance to the nearest adjacent border (black lines) was determined. The dashed white line outlines the extent of the PT and HG used for width measurements. D) For each hemisphere, 3 sequential flat maps are produced showing the upper widths, lower widths, and total widths. Sequential output from adjacent sections are aligned to make a flat map of the entire HG and PT. On each map, the white arrow shows the output from the section displayed in A and B. The white lines show the borders of the PT and HG that were outlined to summarize the average width of these regions of interest. The thinning at the fundus of sulci is seen most clearly in the map of the lower layer widths.
Our width measurements are potentially biased because the tissue is not randomly oriented, and some lengths of tissue were cut at a tangential orientation. The influence of this bias was minimized using 2 methods. First, any length of cortex that had upper or lower widths greater than 1.95 mm was excluded from measurement on all three flat-maps. Second, results were summarized as median instead of mean widths. Separate exploratory analysis that did not exclude tangentially cut cortex, or that used mean instead of median values, produced nearly identical group differences.
Our laminar width measurements used the shortest distance between borders, in contrast to alternative methods that manually draw vectors parallel to cortical minicolumns, or that calculate the “electric field lines” between borders (Caspers et al., 2006). As discussed by Jones et al. (Jones et al., 2000) our shortest distance measurements will slightly underestimate cortical widths at lengths of cortex where the laminar boundaries are not parallel.
Statistical analysis
Brains in Sample A (Table 1) were selected to match the schizophrenia and nonpsychiatric brains as closely as possible for age, postmortem interval and time in formalin. Group comparisons using t-tests for independent samples showed that these variables were not significantly different between groups. However, brain weight differed between samples at trend level significance (p = 0.07, two-tailed t-test). Pearson’s correlations did not show evidence for an interaction of brain weight with whole PT volumes or laminar volume fractions, but there was an unexpected inverse correlation with total cortex width (p <0.05). Therefore, brain weight was used as a covariate for analyses of sample A, using mixed model analyses of covariance (ANCOVA) in which between-subject comparisons included diagnosis and within-subject comparisons included the two hemispheres. A secondary statistical analyses that, in addition to brain weight, covaried for age, postmortem interval and time in formalin is also presented, and in general showed that the main findings could not be explained by these confounding variables.
In sample B (Table 2) the schizophrenia and nonpsychiatric brains had significantly different postmortem times and time in formalin. Therefore, this comparison group was used only to evaluate group differences in hemispheric asymmetry of PT cortical volume. Asymmetry was expressed as an asymmetry index (AI) defined as (left−right)/(0.5×(left+right)) for each subject. Linear regression analysis showed that AIs did not correlate with age (p = 0.55) postmortem interval (p = 0.27) time in formalin (p = 0.31) or brain weight (p = 0. 38). AI’s were compared between diagnostic groups by independent samples t-tests.
Results
Morphometric measures were made in two separate comparison samples. Sample A had schizophrenia and nonpsychiatric brains that were closely matched for confounding variables (Table 1), and these brains were used for all measurements. Sample B (Table 2) was not matched for postmortem interval or time in formalin, and these brains were used only to analyze the hemispheric asymmetry of PT volumes.
PT volume measurements
Figure 1 shows an example of the preparation used to measure gray matter volumes. The whole PT including the rostral horizontal limb and the caudal vertical limb was included in these measurements. In the brains in sample A (Table 1) the PT volumes were similar in nonpsychiatric brains (left = 1446+/425 mm3, right = 1387 +/− 375, mean +/− S.D) and schizophrenia brains (left = 1643+/339, right = 1463 +/− 367). Two way ANCOVA (groups × hemisphere) showed no significant group effect (F(1,18) = 0.37, p = .55) hemisphere asymmetry (F(1,18) = 1.37, p =.26) or group × hemisphere interaction (F(1,18) = 1.56, p = .23). Individual volume measurements are shown in Figure 2.
Figure 2.

Measured gray matter volumes of the PT, from sample A, did not show significant group or hemispheric differences.
Hemispheric asymmetry of PT gray matter volumes was also evaluated in sample B (Table 2). In this sample the nonpsychiatric PT volumes (left = 1348 +/− 330, right = 1175 +/− 227) were similar to the schizophrenia PT volumes (1355 +/− 135, right = 1182 +/− 245). The AI was not significantly different (t(14) = −0.84, p = .42) in schizophrenia brains (AI = 0.15 +/− 0.22, mean +/− S.D.) compared with nonpsychiatric brains (AI = 0.06 +/− 0.15). Figure 3 displays AI’s for both samples A and B. While there were no group differences, analysis of all brains from samples A and B combined showed a 9% left>right hemispheric asymmetry (p < .02, 2-tailed Wilcoxin signed rank test).
Figure 3.
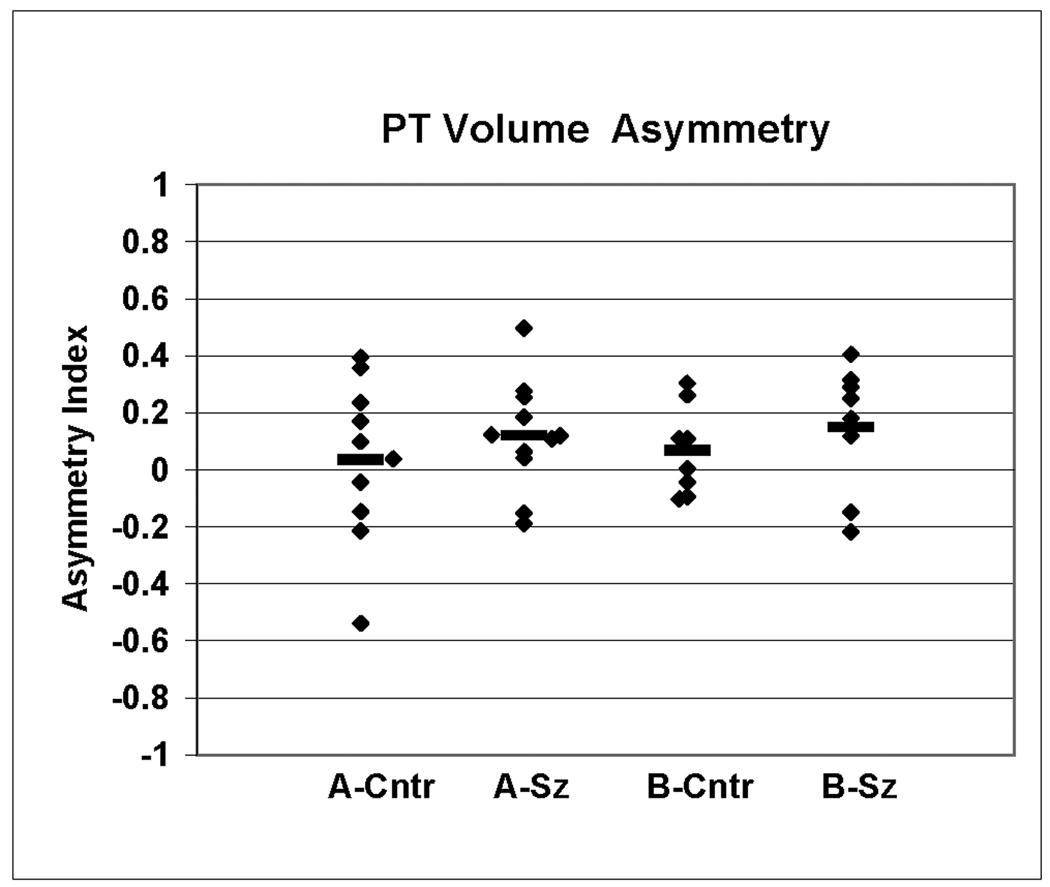
Hemispheric asymmetry of the PT gray matter volumes were expressed as an asymmetry index (AI) = (left−right)/(0.5×(left+right)) for each subject. Values for schizophrenia and control brains are shown separately for samples A and B.
Comparison of the volume fractions of upper and lower layers
Figures 4 shows the preparation used to evaluate the volume fractions of the upper and lower layers in brain sample A. The upper layers were the volume between the pial surface and the layer III–IV border, and the lower layers extended from the Layer III–IV border to the white matter. In this analysis, cortex was omitted if the pial or white matter boundaries could not be visualized, either because only a tangentially cut fragment of cortex was visible at the caudal terminus of the sulcus, or because only a partial section from the block face was available. Comparison with the above whole PT volume measurements showed that the percent of cortex omitted from non-psychiatric brains (left = 4+/−8.3%, right = 5.6+/−2.7%, S.D.) and from schizophrenia brains (left = 2.6 +/−2.5%, right = 4.5 +/−6.6%) was not statistically different (F(1,19) = 0.40, p = 0.53 (group × hemisphere ANOVA), and there was not a significant hemispheric asymmetry (p = 0.26) or group × hemisphere interaction (p = .93).
Figure 4.

An example is shown of the methods used to measure the fractional volumes of the upper and lower layers. A) High resolution video montages were made of every 0.96 mm spaced Nissl stained section through Heschl’s gyrus (HG) and the planum temporale (PT). On each montage, interactive software was used to outline the borders of the pial surface, the border between layers 3 and 4, and the border between cortex and white matter. The upper layer volume fraction for each region of interest (PT or HG) was the sum of the areas of the upper layers divided by the total sum of the upper and lower areas. Small black arrows show the location of the cortex displayed in B. The inset shows the location of the section displayed in A (white arrows). B) A piece of the section from A is shown at higher magnification. The upper boundary of layer IV was used to subdivide the upper layers (I–III) from lower layers (IV–VI).
Analysis of the upper layer volume fractions for HG and PT using two-way ANCOVA (group × hemisphere) showed a significant group difference (p < .05) in the PT, but no significant changes in HG (Figure 5 and Table 3). Post hoc t-tests showed that the group difference in the PT was significant in the left (p = .04) but not right (p = .16) hemisphere.
Figure 5.

Graphs display the upper layer fractional volumes in each region of interest. The fractional volume in each region was the total volume of the upper layers divided by the sum of the upper and lower layers. Diagnostic group significance are denoted * = p>0.05, **=p<0.01. Values are mean +/− S.D.
Table 3.
Upper layer volume fractions.
| ANCOVA (group × hemisphere) | |||||||||||||
|---|---|---|---|---|---|---|---|---|---|---|---|---|---|
| Control | Schizophrenia | t-test | % | Group | Side | Group × Side | |||||||
| Mean | (S.D.) | Mean | (S.D.) | P-value | diff. | d* | (F1,18) | p | (F1,18) | p | (F1,18) | p | |
| HG | |||||||||||||
| Left | 0.599 | (0.018) | 0.598 | (0.025) | 0.96 | −0.1% | 0.05 | (1.35) | .26 | (4.93) | .04 | (0.12) | .73 |
| Right | 0.604 | (0.025) | 0.592 | (0.018) | 0.23 | −2.0% | 0.55 | ||||||
| PT-All | |||||||||||||
| Left | 0.610 | (0.022) | 0.587 | (0.024) | 0.04 | −3.7% | 1.00 | (4.58) | .05 | (0.09) | .76 | (0.59) | .45 |
| Right | 0.615 | (0.017) | 0.602 | (0.024) | 0.16 | −2.2% | 0.64 | ||||||
| PT-Caudal | |||||||||||||
| Left | 0.612 | (0.032) | 0.584 | (0.025) | 0.04 | −4.6% | 0.98 | (9.45) | .01 | (0.05) | .83 | (0.14) | .71 |
| Right | 0.617 | (0.020) | 0.596 | (0.022) | 0.04 | −3.6% | 1.00 | ||||||
| PT-Rostral | |||||||||||||
| Left | 0.606 | (0.025) | 0.592 | (0.032) | 0.28 | −2.3% | 0.49 | (1.02) | .33 | (0.24) | .63 | (0.65) | .43 |
| Right | 0.614 | (0.020) | 0.607 | (0.028) | 0.56 | −1.0% | 0.29 | ||||||
Cohen's d estimate of effect size.
Further parcellation of the PT into rostral and caudal parts showed that the group difference in upper layer volumes was more pronounced in the caudal PT (Figure 5 and Table 3). ANCOVA showed a significant group difference in the caudal PT (p < .01) but not rostral PT (p = .33). Post hoc t-tests in the caudal PT showed a significant decrease on both left (p = .04) and right (p = .04) sides.
The secondary statistical analysis that included age, postmortem interval and time in formalin as covariates did not have a strong effect on the results, although there was some loss of statistical power. Specifically, this alternate ANCOVA for upper layer volume fractions of the whole PT showed trend-level significance (p<0.1), and the significance of the caudal PT volume fractions was slightly changed (p = 0.02).
The reduced upper layer volume fraction in schizophrenia could be caused by shrinkage of the upper layers or by expansion of the lower layers. For example, the volume fraction of 0.61 for the whole left PT of non-psychiatric subjects corresponds to a ratio of 61 upper volume units to 39 lower volume units. An upper volume reduction of 8% (0.92 × 61 = 56.1 volume units) could cause the 0.59 volume fraction seen in the left hemisphere of the schizophrenia sample (i.e., 56.1/(56.1+39) = 0.59). Alternatively, this difference could be explained by a 9% increase in lower layers, or by some combination of upper and lower changes.
Comparison of widths of upper and lower layers
Width measurements were used to investigate whether the changes in volume fractions were due to changes in the upper or lower layers (Figure 6). Evaluation of the whole PT showed some evidence for selectively thinner upper layers, consistent with the fractional volume measurements, but these width changes did not reach significance (Group × layer interaction, F(1,18) = 2.36, p = .13, Table 4). Evaluation of only the caudal PT showed a significant group × side asymmetry (p < 0.01, or p<0.02 in secondary statistical model) (Table 4 and Figure 7). In the left hemisphere, the thinning was greater in upper layers (−8.1%) and less pronounced in lower layers (−4.1%). In contrast, the caudal right hemisphere was largely unchanged in the upper layers (−0.9%) and thicker in the lower layers (7.2%). Therefore, bilaterally reduced upper layer volume fractions in the caudal PT may be explained by proportionally thinner upper layers in the left, but thicker lower layers in the right hemisphere.
Table 4.
Upper and lower layer widths.
| ANCOVA (group × hemisphere × layer) |
Group × | ||||||||||||||||
|---|---|---|---|---|---|---|---|---|---|---|---|---|---|---|---|---|---|
| Control | Schizophrenia | Group × | Group × | Side × | |||||||||||||
| % diff. |
Group | Side | Side | Layer | Layer | ||||||||||||
| Med.* | (S.D.) | Med. | (S.D.) | d** | (F1,18) | p | (F1,18) | p | (F1,18) | p | (F1,18) | p | (F1,18) | p | |||
| HG | |||||||||||||||||
| Upper | Lft | 1,225 | (94) | 1,184 | (72) | −3.3% | 0.49 | (0.12) | .73 | (0.16) | .69 | (0.50) | .49 | (3.54) | .08 | (0.41) | .53 |
| Rt | 1,215 | (73) | 1,163 | (74) | −4.3% | 0.71 | |||||||||||
| Lower | Lft | 986 | (98) | 965 | (91) | −2.1% | 0.22 | ||||||||||
| Rt | 957 | (79) | 952 | (99) | −0.5% | 0.06 | |||||||||||
| Total | Lft | 2,186 | (134) | 2,154 | (166) | −1.5% | 0.21 | (0.10) | .75 | (0.01) | .91 | (0.01) | .94 | ||||
| cortex | Rt | 2,172 | (120) | 2,132 | (158) | −1.8% | 0.29 | ||||||||||
| PT-All | |||||||||||||||||
| Upper | Lft | 1,282 | (81) | 1,199 | (108) | −6.5% | 0.88 | (0.02) | .89 | (0.25) | .62 | (0.79) | .39 | (2.53) | .13 | (1.67) | 21 |
| Rt | 1,259 | (83) | 1,228 | (130) | −2.4% | 0.29 | |||||||||||
| Lower | Lft | 879 | (103) | 885 | (95) | 0.6% | −0.06 | ||||||||||
| Rt | 903 | (79) | 896 | (90) | −0.8% | 0.08 | |||||||||||
| Total | Lft | 2,177 | (151) | 2,101 | (163) | −3.5% | 0.49 | (0.02) | .89 | (0.43) | .52 | (1.12) | .30 | ||||
| cortex | Rt | 2,160 | (137) | 2,126 | (189) | −1.6% | 0.21 | ||||||||||
| PT-Cauda | |||||||||||||||||
| Upper | Lft | 1,297 | (81) | 1,192 | (131) | −8.1% | 1.00 | (0.01) | .93 | (0.44) | .52 | (8.54) | .01 | (3.45) | .08 | (0.07) | .79 |
| Rt | 1,241 | (72) | 1,230 | (139) | −0.9% | 0.11 | |||||||||||
| Lower | Lft | 905 | (127) | 867 | (114) | −4.1% | 0.31 | ||||||||||
| Rt | 842 | (58) | 902 | (111) | 7.2% | −0.72 | |||||||||||
| Total | Lft | 2,197 | (128) | 2,077 | (192) | −5.5% | 0.76 | (0.00) | .99 | (0.45) | .51 | (6.07) | .02 | ||||
| cortex | Rt | 2,086 | (103) | 2,135 | (230) | 2.3% | −0.30 | ||||||||||
| PT-Rostral | |||||||||||||||||
| Upper | Lft | 1,278 | (112) | 1,201 | (116) | −6.0% | 0.68 | (0.26) | .62 | (0.15) | .70 | (0.65) | .43 | (2.43) | .14 | (6.01) | .02 |
| Rt | 1,273 | (98) | 1,226 | (130) | −3.7% | 0.42 | |||||||||||
| Lower | Lft | 849 | (135) | 905 | (107) | 6.6% | −0.46 | ||||||||||
| Rt | 946 | (113) | 905 | (110) | −4.4% | 0.37 | |||||||||||
| Total | Lft | 2,150 | (176) | 2,118 | (187) | −1.5% | 0.18 | (0.11 | .74 | (0.31) | .59 | (0.51) | .48 | ||||
| cortex | Rt | 2,217 | (190) | 2,128 | (198) | −4.0% | 0.46 | ||||||||||
Median widths.
Cohen's d estimate of effect size.
Figure 7.

Graphs display the widths of upper layers (I–III) or lower layers (IV–VI) in each region of interest. For clarity, the combined rostral and caudal PT (“PT-All”) widths are not shown, but are presented in Figure 8 and Table 4. * = p>0.05, and + = <0.01 group × hemisphere difference. Values are median +/− S.D.
The rostral PT displayed a distribution of widths that was distinct from the caudal PT (Table 4 and Figure 7). In the rostral PT there was a significant group × side × hemisphere interaction (p = 0.02, or p = 0.09 in secondary analysis), due to thinner cortex in schizophrenia in all layers except the lower layers in the left hemisphere.
Removal of tangentially cut cortex from the width measurements
In the above width analysis, regions of cortex were omitted if they were tangentially sectioned, i.e., the thickness of either the upper or lower layers was greater than 1.95 mm. Alternative measurements that did not remove tangentially cut cortex demonstrated that this procedure had little effect on the observed group and hemisphere differences (e.g., Figure 8). Additionally, the percent of total cortex that was omitted because it was tangentially cut was not different between groups. In the PT, the percent removed from control brains (left = 19.0+/−7.7%, right =16.7+/−7.0%, S.D.) and schizophrenia brains (left =15.1% +/− 7.2%, right = 14.9+/−10.2%) was not statistically different between groups (F(1,19) = 0.98, p = 0.33) or hemispheres (p = 0.57). In HG, the cortex excluded in control (left = 15.7 +/− 9.2%, right = 7.0 +/− 2.8%) and schizophrenia samples (left = 11.7 +/− 8.5%, right = 6.8 +/− 5.1%) also was not different between groups (F(1,19) = 0.99, p = 0.33) but more tangentially cut tissue was excluded from the left hemisphere than the right (F(1,19) = 10.01, p < 0.01).
Figure 8.

Alternate analyses of cortical widths showed that the group and hemispheric differences were largely unaffected by removal of tangentially sectioned cortex, or by removal of thin cortex at the depth of sulci. In this example, different width measurements are shown from the upper and lower layers of the left and right whole PT. The bars labeled “all cortex” are measurements that did not remove tangentially cut cortex. Bars labeled “-thick” were from measurements in which any length of cortex with upper or lower layers greater than 1950 microns wide was omitted from the analysis, and this was the method used for the main analysis described in the text. The effect of this omission was to decrease the apparent width of cortex, especially in the upper layers. Bars labeled “-thick, -sulci” additionally omitted all cortex that had lower layers less than 593 microns thick. The effect of this omission was to increase the apparent lower layer width. Dark bars are nonpsychiatric, and white bars are schizophrenia samples. Values are median +/− S.D.
Removal of sulci from the width measurements
At the fundus of sulci, the lower layers become much thinner, while the upper layers are relatively unchanged (Figure 6). Therefore, it might be proposed that schizophrenia brains have reduced upper layer volume fraction because they have less sulci. However, this is an unlikely explanation for two reasons. First, fewer sulci would predict thicker lower layers in schizophrenia, which we did not consistently observe (Table 4). Second, in a separate analysis of widths, we removed all cortex that had lower layers less then 593um thick, effectively removing the fundus of the sulci. The effect of this manipulation was to increase the apparent width of the lower layer, but it did not change the group or hemisphere comparisons (Figure 8).
PT width asymmetry in non-psychiatric brains
A previous study of cortex width in nonpsychiatric brains reported right > left hemispheric asymmetry in the rostral PT, using anatomical borders similar to ours (Harasty et al., 2003). We similarly found a trend-level right > left asymmetry in the rostral PT in our non-psychiatric brains, in which the right hemisphere was about 3% thicker than the left (p = .08, paired t-test, see Table 4 for median values). This difference was due entirely to thicker lower layers in the right. However, a different pattern was seen in the caudal PT, where total cortex width showed the opposite, left>right asymmetry, amounting to a 5% difference (p = .03). This difference was slightly more pronounced in the upper (7%) than lower (4%) layers.
Discussion
Findings and limitations
The main finding of the current study is that the fractional volume of the upper cortical layers was reduced in the PT in schizophrenia, and this reduction was especially pronounced in the caudal PT. Although a similar change in volume fraction was found in the both the left and right caudal PT, width measurements revealed a hemispheric difference in the laminar changes. The caudal left hemisphere had a pronounced thinning of the upper layers, whereas the caudal right hemisphere had comparatively thicker lower layers. Measurements of HG and rostral PT showed some evidence for similar changes that did not reach statistical significance. Taken together, our findings indicate that schizophrenia brains have altered cytoarchitectonic organization. The most striking change is a thinning of the upper layers in the left caudal PT. This pattern is reminiscent of previous studies of PT volume asymmetry that reported disrupted asymmetry due to preferential volume loss in the left hemisphere. While our PT volume measurements did not detect altered asymmetry, a reasonable explanation is that whole PT volume measurements lacked sensitivity to detect changes that were most pronounced only in certain layers in a part of the PT.
Besides the findings in schizophrenia, our measurements identified normal asymmetries of total cortical width, with right>left asymmetry in the rostral PT, and left>right asymmetry in the caudal PT. As discussed below, these asymmetries are consistent with previous reports in the literature.
Our study used a small sample of brains, and the findings must be considered with caution until they are replicated in independent samples. In particular, in the brain sample A used for laminar measurements, the schizophrenia brains had slightly larger brain weights and PT volumes compared to the nonpsychiatric brains, whereas previous studies of schizophrenia have reported slightly smaller brain weights (Harrison et al., 2003) and PT volumes (Shapleske et al., 1999; Smiley, 2009). However, the findings of the present study were unaffected by covarying for brain weight. In the present study nearly all of the schizophrenia subjects were severely affected patients who underwent both long term hospitalization and treatment with typical antipsychotic medication. Longitudinal in vivo studies have reported progressive decrease in gray matter volume in schizophrenia, especially after treatment with typical antipsychotics (Lieberman et al., 2005; van Haren et al., 2007). Therefore, it might be expected that our sample of schizophrenia brains would show especially pronounced cortical changes. It is not known if antipsychotic treatment affects laminar volume fractions.
Volume asymmetry of the PT in schizophrenia
Altered functional asymmetry in the region of the superior temporal gyrus is a commonly reported phenomenon in schizophrenia (Cleghorn, 1992; Woodruff et al., 1997; Gur and Chin, 1999; Dollfus et al., 2005; Sommer et al., 2007). Reports of anatomical asymmetry, mainly from in vivo imaging, have less consistently reported altered asymmetry. We and others have recently reviewed more than 30 studies of the volume of the caudal superior temporal gyrus and its subcomponents including the PT and HG (Shapleske et al., 1999; Shenton et al., 2001; Smiley, 2009). These were roughly evenly divided between those that found altered hemispheric asymmetry due to larger left-sided deficits, and those that reported unaltered hemispheric asymmetry, either with bilateral reductions or no significant reduction. It seems parsimonious to conclude that volume reductions in the schizophrenia auditory cortex are at least sometimes more severe in the left hemisphere. Indeed, in spite of the substantial literature, we are aware of only one study that showed significantly right>left volume reduction in the caudal superior temporal region in schizophrenia, and that study included only left handed male subjects (Holinger et al., 1999).
It is not clear why altered asymmetry of this region in schizophrenia is only inconsistently found. There are not clear correlations between auditory cortex asymmetry and schizophrenia subtypes, and similar asymmetry changes have been reported in early onset and chronic patients (Kwon et al., 1999; Hirayasu et al., 2000). Nevertheless, it remains possible that there are unrecognized genetic or diagnostic factors that co-segregate with altered asymmetry. Additionally, it is possible that some in vivo imaging methods are especially sensitive to tissue distortions that occur in schizophrenia. Our width measurements suggest that one prominent distortion is selective thinning of the left upper layers. The fact that we did not detect comparable changes of PT volumes may reflect the high inter-individual variability in the shape of this structure. Specifically, the average coefficient of variation (S.D./mean) of PT volume measurements in our study was 0.22, very similar to that of previous MRI studies (Kwon et al., 1999; Hirayasu et al., 2000; Meisenzahl and al., 2002). In our brain sample A, the whole cortex width of the schizophrenia PT was about 4% thinner in the left and 2% thinner in the right compared to nonpsychiatric brains. These subtle changes are consistent with some in vivo volumetric studies that used large samples (e.g., Crespo-Facorro 2004; Shapleske 2001). Thus it is possible that inconsistent findings in this field reflect in part the low sensitivity provided by measuring the volume of the structurally variable PT.
Reduced fractional volume of upper layers
To our knowledge, previous studies have not measured fractional volumes of cortical layers in schizophrenia. We selected this parameter because it provides a sensitive measurement of cortical alterations that is presumed to be relatively unaffected by tissue distortions due to postmortem processing, and in contrast to width measurements is not biased by anisotropic orientation of the tissue (Howard and Reed, 1998). Additionally, fractional volumes are relatively independent of the uncertainty involved in identifying cortical regions of interest. As mentioned above, PT volume measurements are subject to high inter-individual differences due to the variable shape of this structure. Therefore, group comparisons of PT volumes incorporate this variance, whether they compare whole PT volumes or the volumes of its individual layers. However, the fractional volumes of cortical layers are comparatively free of this variance. For this reason we adopted the approach of measuring fractional volumes, and using complementary width measurements to determine the laminar source of altered fractional volumes.
Our findings of altered fractional volumes and cortical widths suggest that schizophrenia pathology may be more pronounced in the caudal PT. In monkeys, the cortex caudal to the auditory areas on the superior temporal plane is referred to as the temporoparietal area (Tpt). Although monkey Tpt receives substantial inputs from auditory association areas, it is not considered an auditory area, per se, as it lacks significant connections with the medial geniculate complex and with primary auditory cortex (Hackett et al., 2007; Smiley et al., 2007). It has multisensory responses (Leinonen et al., 1980) and its connections with visual, somatosensory and higher order association areas are consistent with its multisensory function (Pandya, 1995; Romanski et al., 1999; Falchier et al., 2002; Morecraft et al., 2004; Rozzi et al., 2006; Smiley et al., 2007). Multisensory integration also appears to be a prominent feature of the caudal belt association areas, which have somatosensory and visual reponses and connections (Falchier et al., 2002; Rockland and Ojima, 2003; Schroeder et al., 2003; Kayser et al., 2007). Besides area Tpt, there are also somatosensory and vestibular areas located in the fundus of the caudal lateral sulcus (Akbarian et al., 1994; Krubitzer et al., 1995).
In humans, the caudal PT is much more extensive than in monkeys and extends into the supramarginal gyrus. While there is evidence for a cytoarchitectonic homologue of monkey area Tpt (Galaburda and Sanides, 1980), several alternative cytoarchitectonic nomenclatures exist (Hackett, 2007). Functional imaging has demonstrated auditory phonetic processing but not semantic processing in the PT (Vigneau et al., 2006). Similar to monkeys, there is prominent somatosensory modulation of auditory function (Foxe et al., 2002), and there are visual responses including visual representation of language phonemes (Bernstein et al., 2008) and response to moving visual stimuli (Antal et al., 2008). Vestibular areas are found mainly on the dorsal bank of the lateral sulcus, but may extend into its fundus (Dieterich et al., 2003; Eickhoff et al., 2006). Thus this region in humans has at least roughly parallel functions in monkeys, and in humans is thought to have a role in multisensory identification of phonemes.
Abnormal PT asymmetry has been linked to phonological based reading impairments in disorders such as dyslexia (Hugdahl et al., 2003). In schizophrenia, deficits in phonetic processing have been demonstrated both behaviorally (Cienfuegos et al., 1999) and neurophysiologically using measures such as phonetic mismatch negativity (Bruder et al., 1999; Kasai et al., 2003). Furthermore, patients show reduced reading ability, especially on tests that stress basic phonological abilities (Revheim et al., 2006). Finally, deficits in phonetic mismatch negativity predict impaired social skills (Kawakubo et al., 2007), suggesting that dysfunction of this region may significantly impact functional outcome in schizophrenia.
Reduced laminar thickness in schizophrenia
Reduced gray matter volume in the cerebral cortex is a common finding in schizophrenia. A reasonable explanation for this effect is that the cortex is thinner, although reduced gyral complexity and surface area may also be involved (Wiegand et al., 2004; Wang et al., 2007; Fornito et al., 2008; Voets et al., 2008). Several MRI studies of cortex width have found evidence for widespread cortical thinning, typically in the range of 0 to 10% (Kuperberg et al., 2003; White et al., 2003; Narr et al., 2005; Wang et al., 2007; Nesvag et al., 2008).
Postmortem studies have also sometimes found thinner cortex in schizophrenia. Two studies of cingulate area 24 reported decreases of 10–12% (Kreczmanski et al., 2005) and 22%, with similar thinning across all layers (Bouras et al., 2001), but others found no change or slightly thicker cortex (Radewicz et al., 2000; Benes et al., 2001; Cotter et al., 2001). In prefrontal cortex, Selemon et al. reported a non-significant 8% decrease in thickness, with significant thinning of layer V in area 9 (7%) and layer II in area 46 (19%) (Selemon et al., 1995; 1998). Two other studies in area 9 also reported thinning of layer V (14%) (Rajkowska et al., 2002) or a nonsignificant thinning of layers V and VI (6%)(Cullen et al., 2006). Other studies of areas 9 and 46 found non-significant decreases of 2% (Pierri et al., 1999) and 3–5% (Woo et al., 1997), but several others found essentially unchanged or slightly thicker cortex (Radewicz et al., 2000; Beasley et al., 2002; Selemon et al., 2003; Kreczmanski et al., 2005; Cullen et al., 2006). In primary visual cortex, two studies found about 5% thinner cortex (Selemon et al., 1995; Woo et al., 1997) and a third reported 1% thicker cortex (Dorph-Petersen et al., 2007) but none of these findings was statistically significant. Together these postmortem findings suggest that schizophrenia cortex is typically in the range of 0–5% thinner. Unlike our findings in the PT, prefrontal cortex may have selective thinning of the lower layers.
In auditory cortex, Cotter et al. examined cortical widths in HG and the rostral PT, using a sample of mixed left and right hemispheres (Cotter et al., 2004; Beasley et al., 2005). Neither area had a statistically significant thinning in schizophrenia. However, consistent with our findings, re-grouping their results from the PT shows a thinning of about 9% in the combined layers I–III, whereas the combined layers IV–VI were 1% thicker. Their evaluation of individual layers suggested that layers 1, 3, 4 and 6 were thinner, but layer V was thicker. Another study that measured only cortex of the sulci in the PT did not find any change in schizophrenia (Chance et al., 2004).
Cellular basis of upper layer volume changes in schizophrenia
Smaller volume of the superficial layers could be caused by decreased neuron number, or by a reduction of the extraneuronal volume that would predict increased neuron density. In prefrontal cortex, two studies found that thinner cortex was correlated with increased neuron density (Selemon et al., 1998; Cullen et al., 2006). This interpretation is consistent with findings of reduced synaptic density especially in the upper layers, in auditory cortex (Sweet et al., 2007; Sweet et al., 2008) and in other cortical areas (Garey et al., 1998; Glantz and Lewis, 2000; Rosoklija et al., 2000). However, in auditory cortex, previous studies did not find clear evidence for increased density of neurons or glia (Cotter et al., 2004; Beasley et al., 2005) and our own preliminary measurements in the PT also have not found increased neuron density. Another possibility is that thinning of the upper layers is caused by a reduction of neuron number. Reduced neuron number is suggested by reports of reduced densities of GABA cells (Benes et al., 2001; Beasley et al., 2002; Cotter et al., 2002; Chance et al., 2005), which are highly concentrated in the superficial layers. However, decreased GABA cell density has not been found in all studies (Daviss and Lewis, 1995; Woo et al., 1997; Tooney and Chahl, 2004).
Another possibility is that the changes in schizophrenia may reflect a reorganization of the PT, due to over-representation of cytoarchitectonic area(s) with thinner upper layers. A study of visual cortex provided evidence for a similar reorganization (Dorph-Petersen et al., 2007). At present, the cytoarchitectonic areas of the PT are incompletely defined (Hackett, 2007).
PT asymmetry in nonpsychiatric brains
An additional finding of the present study is that non-psychiatric brains have a normal asymmetry of cortical thickness that is differentially distributed. The caudal PT had a left>right asymmetry, whereas the rostral PT had a trend-level right>left asymmetry, which was previously reported (Harasty et al., 2003), and in our study was due to thicker lower layers in the right. These differences add to previously observed cytoarchitectonic asymmetries in this region, including greater spacing of minicolumns in the left (Buxhoeveden and Casanova, 2000; Chance et al., 2006; Chance et al., 2008), proportionally more white matter and thicker myelin sheaths in the left (Anderson et al., 1999), and larger layer III pyramidal neurons in the left (Hutsler, 2003). Most of these findings were demonstrated in the rostral PT, whereas the caudal PT is less studied. The rostral PT is presumed to contain first- and second-order auditory association areas similar to the “belt” and “parabelt” of monkeys (Hackett et al., 2001). The significance of these cytoarchiteconic asymmetries is uncertain. It could be hypothesized that thicker lower layers in the right reflect greater “feed-back” processing in that hemisphere. Perhaps the interhemispheric connections are weighted toward feed-forward from the left to the right hemisphere. This interpretation is also consistent with larger layer III pyramidal cells in the left hemisphere.
In the caudal PT, the left cortex was thicker, and the difference was present in both lower and upper layers, although somewhat more pronounced in the upper layers. This asymmetry is consistent with previous in vivo findings of left>right cortical thickness that was found on the outer surface of the caudal superior temporal gyrus and extended over the adjacent inferior parietal cortex (Hamilton et al., 2007). As already discussed, the caudal PT is thought to have a role in multisensory integration and phonetic processing, and its asymmetry may be related in part to language processing. The parietal cortex also has areas with complex multisensory integration, and in monkeys two of these (PG and PGm) are synaptically connected to the caudal PT (Morecraft et al., 2004; Rozzi et al., 2006; Smiley et al., 2007). In humans, the inferior parietal cortex has functional asymmetries, including left hemisphere specialization for regulation of fine motor control, and right hemisphere specialization for spatial orientation. Thus the caudal PT and inferior parietal cortex are directly connected, are both regions of multisensory integration, and both have functional and anatomical asymmetries including thicker cortex in the left hemisphere. In light of these similarities, it is possible that these two regions have parallel and possibly coordinated functional organizations. Torrey (Torrey, 2007) has hypothesize that disrupted multisensory integration in the inferior parietal cortex may be a cause of the commonly observed deficits of sensory perception in schizophrenia. Our results in the caudal PT suggest that the adjacent and connected caudal PT may also be a region of disrupted multisensory integration.
Summary
A large literature has documented reductions of volume of the cerebral cortex in schizophrenia, and at least part of this reduction is due to cortical thinning. We used postmortem brains to investigate whether thinning was selective for certain layers, regions or hemispheres in the PT and HG. The most pronounced change was a thinning of the upper layers of the caudal PT in the left hemisphere, and this change predicts disruptions of the multisensory and phonetic functions of this region. Somewhat less pronounced changes were found in rostral PT and HG, and it is possible that a similar disruption is present in those areas. Hemispheric comparisons showed a different laminar profile in the right hemisphere, where the caudal PT displayed somewhat thicker lower layers. These hemisphere-specific changes are consistent with previous volume measurements that found altered asymmetry of the PT. The present study also evaluated whole PT volumes, but those measurements did not reveal differences in schizophrenia, and it is concluded that measurements of the fractional volumes and widths of the upper and lower layers provide a more sensitive morphometric method. Together, the findings suggest that changes in schizophrenia are not uniformly distributed in the cortex, but are differentially distributed by layers, by area, and by hemisphere. The most pronounced and consistent change was a thinning the upper cortical layers in the left hemisphere, possibly reflecting reduced cortico-cortical connections.
Acknowledgments
We are grateful to Khadija Figarsky and Cynthia Bleiwas for assistance with histological processing and analysis. This work was supported by NIH grants MH 067138 (to JFS), MH64168 and MH60877 (to AJD) and by grants from the Stanley Medical Research Institute (to JFS and AJD).
Abbreviations
- A1
primary auditory cortex
- AI
asymmetry index = (left−right)/(0.5×(left+right))
- HG
Heschl’s gyrus
- HS
Heschl’s sulcus
- PT
planum temporale
- Tpt
temporoparietal area of Galaburda and Sanides (1980)
Footnotes
Financial Disclosures
The authors have no financial conflicts of interest to declare.
References
- Akbarian S, Grusser OJ, Guldin WO. Corticofugal connections between the cerebral cortex and brainstem vestibular nuclei in the macaque monkey. J Comp Neurol. 1994;339:421–437. doi: 10.1002/cne.903390309. [DOI] [PubMed] [Google Scholar]
- Anderson B, Southern BD, Powers RE. Anatomic asymmetries of the posterior superior temporal lobes: a postmortem study. Neuropsychiatry, Neuoropsychology and Behavioral Neurology. 1999;12:247–254. [PubMed] [Google Scholar]
- Antal A, Baudewig J, Paulus W, Dechent P. The posterior cingulate cortex and planum temporale/parietal operculum are activated by coherent visual motion. Vis Neurosci. 2008;25:17–26. doi: 10.1017/S0952523808080024. [DOI] [PubMed] [Google Scholar]
- Beasley CL, Chana G, Honavar M, Landau S, Everall IP, Cotter D. Evidence for altered neuronal organisation within the planum temporale in major psychiatric disorders. Schizophr Res. 2005;73:69–78. doi: 10.1016/j.schres.2004.08.011. [DOI] [PubMed] [Google Scholar]
- Beasley CL, Zhang ZJ, Patten I, Reynolds GP. Selective deficits in prefrontal cortical GABAergic neurons in schizophrenia defined by the presence of calcium-binding proteins. Biol Psychiatry. 2002;52:708–715. doi: 10.1016/s0006-3223(02)01360-4. [DOI] [PubMed] [Google Scholar]
- Benes FM, Vincent SL, Todtenkopf M. The density of pyramidal and nonpyramidal neurons in anterior cingulate cortex of schizophrenic and bipolar subjects. Biol Psychiatry. 2001;50:395–406. doi: 10.1016/s0006-3223(01)01084-8. [DOI] [PubMed] [Google Scholar]
- Bernstein LE, Lu ZL, Jiang J. Quantified acoustic-optical speech signal incongruity identifies cortical sites of audiovisual speech processing. Brain Res. 2008 doi: 10.1016/j.brainres.2008.04.018. Advance online publication. [DOI] [PMC free article] [PubMed] [Google Scholar]
- Bouras C, Kovari E, Hof PR, Riederer BM, Giannakopoulos P. Anterior cingulate cortex pathology in schizophrenia and bipolar disorder. Acta Neuropathol. 2001;102:373–379. doi: 10.1007/s004010100392. [DOI] [PubMed] [Google Scholar]
- Bruder G, Kayser J, Tenke C, Amador X, Friedman M, Sharif Z, Gorman J. Left temporal lobe dysfunction in schizophrenia: event-related potential and behavioral evidence from phonetic and tonal dichotic listening tasks. Arch Gen Psychiatry. 1999;56:267–276. doi: 10.1001/archpsyc.56.3.267. [DOI] [PubMed] [Google Scholar]
- Buxhoeveden D, Casanova M. Comparative lateralisation patterns in the language area of human, chimpanzee, and rhesus monkey brains. Laterality. 2000;5:315–330. doi: 10.1080/713754390. [DOI] [PubMed] [Google Scholar]
- Caspers S, Geyer S, Schleicher A, Mohlberg H, Amunts K, Zilles K. The human inferior parietal cortex: cytoarchitectonic parcellation and interindividual variability. Neuroimage. 2006;33:430–448. doi: 10.1016/j.neuroimage.2006.06.054. [DOI] [PubMed] [Google Scholar]
- Chance SA, Casanova MF, Switala AE, Crow TJ. Auditory cortex asymmetry, altered minicolumn spacing and absence of ageing effects in schizophrenia. Brain. 2008;131:3178–3192. doi: 10.1093/brain/awn211. [DOI] [PMC free article] [PubMed] [Google Scholar]
- Chance SA, Casanova MF, Switala AE, Crow TJ, Esiri MM. Minicolumn thinning in temporal lobe association cortex but not primary auditory cortex in normal human ageing. Acta Neuropathol (Berl) 2006;111:459–464. doi: 10.1007/s00401-005-0014-z. [DOI] [PubMed] [Google Scholar]
- Chance SA, Tzotzoli PM, Vitelli A, Esiri MM, Crow TJ. The cytoarchitecture of sulcal folding in Heschl's sulcus and the temporal cortex in the normal brain and schizophrenia: lamina thickness and cell density. Neurosci Lett. 2004;367:384–388. doi: 10.1016/j.neulet.2004.06.041. [DOI] [PubMed] [Google Scholar]
- Chance SA, Walker M, Crow TJ. Reduced density of calbindin-immunoreactive interneurons in the planum temporale in schizophrenia. Brain Res. 2005;1046:32–37. doi: 10.1016/j.brainres.2005.03.045. [DOI] [PubMed] [Google Scholar]
- Cienfuegos A, March L, Shelley A-M, Javitt DC. Impaired categorical perception of synthetic speech sound in shcizophrenia. Biol. Psych. 1999;45:82–88. doi: 10.1016/s0006-3223(98)00064-x. [DOI] [PubMed] [Google Scholar]
- Cleghorn JMS, Franco S, Szechtman B, Kaplan RD, Szechtman H, Brown GM, Nahmias C, Garnett ES. Toward a brain map of auditory hallucinations. Am. J. Psych. 1992;149:1062–1069. doi: 10.1176/ajp.149.8.1062. [DOI] [PubMed] [Google Scholar]
- Cotter D, Landau S, Beasley C, Stevenson R, Chana G, MacMillan L, Everall I. The density and spatial distribution of GABAergic neurons, labelled using calcium binding proteins, in the anterior cingulate cortex in major depressive disorder, bipolar disorder, and schizophrenia. Biol Psychiatry. 2002;51:377–386. doi: 10.1016/s0006-3223(01)01243-4. [DOI] [PubMed] [Google Scholar]
- Cotter D, Mackay D, Frangou S, Hudson L, Landau S. Cell density and cortical thickness in Heschl's gyrus in schizophrenia, major depression and bipolar disorder. Br J Psychiatry. 2004;185:258–259. doi: 10.1192/bjp.185.3.258. [DOI] [PubMed] [Google Scholar]
- Cotter D, Mackay D, Landau S, Kerwin R, Everall I. Reduced glial cell density and neuronal size in the anterior cingulate cortex in major depressive disorder. Arch Gen Psychiatry. 2001;58:545–553. doi: 10.1001/archpsyc.58.6.545. [DOI] [PubMed] [Google Scholar]
- Crow TJ. Schizoprhenia as the price that Homo sapiens pays for language: a resolution of the central paradox in the origin of the species. Brain Res. Rev. 2000;31:118–129. doi: 10.1016/s0165-0173(99)00029-6. [DOI] [PubMed] [Google Scholar]
- Cullen TJ, Walker MA, Eastwood SL, Esiri MM, Harrison PJ, Crow TJ. Anomalies of asymmetry of pyramidal cell density and structure in dorsolateral prefrontal cortex in schizophrenia. Br J Psychiatry. 2006;188:26–31. doi: 10.1192/bjp.bp.104.008169. [DOI] [PubMed] [Google Scholar]
- Daviss SR, Lewis DA. Local circuit neurons of the prefrontal cortex in schizophrenia: selective increase in the density of calbindin-immunoreactive neurons. Psych. Res. 1995;59:81–96. doi: 10.1016/0165-1781(95)02720-3. [DOI] [PubMed] [Google Scholar]
- Dieterich M, Bense S, Lutz S, Drzezga A, Stephan T, Bartenstein P, Brandt T. Dominance for vestibular cortical function in the non-dominant hemisphere. Cereb Cortex. 2003;13:994–1007. doi: 10.1093/cercor/13.9.994. [DOI] [PubMed] [Google Scholar]
- Dollfus S, Razafimandimby A, Delamillieure P, Brazo P, Joliot M, Mazoyer B, Tzourio-Mazoyer N. Atypical hemispheric specialization for language in right-handed schizophrenia patients. Biol Psychiatry. 2005;57:1020–1028. doi: 10.1016/j.biopsych.2005.01.009. [DOI] [PubMed] [Google Scholar]
- Dorph-Petersen KA, Pierri JN, Wu Q, Sampson AR, Lewis DA. Primary visual cortex volume and total neuron number are reduced in schizophrenia. J Comp Neurol. 2007;501:290–301. doi: 10.1002/cne.21243. [DOI] [PubMed] [Google Scholar]
- Dwork A, Liu D, Kaufman M, Prohovnik I. Archival, formalin-fixed tissue: its use in the study of Alzheimer's type changes. Clin. Neuropathol. 1998;17:45–49. [PubMed] [Google Scholar]
- Eickhoff SB, Weiss PH, Amunts K, Fink GR, Zilles K. Identifying human parieto-insular vestibular cortex using fMRI and cytoarchitectonic mapping. Hum Brain Mapp. 2006;27:611–621. doi: 10.1002/hbm.20205. [DOI] [PMC free article] [PubMed] [Google Scholar]
- Falchier A, Clavagnier S, Barone P, Kennedy H. Anatomical evidence of multimodal integration in primate striate cortex. J Neurosci. 2002;22:5749–5759. doi: 10.1523/JNEUROSCI.22-13-05749.2002. [DOI] [PMC free article] [PubMed] [Google Scholar]
- Fornito A, Yucel M, Wood SJ, Adamson C, Velakoulis D, Saling MM, McGorry PD, Pantelis C. Surface-based morphometry of the anterior cingulate cortex in first episode schizophrenia. Hum Brain Mapp. 2008;29:478–489. doi: 10.1002/hbm.20412. [DOI] [PMC free article] [PubMed] [Google Scholar]
- Foxe JJ, Wylie GR, Martinez A, Schroeder CE, Javitt DC, Guilfoyle D, Ritter W, Murray MM. Auditory-somatosensory multisensory processing in auditory association cortex: an fMRI study. J Neurophysiol. 2002;88:540–543. doi: 10.1152/jn.2002.88.1.540. [DOI] [PubMed] [Google Scholar]
- Galaburda A, Sanides F. Cytoarchitectonic organization of the human auditory cortex. J. Comp. Neurol. 1980;190:597–610. doi: 10.1002/cne.901900312. [DOI] [PubMed] [Google Scholar]
- Garey LJ, Ong WY, Patel TS, Kanani M, Davis A, Mortimer AM, Barnes TRE, Hirsch SR. Reduced dendritic spine density on cerebral cortical pyramidal neurons in schizophrenia. J. Neurol. Neurosurg. Psych. 1998;65:446–453. doi: 10.1136/jnnp.65.4.446. [DOI] [PMC free article] [PubMed] [Google Scholar]
- Glantz LA, Lewis DA. Decreased dendritic spine density on prefrontal cortical pyramidal neurons in schizphrenia. Arch. Gen Psych. 2000;37:65–73. doi: 10.1001/archpsyc.57.1.65. [DOI] [PubMed] [Google Scholar]
- Gur RE, Chin S. Laterality in functional brain imaging studies of schizophrenia. Schiz Bull. 1999;25:141–156. doi: 10.1093/oxfordjournals.schbul.a033361. [DOI] [PubMed] [Google Scholar]
- Hackett TA. Organization and correspondence of the auditory cortex of humans and nonhuman primates. In: Kaas J, editor. Evolution of the Nervous System. Oxford: Elsevier; 2007. pp. 109–119. [Google Scholar]
- Hackett TA, De La Mothe LA, Ulbert I, Karmos G, Smiley J, Schroeder CE. Multisensory convergence in auditory cortex, II. Thalamocortical connections of the caudal superior temporal plane. J Comp Neurol. 2007;502:924–952. doi: 10.1002/cne.21326. [DOI] [PubMed] [Google Scholar]
- Hackett TA, Preuss TM, Kaas JH. Architectonic identification of the core region in auditory cortex of macaques, chempanzees, and humans. J. Comp. Neurol. 2001;441:197–222. doi: 10.1002/cne.1407. [DOI] [PubMed] [Google Scholar]
- Hamilton LS, Narr KL, Crow TJ, Szeszko PR, Thompson PM, Bilder RM, Toga AW. Asymmetries of cortical thickness: effects of handedness, sex, and schizophrenia. Neuroreport. 2007;18:1427–1431. doi: 10.1097/WNR.0b013e3282e9a5a2. [DOI] [PMC free article] [PubMed] [Google Scholar]
- Harasty J, Seldon HL, Chan P, Halliday G, Harding A. The left human speech-processing cortex is thinner but longer than the right. Laterality. 2003;8:247–260. doi: 10.1080/13576500244000175. [DOI] [PubMed] [Google Scholar]
- Harrison PJ, Freemantle N, Geddes JR. Meta-analysis of brain weight in schizophrenia. Schizophr Res. 2003;64:25–34. doi: 10.1016/s0920-9964(02)00502-9. [DOI] [PubMed] [Google Scholar]
- Hirayasu Y, McCarley RW, Salizbury DF, Tanaka S, Kwon JS, Frumin M, Snyderman D, Yurgelun-Todd D, Kikinis R, Jolesz FA, Shenton ME. Planum temporale and Heschl gyrus volume reduction in schziophrenia. Arch. Gen. Psych. 2000;57:692–699. doi: 10.1001/archpsyc.57.7.692. [DOI] [PMC free article] [PubMed] [Google Scholar]
- Holinger DP, Shenton ME, Wible CG, Donino R, Kikinis R, Jolesz FA, McCarley RW. Superior temporal gyrus volume abnormalities and thought disorder in left-handed schizophrenic men. Am. J. Psych. 1999;156:1730–1735. doi: 10.1176/ajp.156.11.1730. [DOI] [PMC free article] [PubMed] [Google Scholar]
- Howard CV, Reed MG. Unbiased stereology: Three-dimensional measurement in microscopy. New York: Springer-Verlag; 1998. [Google Scholar]
- Hugdahl K, Heiervang E, Ersland L, Lundervold A, Steinmetz H, Smievoll AI. Significant relation between MR measures of planum temporale area and dichotic processing of syllables in dyslexic children. Neuropsychologia. 2003;41:666–675. doi: 10.1016/s0028-3932(02)00224-5. [DOI] [PubMed] [Google Scholar]
- Hutsler JJ. The specialized structure of human language cortex: pyramidal cell size asymmetries within auditory and language-associated regions of the temporal lobes. Brain Lang. 2003;86:226–242. doi: 10.1016/s0093-934x(02)00531-x. [DOI] [PubMed] [Google Scholar]
- Jones SE, Buchbinder BR, Aharon I. Three-dimensional mapping of cortical thickness using Laplace's equation. Hum Brain Mapp. 2000;11:12–32. doi: 10.1002/1097-0193(200009)11:1<12::AID-HBM20>3.0.CO;2-K. [DOI] [PMC free article] [PubMed] [Google Scholar]
- Kasai K, Yamada H, Kamio S, Nakagome K, Iwanami A, Fukuda M, Yumoto M, Itoh K, Koshida I, Abe O, Kato N. Neuromagnetic correlates of impaired automatic categorical perception of speech sounds in schizophrenia. Schizophr Res. 2003;59:159–172. doi: 10.1016/s0920-9964(01)00382-6. [DOI] [PubMed] [Google Scholar]
- Katsel P, Davis KL, Gorman JM, Haroutunian V. Variations in differential gene expression patterns across multiple brain regions in schizophrenia. Schizophr Res. 2005;77:241–252. doi: 10.1016/j.schres.2005.03.020. [DOI] [PubMed] [Google Scholar]
- Kawakubo Y, Kamio S, Nose T, Iwanami A, Nakagome K, Fukuda M, Kato N, Rogers MA, Kasai K. Phonetic mismatch negativity predicts social skills acquisition in schizophrenia. Psychiatry Res. 2007;152:261–265. doi: 10.1016/j.psychres.2006.02.010. [DOI] [PubMed] [Google Scholar]
- Kayser C, Petkov CI, Augath M, Logothetis NK. Functional imaging reveals visual modulation of specific fields in auditory cortex. J Neurosci. 2007;27:1824–1835. doi: 10.1523/JNEUROSCI.4737-06.2007. [DOI] [PMC free article] [PubMed] [Google Scholar]
- Keilp JG, Waniek C, Goldman RG, Zemishlany Z, Alexander GE, Gibbon M, Wu A, Susser E, Prohovnik I. Reliability of post-mortem chart diagnoses of schizophrenia and dementia. Schizophr Res. 1995;17:221–228. doi: 10.1016/0920-9964(94)00092-m. [DOI] [PubMed] [Google Scholar]
- Kelly TM, Mann JJ. Validity of DSM-III-R diagnosis by psychological autopsy: a comparison with clinician ante-mortem diagnosis. Acta Psychiatr. Scand. 1996;94:337–343. doi: 10.1111/j.1600-0447.1996.tb09869.x. [DOI] [PubMed] [Google Scholar]
- Konopaske GT, Sweet RA, Wu Q, Sampson A, Lewis DA. Regional specificity of chandelier neuron axon terminal alterations in schizophrenia. Neuroscience. 2006;138:189–196. doi: 10.1016/j.neuroscience.2005.10.070. [DOI] [PubMed] [Google Scholar]
- Kreczmanski P, Schmidt-Kastner R, Heinsen H, Steinbusch HW, Hof PR, Schmitz C. Stereological studies of capillary length density in the frontal cortex of schizophrenics. Acta Neuropathol (Berl) 2005;109:510–518. doi: 10.1007/s00401-005-1003-y. [DOI] [PubMed] [Google Scholar]
- Krubitzer L, Clarey J, Tweedale R, Elston G, Calford M. A redefinition of somatosensory areas in the lateral sulcus of macaque monkeys. J Neurosci. 1995;15:3821–3839. doi: 10.1523/JNEUROSCI.15-05-03821.1995. [DOI] [PMC free article] [PubMed] [Google Scholar]
- Kuperberg GR, Broome MR, McGuire PK, David AS, Eddy M, Ozawa F, Goff D, West WC, Williams SC, van der Kouwe AJ, Salat DH, Dale AM, Fischl B. Regionally localized thinning of the cerebral cortex in schizophrenia. Arch Gen Psychiatry. 2003;60:878–888. doi: 10.1001/archpsyc.60.9.878. [DOI] [PubMed] [Google Scholar]
- Kwon JS, McCarley RW, Hirayasu Y, Anderson JE, Fischer IA, Kikinis R, Jolesz FA, Shenton ME. Left planum temporale volume reduction in schizophrenia. Arch. Gen. Psychiatry. 1999;56:142–148. doi: 10.1001/archpsyc.56.2.142. [DOI] [PubMed] [Google Scholar]
- Leinonen L, Hyvarinen J, Sovijarvi AR. Functional properties of neurons in the temporo-parietal association cortex of awake monkey. Exp Brain Res. 1980;39:203–215. doi: 10.1007/BF00237551. [DOI] [PubMed] [Google Scholar]
- Lieberman JA, Tollefson GD, Charles C, Zipursky R, Sharma T, Kahn RS, Keefe RS, Green AI, Gur RE, McEvoy J, Perkins D, Hamer RM, Gu H, Tohen M. Antipsychotic drug effects on brain morphology in first-episode psychosis. Arch Gen Psychiatry. 2005;62:361–370. doi: 10.1001/archpsyc.62.4.361. [DOI] [PubMed] [Google Scholar]
- Meisenzahl EM, et al. Does the definition of borders of the planum temporale influence the results in schizophrenia? Am. J. Psych. 2002;159:1198–1200. doi: 10.1176/appi.ajp.159.7.1198. [DOI] [PubMed] [Google Scholar]
- Morecraft RJ, Cipolloni PB, Stilwell-Morecraft KS, Gedney MT, Pandya DN. Cytoarchitecture and cortical connections of the posterior cingulate and adjacent somatosensory fields in the rhesus monkey. J Comp Neurol. 2004;469:37–69. doi: 10.1002/cne.10980. [DOI] [PubMed] [Google Scholar]
- Narr KL, Bilder RM, Toga AW, Woods RP, Rex DE, Szeszko PR, Robinson D, Sevy S, Gunduz-Bruce H, Wang YP, DeLuca H, Thompson PM. Mapping cortical thickness and gray matter concentration in first episode schizophrenia. Cereb Cortex. 2005;15:708–719. doi: 10.1093/cercor/bhh172. [DOI] [PubMed] [Google Scholar]
- Nesvag R, Lawyer G, Varnas K, Fjell AM, Walhovd KB, Frigessi A, Jonsson EG, Agartz I. Regional thinning of the cerebral cortex in schizophrenia: effects of diagnosis, age and antipsychotic medication. Schizophr Res. 2008;98:16–28. doi: 10.1016/j.schres.2007.09.015. [DOI] [PubMed] [Google Scholar]
- Pandya DN. Anatomy of the auditory cortex. Rev. Neurol. (Paris) 1995;151:486–494. [PubMed] [Google Scholar]
- Penhune VB, Zatorre RJ, MacDonald JD, Evans AC. Interhemispheric anatomical differences in human primary auditory cortex: probabilistic mapping and volume measurement from magnetic resonance scans. Cereb Cortex. 1996;6:661–672. doi: 10.1093/cercor/6.5.661. [DOI] [PubMed] [Google Scholar]
- Pierri JN, Chaudry AS, Woo TU, Lewis DA. Alterations in chandelier neuron axon terminals in the prefrontal cortex of schizophrenic subjects. Am J Psychiatry. 1999;156:1709–1719. doi: 10.1176/ajp.156.11.1709. [DOI] [PubMed] [Google Scholar]
- Radewicz K, Garey LJ, Gentleman SM, Reynolds R. Increase in HLA-DR immunoreactive microglia in frontal and temporal cortex of chronic schizophrenics. J. Neuropath. Exp. Neurol. 2000;59:137–150. doi: 10.1093/jnen/59.2.137. [DOI] [PubMed] [Google Scholar]
- Rajkowska G, Miguel-Hidalgo JJ, Makkos Z, Meltzer H, Overholser J, Stockmeier C. Layer-specific reductions in GFAP-reactive astroglia in the dorsolateral prefrontal cortex in schizophrenia. Schizophr Res. 2002;57:127–138. doi: 10.1016/s0920-9964(02)00339-0. [DOI] [PubMed] [Google Scholar]
- Revheim N, Butler PD, Schechter I, Jalbrzikowski M, Silipo G, Javitt DC. Reading impairment and visual processing deficits in schizophrenia. Schizophr Res. 2006;87:238–245. doi: 10.1016/j.schres.2006.06.022. [DOI] [PMC free article] [PubMed] [Google Scholar]
- Rockland KS, Ojima H. Multisensory convergence in calcarine visual areas in macaque monkey. Int J Psychophysiol. 2003;50:19–26. doi: 10.1016/s0167-8760(03)00121-1. [DOI] [PubMed] [Google Scholar]
- Romanski LM, Bates JF, Goldman-Rakic PS. Auditory belt and parabelt projections to the prefrontal cortex in the rhesus monkey. J. Comp. Neurol. 1999;403:141–157. doi: 10.1002/(sici)1096-9861(19990111)403:2<141::aid-cne1>3.0.co;2-v. [DOI] [PubMed] [Google Scholar]
- Rosoklija G, Toomayan G, Ellis SP, Keilp J, Mann J, Latov N, Hays AP, Dwork AJ. Structural abnormalities of subicular dendrites in subjects with schizophrenia and mood disorders. Arch. Gen. Psych. 2000;57:349–356. doi: 10.1001/archpsyc.57.4.349. [DOI] [PubMed] [Google Scholar]
- Rozzi S, Calzavara R, Belmalih A, Borra E, Gregoriou GG, Matelli M, Luppino G. Cortical connections of the inferior parietal cortical convexity of the macaque monkey. Cereb Cortex. 2006;16:1389–1417. doi: 10.1093/cercor/bhj076. [DOI] [PubMed] [Google Scholar]
- Schroeder CE, Smiley J, Fu KG, McGinnis T, O'Connell MN, Hackett TA. Anatomical mechanisms and functional implications of multisensory convergence in early cortical processing. Int J Psychophysiol. 2003;50:5–17. doi: 10.1016/s0167-8760(03)00120-x. [DOI] [PubMed] [Google Scholar]
- Selemon LD, Mrzljak J, Kleinman JE, Herman MM, Goldman-Rakic PS. Regional specificity in the neuropathologic substrates of schizophrenia: a morphometric analysis of Broca's area 44 and area 9. Arch Gen Psychiatry. 2003;60:69–77. doi: 10.1001/archpsyc.60.1.69. [DOI] [PubMed] [Google Scholar]
- Selemon LD, Rajkowska G, Goldman-Rakic PS. Abnormally high neuronal density in the schizophrenic cortex. Arch. Gen. Psych. 1995;52:805–818. doi: 10.1001/archpsyc.1995.03950220015005. [DOI] [PubMed] [Google Scholar]
- Selemon LD, Rajkowska G, Goldman-Rakic PS. Elevated neuronal density in prefrontal area 46 in brains from schizophrenic patients: application of a three-dimensional stereologic counting method. J. Comp. Neurol. 1998;392:402–412. [PubMed] [Google Scholar]
- Shapleske J, Rossell SL, Woodruff PWR, David AS. The planum temporale: a systematic quantitative review of its structural, functional and clinical significance. Brain Res. Rev. 1999;29:26–49. doi: 10.1016/s0165-0173(98)00047-2. [DOI] [PubMed] [Google Scholar]
- Shenton ME, Dickey CC, Frumin M, McCarley RW. A review of MRI findings in schizophrenia. Schizophr Res. 2001;49:1–52. doi: 10.1016/s0920-9964(01)00163-3. [DOI] [PMC free article] [PubMed] [Google Scholar]
- Smiley JF. Auditory cortex anatomy and asymmetry in schizophrenia. In: Lajtha A, editor. Handbook of Neurochemistry and Molecular Neurobiology (3rd Edn) New York: Springer Publishers; 2009. [Google Scholar]
- Smiley JF, Hackett TA, Ulbert I, Karmas G, Lakatos P, Javitt DC, Schroeder CE. Multisensory convergence in auditory cortex, I. Cortical connections of the caudal superior temporal plane in macaque monkeys. J Comp Neurol. 2007;502:894–923. doi: 10.1002/cne.21325. [DOI] [PubMed] [Google Scholar]
- Sommer IE, Vd Veer AJ, Wijkstra J, Boks MP, Kahn RS. Comparing language lateralization in psychotic mania and psychotic depression to schizophrenia; a functional MRI study. Schizophr Res. 2007;89:364–365. doi: 10.1016/j.schres.2006.09.005. [DOI] [PubMed] [Google Scholar]
- Steinmetz H, Rademacher J, Jancke L, Huang Y, Thron A, Zilles K. Total surface of temporoparietal intrasylvian cortex: Diverging left-right asymmetries. Brain and Language. 1990;39:357–372. doi: 10.1016/0093-934x(90)90145-7. [DOI] [PubMed] [Google Scholar]
- Sweet RA, Bergen SE, Sun Z, Marcsisin MJ, Sampson AR, Lewis DA. Anatomical evidence of impaired feedforward auditory processing in schizophrenia. Biol Psychiatry. 2007;61:854–864. doi: 10.1016/j.biopsych.2006.07.033. [DOI] [PubMed] [Google Scholar]
- Sweet RA, Henteleff RA, Zhang W, Sampson AR, Lewis DA. Reduced Dendritic Spine Density in Auditory Cortex of Subjects with Schizophrenia. Neuropsychopharmacology. 2008 doi: 10.1038/npp.2008.67. Advance online publication. [DOI] [PMC free article] [PubMed] [Google Scholar]
- Tooney PA, Chahl LA. Neurons expressing calcium-binding proteins in the prefrontal cortex in schizophrenia. Prog Neuropsychopharmacol Biol Psychiatry. 2004;28:273–278. doi: 10.1016/j.pnpbp.2003.10.004. [DOI] [PubMed] [Google Scholar]
- Torrey EF. Schizophrenia and the inferior parietal lobule. Schizophr Res. 2007;97:215–225. doi: 10.1016/j.schres.2007.08.023. [DOI] [PubMed] [Google Scholar]
- van Haren NE, Hulshoff Pol HE, Schnack HG, Cahn W, Mandl RC, Collins DL, Evans AC, Kahn RS. Focal gray matter changes in schizophrenia across the course of the illness: a 5-year follow-up study. Neuropsychopharmacology. 2007;32:2057–2066. doi: 10.1038/sj.npp.1301347. [DOI] [PubMed] [Google Scholar]
- Vigneau M, Beaucousin V, Herve PY, Duffau H, Crivello F, Houde O, Mazoyer B, Tzourio-Mazoyer N. Meta-analyzing left hemisphere language areas: phonology, semantics, and sentence processing. Neuroimage. 2006;30:1414–1432. doi: 10.1016/j.neuroimage.2005.11.002. [DOI] [PubMed] [Google Scholar]
- Voets NL, Hough MG, Douaud G, Matthews PM, James A, Winmill L, Webster P, Smith S. Evidence for abnormalities of cortical development in adolescent-onset schizophrenia. Neuroimage. 2008;43:665–675. doi: 10.1016/j.neuroimage.2008.08.013. [DOI] [PubMed] [Google Scholar]
- Wang L, Hosakere M, Trein JC, Miller A, Ratnanather JT, Barch DM, Thompson PA, Qiu A, Gado MH, Miller MI, Csernansky JG. Abnormalities of cingulate gyrus neuroanatomy in schizophrenia. Schizophr Res. 2007;93:66–78. doi: 10.1016/j.schres.2007.02.021. [DOI] [PMC free article] [PubMed] [Google Scholar]
- West MJ, Gundersen HJG. Unbiased stereological estimation of the number of neurons in the human hippocampus. J. Comp. Neurol. 1990;296:1–22. doi: 10.1002/cne.902960102. [DOI] [PubMed] [Google Scholar]
- White T, Andreasen NC, Nopoulos P, Magnotta V. Gyrification abnormalities in childhood- and adolescent-onset schizophrenia. Biol Psychiatry. 2003;54:418–426. doi: 10.1016/s0006-3223(03)00065-9. [DOI] [PubMed] [Google Scholar]
- Wiegand LC, Warfield SK, Levitt JJ, Hirayasu Y, Salisbury DF, Heckers S, Dickey CC, Kikinis R, Jolesz FA, McCarley RW, Shenton ME. Prefrontal cortical thickness in first-episode psychosis: a magnetic resonance imaging study. Biol Psychiatry. 2004;55:131–140. doi: 10.1016/j.biopsych.2003.07.009. [DOI] [PMC free article] [PubMed] [Google Scholar]
- Woo T-U, Miller JL, Lewis DA. Schizophrenia and the parvalbumin-containing class of cortical local circuit neurons. Am. J. Psych. 1997;154:1013–1015. doi: 10.1176/ajp.154.7.1013. [DOI] [PubMed] [Google Scholar]
- Woodruff PWR, Wright IC, Bullmore ET, Brammer M, Howard RJ, Williams SCR, Shapleske J, Rossell S, David AS, McGuire PK, Murray RM. Auditory hallucinations and the temporal cortical response to speech in schizophrenia: a functional magnetic resonance imaging study. Am. J. Psych. 1997;154:1676–1682. doi: 10.1176/ajp.154.12.1676. [DOI] [PubMed] [Google Scholar]
- Wright IC, Rabe-Hesketh S, Woodruff PWR, David AS, Murray RM, Bullmore ET. Meta-analysis of regional brain volumes in schizophrenia. Am. J. Psych. 2000;157:16–25. doi: 10.1176/ajp.157.1.16. [DOI] [PubMed] [Google Scholar]