Abstract
Sample preparation for proteomic analysis involves precipitation of protein using 2,2,2-trichloroacetic acid (TCA). In this study, we examine the mechanism of the TCA-induced protein precipitation reaction. TCA-induced protein precipitation curves are U-shaped and the shape of the curve is observed to be independent of the physicochemical properties of proteins. TCA is significantly less effective in precipitating unfolded states of proteins. Results of the 1-anilino-8-napthalene sulfonate (ANS) and size-exclusion chromatography, obtained using acidic fibroblast growth factor (aFGF), show that a stable “molten globule-like” partially structured intermediate accumulates maximally in 5% (w/v) of trichloroacetate. Urea-induced unfolding and limited proteolytic digestion data reveal that the partially structured intermediate is significantly less stable than the native conformation. 1H-15N chemical shift perturbation data obtained using NMR spectroscopy indicate that interactions stabilizing the β-strands at the N- and C- terminal ends (of aFGF) are disrupted in the trichloroacetate-induced “MG-like” state. The results of the study clearly demonstrate that TCA-induced protein precipitation occurs due to the reversible association of the “MG-like” partially structured intermediate state(s). In our opinion, the findings of this study provide useful clues toward development of efficient protocols for the isolation and analysis of the entire proteome.
Keywords: protein precipitation, NMR spectroscopy, molten globule-like state(s), protein isolation, proteomics, fibroblast growth factors
Introduction
Genomic knowledge has vastly increased with advent of sophistication in methods used in proteomic analysis.1–3 Two-dimensional gel electrophoresis is the most powerful technique that is routinely used for protein separation and downstream proteomic analysis.4 One of the critical factors governing the success of proteomic analysis is the quality of the sample, which in turn is dependent on the protein extraction protocol(s) used.5,6 An ideal protein extraction procedure should reproducibly trap the most comprehensive repertoire of proteins possible with no or very minimal degradation and contamination by nonproteinaceous compounds.7,8 This is a daunting task because proteins not only have wide array of physicochemical properties like size, charge, hydrophobicity, but also show significant difference in their subcellular localization.9,10 In this background, it is a challenging task to design a generic extraction method to analyze the entire proteome.
A number of protocols have been described to capture the full proteome.11–13 However, 2,2,2-trichloroacetic acid (TCA)-induced protein precipitation is the most popular and preferred method for sample preparation for proteome analysis.14–17 Despite its extensive use, the molecular mechanism underlying TCA-induced precipitation has remained elusive. In the 1960s, Charles Tanford18 proposed that TCA forces protein to precipitate by sequestering the protein-bound water. Subsequently, several other studies suggested that the acidic nature of TCA is important for the conformational changes that trigger protein precipitation.19–21 However, the mechanism by which TCA precipitates proteins is not clearly understood. In this context, in this study, we make an attempt to provide a comprehensive understanding of the mechanism underlying the TCA-induced protein precipitation. In our opinion, the mechanism proposed in this study will provide valuable clues for the development of efficient protocols to capture the entire proteome.
Results and Discussion
TCA-induced protein precipitation
The protein precipitation effects of TCA were studied on four proteins [lysozyme, acidic fibroblast growth factor (aFGF), carbonic anhydrase, and bovine serum albumin] with varying isoelectric points and molecular masses. The amount of protein precipitate formed in different concentrations of TCA (0–90% w/v) was monitored using SDS-PAGE and by measuring protein absorbance at 280 nm [Fig. 1A–C)]. Protein precipitation curves obtained by monitoring the intensity of the Coomassie-stained protein bands on SDS gels are bell-shaped [Fig. 1(B)]. As expected, the precipitation profiles obtained based on absorbance (at 280 nm), of protein(s) remaining in solution, (after TCA precipitation) are U-shaped [Fig. 1(C)]. The shapes of the protein precipitation curves do not seem to be dependent on the physico-chemical properties of the proteins. In general, the TCA-induced protein precipitation curves can be broadly classified in to three different phases. In the first phase (Phase 1), which occurs below 5% w/v TCA, increase in the acid concentration results in a progressive increase in the amount of protein precipitated [Fig. 1(B)]. The flat portion of the curve (Phase 2), observed in the TCA concentration range of 5–45% w/v, represents the maximum amount of protein precipitated [Fig. 1(B)]. Increase in the TCA concentration(s), beyond 45% w/v (Phase 3), results in a sharp decrease in the amount of protein precipitated, and practically very little or no precipitate is observed beyond 60% w/v TCA [Fig. 1(B,C)]. It should be important to mention that the percentage of protein(s) precipitated in various concentrations of TCA is independent of the protein concentration (in the range of 5 to 250 μM) used. In summary, these results clearly suggest that the TCA-induced precipitation profiles are independent of the native conformation of proteins. Several questions arise based on the observed results as follows: (1) What physico-chemical properties of TCA are important for its protein precipitation activity?; (2) Can TCA precipitate proteins in their unfolded/disordered conformation(s)?; (3) What is the conformational status of the proteins in various concentrations of TCA?; and (4) What is the general mechanism underlying TCA-induced protein precipitation? In this study, we address these questions using aFGF as a model protein, and attempt to provide a comprehensive understanding of the molecular mechanism underlying the action of TCA on proteins.
Figure 1.
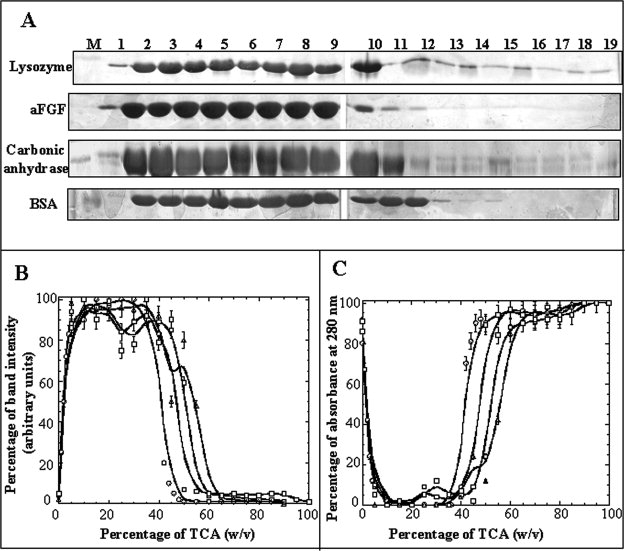
Panel (A) SDS-PAGE analysis of the TCA-induced precipitation of lysozyme, aFGF, carbonic anhydrase, and BSA. Lane: M, Marker; 1, 0% w/v TCA; 2, 5% w/v TCA; 3, 10% w/v TCA; 4, 15% w/v TCA; 5, 20% w/v TCA; 6, 25% w/v TCA; 7, 30% w/v TCA; 8, 35% w/v TCA; 9, 40% w/v TCA; 10, 45% w/v TCA; 11, 50% w/v TCA; 12, 55% w/v TCA; 13, 60% w/v TCA; 14, 65% w/v TCA; 15, 70% w/v TCA; 16, 75% w/v TCA; 17, 80% w/v TCA; 18, 85% w/v TCA; and 19, 90% w/v TCA, respectively. Panel (B)The percentage of TCA-induced protein precipitation of lysozyme (open circle), aFGF (filled square), carbonic anhydrase (open square), and BSA (open triangle) was measured based on the intensity (after Coomassie blue staining) of the bands of the corresponding proteins on the polyacrylamide gel. Panel (C) The percentage of protein present in the supernatant of lysozyme (open circle), aFGF (filled square), carbonic anhydrase (open square), and BSA (open triangle) were measured based on the absorbance at 280 nm.
Effect of TCA on denatured proteins
Recent studies show that a significant percentage of proteins in the eukaryotic proteome are intrinsically disordered.22,23 It is believed that presence of high proportion of unstructured/disordered proteins in eukaryotes is related to the increased prevalence of signaling and regulation coupled with the fact that signaling functions are enriched in disorder.24 Typically, intrinsically disordered proteins exhibit high-solubility even under extreme conditions due to the presence of large proportion of charged residues and extended backbone structure.25,26 In this background, it will be interesting to examine the effectiveness of TCA to precipitate proteins in their completely denatured state(s).
aFGF is a ∼16 kDa β-barrel protein, containing a single tryptophan residue at position 121 of its amino acid sequence.27,28 Interestingly, despite the presence of the lone tryptophan, the fluorescence spectrum of aFGF, in its native state, is dominated by tyrosine emission at 308 nm [Fig. 2(A), inset].29 The fluorescence of the lone tryptophan is quenched by the presence of positively charged residues at close proximity in the native structure of aFGF.30 This quenching effect is relieved in the denatured state of aFGF, and the typical tryptophan fluorescence at 350 nm is observed [Fig. 2(A), inset]. Urea-induced equilibrium unfolding of aFGF, monitored by changes in the intrinsic tryptophan florescence, shows that the majority of the protein exists in the native conformation at denaturant (urea) concentrations lower than 1M [Fig. 2(A)]. The unfolding profile shows that protein unfolds completely at urea concentrations greater than 2.8M [Fig. 2(A)]. In this context, we examined the precipitation effects of TCA on aFGF dissolved in 6M urea [Fig. 2(B)]. The TCA precipitation profile of aFGF, monitored using SDS PAGE, is also bell-shaped [Fig. 2(C)]. However, the maximum percentage of protein precipitated, in the TCA concentration range of 15–45% w/v, is only about 70% [Fig. 2(C)]. Similar trends were observed using lysozyme (Supporting Fig. S1), suggesting that the TCA is less efficient in precipitation proteins in their denatured states. In this context, it would be of interest to note that Cortese et al.,31 observed that unstructured proteins in E. coli have a lower tendency to precipitate in TCA. In addition, thermally unfolded aFGF also showed a decreased tendency to precipitate in TCA suggesting that the lower amounts of protein precipitation observed in 6M urea is not due to the interference of the denaturant in the TCA-induced precipitation reaction (data not shown). These results clearly suggest that unfolded/denatured proteins have a lower tendency to precipitate in TCA.
Figure 2.
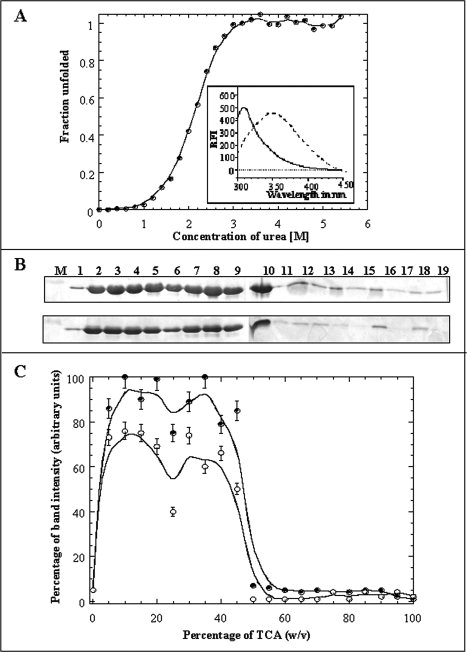
Panel (A) Fraction of unfolded species of the aFGF formed at various concentrations of urea. The unfolding profile was monitored by the changes in the emission intensity at 350 nm. The Cm value for the urea-induced unfolding of the aFGF, estimated from the fluorescence experiments, is 2.1 ± 0.05M. The inset shows the emission spectra of the aFGF in native (continuous line) and denatured (dotted line) in 6M urea. Panel (B) SDS-PAGE analysis of the TCA-induced precipitation of aFGF in 0M urea and in presence of 6M urea. Lane: M, Marker; 1, 0% w/v TCA; 2, 5% w/v TCA; 3, 10% w/v TCA; 4, 15% w/v TCA; 5, 20% w/v TCA; 6, 25% w/v TCA; 7, 30% w/v TCA; 8, 35% w/v TCA; 9, 40% w/v TCA; 10, 45% w/v TCA; 11, 50% w/v TCA; 12, 55% w/v TCA; 13, 60% w/v TCA; 14, 65% w/v TCA; 15, 70% w/v TCA; 16, 75% w/v TCA; 17, 80% w/v TCA; 18, 85% w/v TCA; and 19, 90% w/v TCA, respectively. Panel (C) The percentage of protein precipitated in the presence of different concentrations of urea, 0M urea- closed circle, 6M urea- open circle, was measured based on the intensity (after Coomassie blue staining) of the ∼16 kDa protein band (on the polyacrylamide gel).
Recovery of native conformation of protein precipitated by TCA
It is important to understand if proteins precipitated by TCA can be completely recovered in solution in their native conformation. To examine this aspect, aFGF precipitated using 30% w/v TCA was redissolved in 10 mM tris buffer (pH 7.5) containing different concentrations of sodium bicarbonate. The nativity of aFGF recovered in solution from the TCA precipitate was measured using the ratio of emission at 308 and 350 nm. The 308/350 nm emission ratio for aFGF in its native conformation is ∼4.8 [Fig. 2(A), inset]. In contrast, the 308–350 nm ratio of aFGF extracted in 10 mM tris (pH 7.5) was only about ∼0.66, suggesting that only 20% of the protein is recovered in the native conformation. Size-exclusion chromatography profile of aFGF extracted in 10 mM tris (pH 7.2), showed a peak (retention time ∼82 min) corresponding to the native conformation, and several other peaks with shorter retention times [Fig. 3(B)]. Extrapolation of the observed retention times to the standard plot (obtained using proteins of known molecular weights), reveals that peaks with retention times of ∼37 min and 42 min possibly correspond to dimeric and trimeric forms of aFGF, respectively. However, it should be mentioned that some of the fractions obtained on size exclusion chromatography may represent misfolded species of aFGF. Interestingly, the recovery of the protein in the native conformation significantly increased with the inclusion of sodium bicarbonate in 10 mM tris buffer (pH 7.5). The 308/350 nm emission ratio reached a maximum value (∼3.6) when the extraction was performed in 10 mM tris containing 500 mM sodium bicarbonate [Fig. 3(A)]. Size exclusion chromatogram of the protein sample extracted in 500 mM bicarbonate showed only a major peak (retention time ∼81) corresponding to the native conformation of aFGF [Fig. 3(B)]. The broad minor peak (with an average retention time of ∼40 min) observed in the FPLC profile possibly represents the population of oligomeric species formed in the TCA-induced protein precipitate. Bicarbonate ion possibly appears to reverse the precipitation action of TCA by neutralizing the residual acidic trichoroacetate ions remaining (bound to the protein precipitate) even after extensive washing with acetone. The results discussed so far clearly suggest that TCA-induced protein precipitation is a reversible association reaction.
Figure 3.
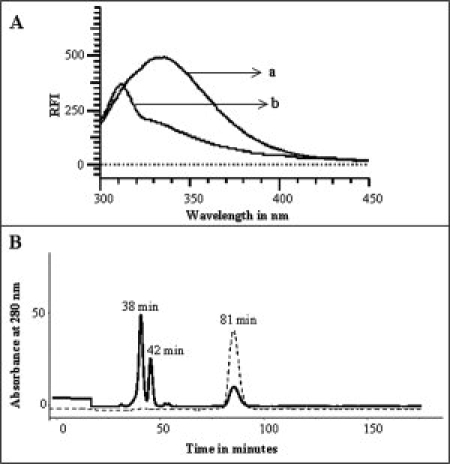
Panel (A) Fluorescence spectrum of aFGF, (a) extracted in 10 mM tris (pH 7.5), and (b) extracted in 10 mM tris (pH 7.5) containing 500 mM sodium bicarbonate. Panel (B) Size exclusion chromatography of aFGF extracted with 10 mM tris (pH 7.5) (continuous line), and with 10 mM tris (pH 7.5) containing 500 mM sodium bicarbonate (dotted line). Elution of the protein was monitored by its absorbance at 280 nm. The flow rate of elution was 1 mL/min at 25°C.
Role of the trichloroacetate group in protein precipitation
The precipitation efficiency of various halogenated derivatives of acetic acid was examined to understand the role of the trichloroacetate moiety in inducing protein precipitation [Fig. 4(A)]. Protein precipitation profiles obtained in different acids revealed that acetic acid and chloroacetic acid did not significantly precipitate aFGF. However, dichloroacetic acid is about half as efficient as trichloroacetic acid in precipitating aFGF. These results suggest that the trichloroacetate moiety is important for protein precipitation. Tricholoacetic acid is the most acidic of the all the choloroacetic acids used. Therefore, it can be argued that the protein precipitation is not specific to TCA, but in principle can be achieved using any strong acid. In this context, the protein precipitating action of acids stronger than TCA such as, trifluoroacetic acid, tribromoacetic acid, perchloric acid, and hydrochloric acid were examined. Hydrochloroacetic acid did not precipitate aFGF in the concentration range 0–90% v/v [Fig. 4(A)]. Trifluoroacetic acid (TFA), trobromoacetic acid (TBA), and perchloric acid (PA) precipitated aFGF. However, the maximum amount of protein precipitated in TFA was significantly lower than that observed using TCA [Fig. 4(B)]. Of these acids, only TFA showed a strong tendency to cleave the protein [Fig. 4(A)]. These results clearly suggest that the acid nature of TCA does not solely contribute to its protein precipitation property [Fig. 4(B)]. We studied the protein precipitation action of sodium trichloroacetate under neutral conditions (dissolved in 100 mM phosphate buffer, pH 7.2) to understand the relative contribution(s) of the trichloroacetate moiety in protein precipitation. No precipitate was observed immediately after addition of STCA in the concentration range of 0–90% w/v. However, protein solutions containing 15–30% STCA turned mildly turbid after 4 h of incubation at room temperature. SDS-PAGE of the precipitate formed in STCA showed that a maximum of 25% of the protein (aFGF) was precipitated in 20% w/v STCA. These results suggest that acidic property of TCA and the trichloroacetate moiety are both important for inducing protein precipitation.
Figure 4.
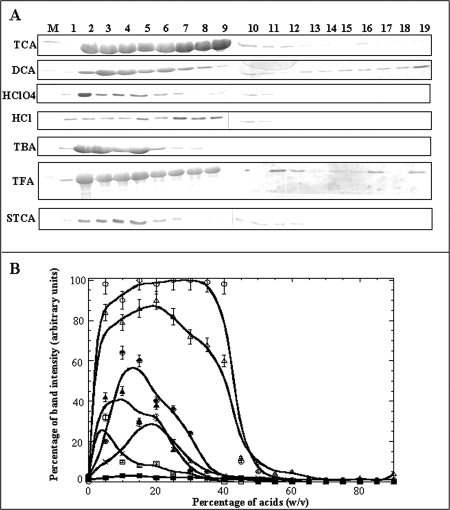
Panel (A) SDS-PAGE analysis of the precipitate of aFGF formed in different acids. Lane: M, Marker; 1, 0% w/v; 2, 5% w/v; 3, 10% w/v; 4, 15% w/v; 5, 20% w/v; 6, 25% w/v; 7, 30% w/v; 8, 35% w/v; 9, 40% w/v; 10, 45% w/v; 11, 50% w/v; 12, 55% w/v; 13, 60% w/v; 14, 65% w/v; 15, 70% w/v; 16, 75% w/v; 17, 80% w/v; 18, 85% w/v; and 19, 90% w/v. Panel (B) The percentage of protein precipitated in TCA (open circle), dichloroacetic acid (filled circle), perchloric acid (open square), hydrochloric acid (filled square), tribromoacetic acid (filled triangle), trifluoroacetic acid (open triangle), and sodium trichloroacetate (X), was measured based on the intensity (of the Coomassie blue stained) of the ∼16 kDa protein band (on the polyacrylamide gel).
Structural transitions induced by STCA
As mentioned earlier, STCA mimics the protein precipitation action of TCA. Size exclusion chromatography profile of the 5% w/v STCA-induced precipitate of aFGF, extracted in 10 mM tris (pH 7.2), showed three prominent peaks corresponding to molecular masses expected for the monomer, dimer, and trimer of the protein (Supporting Fig. S2). However, only a single peak corresponding to the monomer of aFGF was observed when the STCA-induced protein precipitate was dissolved in 10 mM tris (pH 7.2) containing 500 mM sodium bicarbonate (Supporting Fig. S2). These results clearly suggest that STCA (like TCA) induced protein precipitation involves the reversible association of protein molecules.
Unlike TCA, precipitation of proteins in STCA is not instantaneous. It takes more than 3 h before the protein solution turns turbid. The slow precipitation of proteins and the near-neutral nature of STCA provides an avenue to probe the structural transitions that precede the precipitation of proteins induced by TCA.
Secondary structural changes induced by STCA
The secondary structural elements in aFGF include 12 beta strands arranged into a β-trefoil motif. Far UV circular dichroism (CD) spectrum of aFGF in its native conformation shows a strong positive ellipticity band (between 225 and 230 nm) typical of β-barrel proteins [Fig. 5(A)]. The ellipticity band intensity (at 228 nm) progressively decreases with the increase in STCA concentration, suggesting progressive unfolding of the protein. Minimal changes in the ellipticity occur beyond 20% STCA, and the far UV CD spectrum of aFGF in 50% w/v STCA is reminiscent of random coil conformation [Fig. 5(A)]. These results show that STCA is a protein denaturant, and the unfolding of aFGF is complete in concentrations of STCA greater than 20% w/v [Fig. 5(B)].
Figure 5.
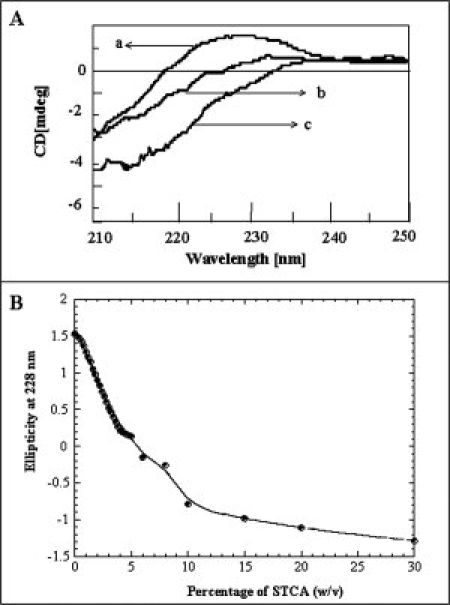
STCA-induced secondary structural changes in aFGF monitored by far-UV CD. Panel (A) shows the far- UV CD spectra of aFGF at different concentrations of STCA. (a) 0% w/v STCA, (b) 5% w/v STCA, and (c) 50% w/v STCA. Panel (B) Plot of ellipticity (at 228 nm) versus concentration of STCA.
Unfolding of aFGF involves the formation of a stable equilibrium intermediate
ANS is a hydrophobic dye that is routinely used to detect the accumulation of stable intermediates in the unfolding/refolding pathways of proteins. The dye exhibits weak binding to both the native and extensively unfolded states of proteins.19,20 However, it binds quite strongly to solvent-accessible hydrophobic pockets in stable intermediates such as the “molten globule” state(s).20 In this context, the binding affinity of aFGF to ANS was monitored at different concentrations of STCA (0–90% w/v) [Fig. 6(A)]. The protein in the absence of STCA shows weak emission at 520 nm. Interestingly, the emission intensity of the dye on binding to aFGF in 5% w/v STCA is twice that observed in the native state of the protein (in 0% STCA). In addition, the wavelength of maximum emission of the dye shifts by about 10 nm from 506 nm to 496 nm when the protein is treated with 5% w/v STCA. Further increase in the STCA concentration not only results in a progressive decrease in ANS intensity at 520 nm but also is accompanied by a continuous red shift in the wavelength of maximum emission of the dye. aFGF exhibits weak binding affinity to the dye in its unfolded state(s) in STCA concentrations greater than 20% w/v [Fig. 6(A)]. These results clearly demonstrate that unfolding of aFGF in STCA proceeds with the accumulation of an intermediate state(s) resembling the molten globule (MG). It is important to mention that such partially unfolded intermediate(s) also accumulate in the STCA-induced unfolding pathway of other proteins, such as lysozyme (Supporting Fig. S1-panel D).
Figure 6.
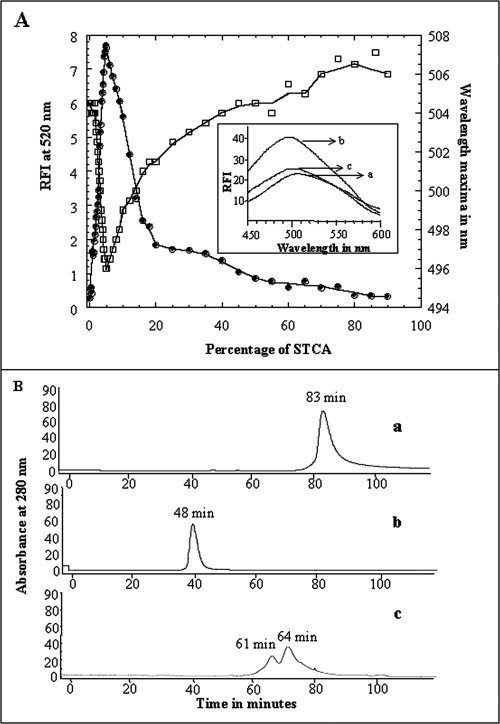
Panel (A) Binding of ANS to aFGF at various concentrations of STCA. Changes in the emission intensity at 520 nm and the shift in wavelength emission maximum on ANS are represented in closed and open circles, respectively. The inset figure shows the emission spectra of the aFGF at different concentrations of STCA. (a) 0% w/v STCA, (b) 5% w/v STCA, and (c) 50% w/v STCA. Panel (B) Size exclusion chromatography of aFGF, (a) in the native conformation (0% STCA), (b) in the denatured state(s) in 50% w/v STCA, and (c) in the “MG”-like state in 5% w/v STCA. Elution of the protein was monitored by its absorbance at 280 nm. The flow rate of elution was 1 mL/min. The concentration of the protein used in the experiment was ∼0.5 mg/mL. Elution of the protein (at 25°C) was carried out using 10 mM phosphate buffer containing 100 mM NaCl.
Size-exclusion chromatography (SEC) is a valuable technique to obtain information on the conformational changes that occur during the unfolding of proteins.32 SEC is an inert technique and is not known to perturb the equilibrium between the native, intermediate, and denatured states of proteins.32 In this context, the relative population of the various conformational states of aFGF, that may exist under various STCA concentrations, were monitored by SEC. aFGF, in its native conformation (at pH 7.0), elutes as a single peak with an elution time of 83 ± 1.0 min [Fig. 6(B-a)]. However, aFGF in the denatured state(s), in 50% (w/v) STCA, elutes relatively earlier (elution time ∼48 min) than in the native conformation [Fig. 6(B-b)]. Two closely eluting peaks at ∼61 min and ∼64 min were observed in 5% w/v STCA. These closely eluted peaks possibly represent the population of molecules in the compact, partially unfolded states [Fig. 6(B-c)]. Peaks representing the native (elution time, 85 ± 0.5 min) and denatured states (elution time, 48 ± 0.5 min) of aFGF were not observed in the elution profile obtained at 5% (w/v) STCA [Fig. 6(B-c)]. It is surprising to find that the elution times of the peaks representing the partially unfolded states of aFGF (at 5% (w/v) STCA) are longer than that observed for the denatured states in 50% (w/v) STCA. It is not unreasonable to conceive that the observed longer elution times of the aFGF fractions are due to the highly compact nature of the partially unfolded stable intermediate states that accumulate in 5% w/v STCA. The results of the ANS binding and the SEC experiments analyzed in conjunction, clearly suggest that a MG-like intermediate state(s) maximally accumulates in 5% (w/v) STCA.
The intermediate state has higher conformational flexibility
Proteins in the MG state(s) generally have persistent native secondary structural interactions and higher flexibility of the side chains due to loss in some tertiary structural interactions.33 Limited proteolytic digestion is an immensely useful technique to probe gross conformational flexibility of proteins in various conformational states.34 In general, proteolytic digestion is not only dependent on the stereochemistry and accessibility of the protein substrate but also on the specificity of the proteolytic enzyme. Therefore, subtle conformational changes that occur in a protein during equilibrium unfolding/refolding can be easily monitored by the limited proteolytic digestion technique. Owing to the high content of arginine and lysine residues in aFGF, we opted to probe the conformational flexibility of the partially structured intermediate state(s) that accumulates in 5% (w/v) STCA. Time-dependent trypsin digestion of the proteins in their native (at pH 7.0) and partially unfolded (in 5% (w/v) STCA) states of aFGF was monitored by SDS-PAGE analysis. Undigested aFGF yields a band on SDS-PAGE, which corresponds to a molecular mass of about 16 kDa [Fig. 7(A)]. The intensity of this band (after Coomassie Blue Staining) is used as a control to monitor the degree of action of trypsin on the native and the intermediate state(s) of aFGF. In the absence of STCA, 40% of the band corresponding to undigested aFGF remains after 10 min of incubation with trypsin [Fig. 7(B)]. However, in the partially unfolded state(s) induced in 5% w/v STCA, band representing the intact aFGF molecule completely disappears within 5 min of incubation of the protein with trypsin [Fig. 7(A,B)]. These results reveal that aFGF in 5% w/v STCA is highly susceptible to proteolysis implying increased conformational flexibility of the protein in the intermediate state(s).
Figure 7.
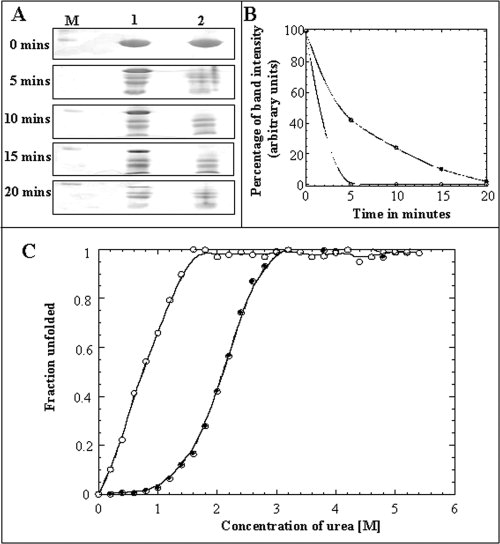
Panel (A) SDS-PAGE analysis of the limited trypsin digestion products of aFGF in the native and in the “MG”- like state(s) in 5% w/v STCA. Lane M shows the molecular weight marker. The Lane-1 represents the trypsin digestion products after various time periods of incubation of native aFGF with trypsin. The Lane-2 represents the trypsin digestion products after various time periods of incubation of “MG”-like state of aFGF (5% w/v STCA). Panel (B) Percentage of the ∼16 kDa aFGF band remaining after incubation with trypsin for various intervals of time. Filled and open circles represent the percentage of aFGF (∼16 kDa band) cleaved in the native (in 0% STCA) and “MG-like” (in 5% w/v STCA) states, respectively. The percentage of undigested aFGF was estimated from the intensity of the 16 kDa Coomassie blue stained band in the polyacrylamide gel. Panel (C) Urea-induced equilibrium unfolding profile of aFGF, native state (filled circle) and in “MG”- like state in 5% w/v of STCA (open circle).
Stability of the STCA-induced partially structured state of aFGF
Urea-induced equilibrium unfolding of aFGF in 5% w/v STCA was monitored by steady-state fluorescence. The protein in 5% STCA unfolds completely in urea concentrations greater than ∼1.8M [Fig. 7(C)]. The concentration of urea required for 50% of the aFGF molecules (in 5% w/v STCA) to exist in the unfolded state(s) (Cm) is ∼1.2M. The absence of the preunfolding baseline (in the unfolding curve obtained using relative fluorescence intensity at 350 nm) precludes the accurate estimation of the parameters of unfolding. The lower stability of the STCA-induced “MG-like” intermediate is consistent with the loss of native tertiary structural interactions in the partially structured state.
Perturbed regions in the partially unfolded state(s)
The 1H-15N HSQC spectrum is a fingerprint of the backbone conformation of a protein under given experimental conditions.351H-15N HSQC of aFGF in 0% (w/v) STCA is well-dispersed indicating that the protein is well-structured in its native conformation [Fig. 8(A)]. NMR resonance assignments of aFGF in its native conformation are available, and therefore structural changes that occur as a function of increasing concentrations of STCA can be conveniently monitored based on the 1H-15N chemical shift perturbation observed in the 2D 1H-15N HSQC spectra. Many cross-peaks show significant chemical shift perturbation and some disappeared in the 1H-15N HSQC spectrum of the aFGF acquired in 5% w/v STCA [Fig. 8(A)]. In general, the decrease in cross-peak intensity of selective residues is ascribed to faster internal mobilities of residues in the flexible regions of the protein molecule. Cross-peaks corresponding to Cys30, His35, Ile56, Leu86, Asn114, Lys115, Trp121, Phe122, Lys126, Lys132, Gly134, and Tyr139 completely disappeared in the 1H-15N HSQC spectrum of aFGF obtained in 5% (w/v) STCA [Fig. 8(B)]. Cross-peaks of some other residues corresponding to Leu28, Tyr29, Val45, Ser72, Meth81, Leu98, Lys115, Trp121, Lys126, Lys132, Gln141, Ala143, Ile144, Leu145, Phe146, Lys148, and Leu149 show significant 1H-15N chemical shift perturbation [Fig. 8(C)]. These residues are mostly located in β-strand I, β-strand II, β-strand VIII, and the loop connecting β-strands VIII and IX, and β-strand XI [Fig. 8(D)]. The HSQC spectra of aFGF acquired beyond 10% w/v STCA show limited chemical shift dispersion and are typical of denatured states of proteins (date not shown). The NMR data unambiguously show that several interactions stabilizing the native conformation of aFGF are disrupted in the partially structured state(s) that accumulates in 5% STCA.
Figure 8.
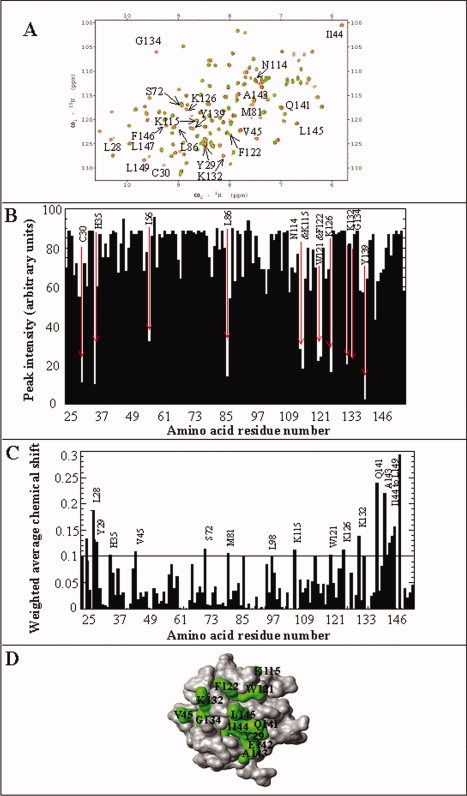
Panel (A) Overlap of 1H-15N HSQC spectrum of aFGF in absence (red) and presence of 5% w/v STCA (green). Panel (B) 1H-15N chemical shift perturbation of residues in aFGF in the presence of 5% w/v STCA. The amino acid residues in aFGF that showed significant chemical shift perturbation and involved in STCA binding are indicated by their single letter codes. Panel (C) Crosspeak intensity of residues in the 1H-15N HSQC spectrum of aFGF obtained in the presence of 5% w/v STCA. The crosspeaks that show significant decrease in their intensities represent the STCA binding sites. Panel (D) MolMol representation of the structure of aFGF (grey). Residues that show significant decrease in intensity and chemical shift perturbation in presence of 5% w/v STCA are depicted in green.
Mechanism underlying TCA-induced protein precipitation
Results of this study clearly demonstrate that TCA-induced protein precipitation is independent of the size and nature of proteins. The trichloro moiety is important for its protein precipitation capability of TCA. In addition, TCA appears to be less effective in precipitating proteins in the disordered/unfolded state(s). This observation is of immense significance because about 30% of proteins in the eukaryotic proteome are predicted to be disordered/unstructured.25 A large proportion of these intrinsically disordered proteins participate in cell signaling and regulation. It is believed that the high prevalence of disordered proteins in eukaryotes is related to intense signaling and regulatory activities take place in these organisms.24 Analyses of proteomes generally involve TCA-precipitation prior to detection of proteins on 2D gels. In this context, the lower tendency of unstructured/disordered proteins to precipitate in TCA can result in failure to detect a number of intrinsically disordered proteins that play crucial roles in cell signaling and regulation.
This study represents an attempt to provide a comprehensive understanding of the general mechanism(s) underlying the TCA-induced protein precipitation. At low concentrations, the negatively charged tricholoroacetate ions plausibly trigger protein unfolding by disrupting the electrostatic interactions that stabilize the native conformation of proteins. Partial unfolding of proteins results in the exposure of solvent-accessible nonpolar surface(s), and which consequently results in intermolecular coalescence of protein molecules leading to their precipitation. The partially structured state(s) that accumulates in low trichloroacetate concentrations (5% w/v STCA/TCA) closely resembles the acid intermediate (A-state) identified in several proteins.36 The A-states are generally very sticky and show a high-tendency to irreversibly aggregate.36,37 However, in marked contrast, the trichloroacetate-induced precipitate is a reversible association of proteins in their partially structured intermediate state(s).
The partially structured intermediate accumulated in 5% w/v STCA/TCA is largely responsible for the protein precipitation reaction. Such precipitation-competent intermediate(s) plausibly do not accumulate in the unfolding pathway(s) of some of other acids, and therefore these acids are unable to mimic the protein-precipitation action of TCA. The potency of an acid to precipitate proteins appears to depend not only on the nature of the anion but also on its ability to stabilize the precipitation-competent intermediate(s). In this context, it should be of interest to note that anions have been shown to exhibit significantly different effects on A-state stability.31
In our opinion, the findings of this study are expected to pave way for the development of more efficient protein extraction and sample preparation protocols, which are a prerequisite for reliable proteomic analysis.
Materials and Methods
Ingredients for Luria Broth were obtained from AMRESCO. Hen egg-white lysozyme, BSA, carbonic anhydrase TCA, acetic acid, monocholroacetic acid, dichloroacetic acid, trichloroacetic acid, tribromoacetic acid, hydrochloric acid, perchloroacetic acid, trypsin, aprotinin, pepstatin, leupeptin, phenylmethylsulfonyl fluoride, Triton X-100, and β-mercaptoethanol were obtained from Sigma Co. (St. Louis). Heparin-sepharose was obtained from Amersham Pharmacia Biotech. Labeled 15NH4Cl and D2O were purchased from Cambridge Isotope Laboratories. All other chemicals used were of high-quality analytical grade. All experiments were performed at 25°C. Unless specified, all solutions were prepared in 10 mM phosphate buffer (pH 7.0) containing 100 mM NaCl.
Expression and purification of aFGF
Recombinant aFGF was prepared from transformed Escherichia coli BL21(DE3)pLysS. The expressed proteins were purified on a heparin-sepharose affinity column over a NaCl gradient (0–1.5M). Desalting of the purified protein was achieved by ultrafiltration using an Amicon set-up. The purity of the protein was assessed using SDS-PAGE. The authenticity of the truncated sample was verified by ES-Mass analysis. The concentration of the protein was estimated based on the extinction coefficient value of the protein at 280 nm.
Preparation of isotope-enriched aFGF
Uniform 15N labeling aFGF was achieved using M9 minimal medium containing 15NH4Cl. To realize maximal expression yields, the composition of the M9 medium was modified by the addition of a mixture of vitamins. The expression host strain E. coli BL21(DE3)pLysS is a vitamin B1-deficient host and hence the medium was supplemented with thiamine (vitamin B1). Protein expression yields were in the range of 25–30 mg/L of the isotope-enriched medium. The extent of 15N labeling was verified by ES-Mass analysis.
Treatment with acids
The proteins, aFGF, and lysozyme were treated with TCA and other acids using the method of Sagar et al.38 Protein solutions containing appropriate concentrations of the respective acids were prepared by the addition of requisite amounts of the stock solutions of the individual acids to aqueous solutions of proteins. The acid(s) treated proteins solutions were incubated at 25°C for 1 h. The precipitated proteins samples were pelleted down by centrifugation at 12,000 rpm for 20 min. The precipitated products of the reaction were analyzed by SDS-PAGE. Protein concentrations in the supernatant were determined using the respective molar extinction coefficients of the proteins at 280 nm. All the UV spectrophotometric measurements were carried out on a Hitachi-3300 spectrophotometer.
Steady-state fluorescence measurements
All fluorescence spectra were collected on a Hitachi F-2500 spectrofluorometer at 2.5 nm resolution, using an excitation wavelength of 280 nm. Fluorescence measurements were made at a protein concentration of 0.1 mg/mL in 10 mM phosphate buffer containing 100 mM NaCl. Blank corrections were made in all of the spectra using 10 mM phosphate buffer containing 100 mM NaCl.
ANS binding experiments
1-anilino-8-naphthalene-sulfonate (ANS) binding experiments at various percentage of STCA (w/v) were performed using a Hitachi F-2500 spectrofluorimeter at 25°C. Fluorescence spectra were acquired using an excitation wavelength of 390 nm and an emission wavelength of 400–600 nm. All protein samples were prepared in 10 mM phosphate buffer (pH 7.0) containing 100 mM NaCl. Final spectra were obtained after correcting for the background fluorescence of ANS.
Urea-induced equilibrium unfolding
Urea-induced equilibrium unfolding, under various conditions, was monitored by intrinsic tryptophan fluorescence. For the unfolding experiments, protein samples were dissolved in appropriate concentrations of urea prepared in 10 mM phosphate buffer (pH 7.0) containing 100 mM NaCl. Necessary background corrections were made in all spectra.
Circular dichroism
The acid-induced denaturation experiments were monitored by far-UV CD (at 228 nm) spectroscopy (AVIV-215 spectropolarimeter) at 25°C. Protein samples were prepared in 10 mM phosphate containing 100 mM NaCl. Blank corrections were made in all the spectra using 10 mM phosphate buffer containing 100 mM NaCl and respective concentrations of STCA.
Size-exclusion chromatography
All gel filtration experiments were carried out at various pH (at 25°C) on a superdex-75 column using an AKTA FPLC device (Amersham Pharmacia Biotech). The column was equilibrated with two-bed volumes of the buffer (10 mM phosphate buffer containing 100 mM of NaCl) at the appropriate concentration of STCA (w/v). The flow rate of the eluent was set at 1 mL/min. Protein peaks were detected by their 280 nm absorbance. The concentration of the protein used was about 0.5 mg/mL.
Proteolytic digestion assay
Digestion experiments were carried out by independently incubating aFGF in the presence of trypsin in 5% (w/v) STCA (at 1:1 protein to trypsin molar ratio) dissolved in 10 mM phosphate buffer containing 100 mM NaCl. The protease action was stopped by heating the mixture (protein + trypsin) at 90°C for 10 min. The products of the protease reaction were analyzed by SDS-PAGE analysis. The degree of cleavage was measured by estimating the intensity of the band (on poly-acrylamide gel) corresponding to aFGF at ∼16 kDa (remaining after trypsin digestion) using a scanning densitometer. The intensity of the bands corresponding to the untreated aFGF was considered as a control for 100% protection against trypsin action.
NMR experiments
All NMR experiments were performed on a Bruker Avance-700 MHz NMR spectrometer equipped with a cryoprobe at 25°C. 15N decoupling during data acquisition was accomplished using the globally optimized altering phase rectangular pulse sequence, and 2048 complex data points were collected in the 15N dimension. 1H-15N HSQC spectra were recorded at 64 scans at different pH values. The concentration of the protein sample used was 0.1 mM in 90% H2O and 10% D2O prepared in 10 mM phosphate buffer containing 100 mM NaCl. The spectra were processed on a Windows workstation using Xwin-NMR and Sparky softwares.39
Glossary
Abbreviations:
- AA
acetic acid
- aFGF
acidic fibroblast growth factor
- ANS
1-anilino-8-napthalene sulfonate
- BSA
bovine serum albumin
- CD
circular dichroism
- HCl
hydrochloric acid
- HSQC
heteronuclear single quantum coherence
- NMR
nuclear magnetic resonance
- SDS-PAGE
sodium dodecyl sulfate polyacrylamide gel electrophoresis
- SEC
size exlcusion chromatography
- STCA
sodium trichloroacetate
- TCA
2,2,2-trichloroacetic acid.
References
- 1.Hsieh SY, Zhuang FH, Wu YT, Chen JK, Lee YL. Profiling the proteome dynamics during the cell of human hepatoma cells. Proteomics. 2008;8:2872–2884. doi: 10.1002/pmic.200800196. [DOI] [PubMed] [Google Scholar]
- 2.Groen AJ, de Vries SC, Lilley KS. A proteomics approach to membrane trafficking. Plant Physiol. 2008;147:1584–1589. doi: 10.1104/pp.108.123448. [DOI] [PMC free article] [PubMed] [Google Scholar]
- 3.de Roos B, Duthie SJ, Polley AC, Mulholland F, Bouwman FG, Heim C, Rucklidge GJ, Johnson IT, Mariman EC, Dnaiel H, Elliott RM. Proteomic methodological recommendations for studies involving human plasma, platelets, and peripheral blood mononuclear cells. J Proteome Res. 2008;7:2280–2290. doi: 10.1021/pr700714x. [DOI] [PubMed] [Google Scholar]
- 4.Weist S, Eravci M, Broedel O, Fuxius S, Eravci S, Baumgartner A. Results and reliability of protein quantification for two-dimensional gel electrophoresis strongly depend on the type of protein sample and the method employed. Proteomics. 2008;8:3389–3396. doi: 10.1002/pmic.200800236. [DOI] [PubMed] [Google Scholar]
- 5.Isaacson T, Damasceno CM, Saravanan RS, He Y, Catala C, Saladie M, Rose JK. Sample extraction techniques for enhanced proteomic analysis of plant tissues. Nat Protoc. 2006;1:769–774. doi: 10.1038/nprot.2006.102. [DOI] [PubMed] [Google Scholar]
- 6.Carpentier SC, Witter E, Laukens K, Deckers P, Swennen R, Panis B. Preparation of protein extracts from recalcitrant plant tissues: an evaluation of different methods for two-dimensional gel electrophoresis analysis. Proteomics. 2005;5:2497–2507. doi: 10.1002/pmic.200401222. [DOI] [PubMed] [Google Scholar]
- 7.Harder A, Wildgruber R, Nawrocki A, Fey SJ, Larser PM, Gorg A. Comparison of yeast cell protein solubilization procedures for two-dimensional electrophoresis. Electrophoresis. 1999;20:826–829. doi: 10.1002/(SICI)1522-2683(19990101)20:4/5<826::AID-ELPS826>3.0.CO;2-A. [DOI] [PubMed] [Google Scholar]
- 8.Sarnighausen E, Reski R. Plant proteomics. Methods Mol Biol. 2008;484:29–44. doi: 10.1007/978-1-59745-398-1_3. [DOI] [PubMed] [Google Scholar]
- 9.Da Cruz S, Martinou JC. Purification and proteomic analysis of the mouse liver mitochondrial inner membrane. Methods Mol Biol. 2008;432:101–116. doi: 10.1007/978-1-59745-028-7_7. [DOI] [PubMed] [Google Scholar]
- 10.Zhou J, Lin Y, Deng X, Han H, Shi W, Li Y. Development and application of a two-phase, on-membrane digestion method in the analysis of membrane proteome. J Proteome Res. 2008;7:1778–1783. doi: 10.1021/pr070526j. [DOI] [PubMed] [Google Scholar]
- 11.Wang X, Li X, Deng X, Han H, Shi W, Li Y. A protein extraction method compatible with proteomic analysis for the euhalophyte Salicornia europaea. Electrophoresis. 2008;28:3976–3987. doi: 10.1002/elps.200600805. [DOI] [PubMed] [Google Scholar]
- 12.Espagne C, Martinex A, Valot B, Minnel T, Giglione C. Alternative and effective proteomic analysis in Arabidopsis. Proteomics. 2007;7:3788–3799. doi: 10.1002/pmic.200700346. [DOI] [PubMed] [Google Scholar]
- 13.Li X, Xu S, Pan C, Zhou H, Jiang X, Zhang Y, Ye M, Zou H. Enrichment of peptides from plasma for peptidome analysis using multiwalled carbon nanotubes. J Sep Sci. 2007;30:930–943. doi: 10.1002/jssc.200600479. [DOI] [PubMed] [Google Scholar]
- 14.Nandakumar MP, Cheung A, Marten MR. Proteomic analysis of extracellular proteins from Escherichia coli W3110. J Proteome Res. 2006;5:1155–1161. doi: 10.1021/pr050401j. [DOI] [PubMed] [Google Scholar]
- 15.Jacobs DI, van Rijssen MS, van der Heijden R, Verpoorte R. Sequential solubilization of proteins precipitated with trichloroacetic acid in acetone from cultured Catharanthus roseus cells yields 52% more spots after two-dimensional electrophoresis. Proteomics. 2001;1:1345–1350. doi: 10.1002/1615-9861(200111)1:11<1345::AID-PROT1345>3.0.CO;2-F. [DOI] [PubMed] [Google Scholar]
- 16.Peterson GL. Determination of total protein. Methods Enzymol. 1983;91:51–121. doi: 10.1016/s0076-6879(83)91014-5. [DOI] [PubMed] [Google Scholar]
- 17.Sivaraman T, Kumar TKS, Jayaraman G, Yu C. The mechanism of 2,2,2-trichloroacetic acid-induced protein precipitation. J Protein Chem. 1997;16:291–297. doi: 10.1023/a:1026357009886. [DOI] [PubMed] [Google Scholar]
- 18.Tanford C. Cohesive forces and disruptive reagents. Brookhaven Symp Biol. 1964;17:154–183. [PubMed] [Google Scholar]
- 19.Kumar TKS, Subbiah V, Ramakrishina T, Pandit MW. Trichloroacetic acid-induced unfolding of bovine pancreatic ribonuclease. Existence of molten globule-like state. J Biol Chem. 1994;269:12620–12625. [PubMed] [Google Scholar]
- 20.Xu A, Xie Q, Zhou HM. Trichloroacetic acid-induced molten globule state of aminoacylase from pig kidney. J Protein Chem. 2003;22:669–675. doi: 10.1023/b:jopc.0000008732.38381.16. [DOI] [PubMed] [Google Scholar]
- 21.Ahmad A, Madhusudanan KP, Bhakuni V. Trichloroacetic acid and trifluoroacetic acid-induced unfolding of cytochrome c: stabilization of a native-like folded intermediate. Biochim Biophys Acta. 2000;1480:201–210. doi: 10.1016/s0167-4838(00)00069-8. [DOI] [PubMed] [Google Scholar]
- 22.Cortese MS, Uversky VN, Dunker KA. Intrinsic disorder in scaffold proteins: getting more from less. Prog Biophys Mol Biol. 2008;98:85–106. doi: 10.1016/j.pbiomolbio.2008.05.007. [DOI] [PMC free article] [PubMed] [Google Scholar]
- 23.Hongbo X, Slobodan V, Lilia MI, Oldfield CJ, Dunker KA, Uversky VN, Obradovic A. Functional anthology of intrinsic disorder. I. Biological processes and functions of proteins with long disordered regions. J Proteome Res. 2007;6:1882–1898. doi: 10.1021/pr060392u. [DOI] [PMC free article] [PubMed] [Google Scholar]
- 24.Radivojac P, Iakoucheva LM, Oldfield CJ, Obradovic A, Uversky VN, Dunker AK. Intrinsic disorder and functional proteomics. Biophys J. 2007;92:1439–1456. doi: 10.1529/biophysj.106.094045. [DOI] [PMC free article] [PubMed] [Google Scholar]
- 25.Dosztanyi Z, Tompa P. Prediction of protein disorder. Methods Mol Biol. 2008;426:10–15. doi: 10.1007/978-1-60327-058-8_6. [DOI] [PubMed] [Google Scholar]
- 26.Ishida T, Kinoshita K. Prediction of disordered regions in proteins based on the meta approach. Bioinformatics. 2008;24:1344–1348. doi: 10.1093/bioinformatics/btn195. [DOI] [PubMed] [Google Scholar]
- 27.Rajalingam D, Graziani I, Prudovsky I, Yu C, Kumar TKS. Relevance of partially structured states in the non-classical secretion of acidic fibroblast growth factor. Biochemistry. 2007;46:9225–9238. doi: 10.1021/bi7002586. [DOI] [PMC free article] [PubMed] [Google Scholar]
- 28.Kathir KM, Ibrahim K, Rajalingam D, Prudovsky I, Yu C, Kumar TKS. S100A13-lipid interactions-role in the non-classical release of the acidic fibroblast growth factor. Biochim Biophys Acta. 2007;1768:3080–3089. doi: 10.1016/j.bbamem.2007.09.007. [DOI] [PMC free article] [PubMed] [Google Scholar]
- 29.Chi YH, Kumar TKS, Chiu IM, Yu C. Identification of rare partially unfolded states in equilibrium with the native conformation in an all beta-barrel protein. J Biol Chem. 2002;277:34941–34948. doi: 10.1074/jbc.M205446200. [DOI] [PubMed] [Google Scholar]
- 30.Arunkumar AI, Kumar TKS, Kathir KM, Srisailam S, Wang HM, Leena PS, Chi YH, Chen HC, Wu CH, Wu RT, Chang GG, Chiu IM, Yu C. Oligomerization of acidic fibroblast growth factor is not a prerequisite for its cell proliferation activity. Protein Sci. 2002;11:1050–1061. doi: 10.1110/ps.2270102. [DOI] [PMC free article] [PubMed] [Google Scholar]
- 31.Cortese MS, Baird JP, Uversky VN, Dunker AK. Uncovering the unfoldome: enriching cell extracts for unstructured proteins by acid treatment. J Proteome Res. 2005;4:1610–1618. doi: 10.1021/pr050119c. [DOI] [PubMed] [Google Scholar]
- 32.Uversky VN. Use of fast protein size-exclusion liquid chromatography to study the unfolding of proteins, which denature through the molten globule. Biochemistry. 1993;32:1328–3298. doi: 10.1021/bi00211a042. [DOI] [PubMed] [Google Scholar]
- 33.Buchanan S. Beta-barrel proteins from bacterial outer membranes: structure, function and refolding. Curr Opin Struct Biol. 1999;9:455–461. doi: 10.1016/S0959-440X(99)80064-5. [DOI] [PubMed] [Google Scholar]
- 34.Wang L, Kallenbach NR. Proteolysis as a measure of the free energy difference between cytochrome c and its derivatives. Protein Sci. 1998;7:2360–2464. doi: 10.1002/pro.5560071124. [DOI] [PMC free article] [PubMed] [Google Scholar]
- 35.Schulman BA, Kim PS, Dobson CM, Redfield C. A residue-specific NMR view of the non-cooperative unfolding of a molten globule. Nat Struct Biol. 1997;6:630–634. doi: 10.1038/nsb0897-630. [DOI] [PubMed] [Google Scholar]
- 36.Fink AL. Molten globules. Methods Mol Biol. 1995;40:343–360. doi: 10.1385/0-89603-301-5:343. [DOI] [PubMed] [Google Scholar]
- 37.hurana R, Gillespie JR, Talapatra A, Minert LJ, Ionescu-Zanetti C, Millet I, Fink AL. Partially folded intermediates as critical precursors of light chain amyloid fibrils and amorphous aggregates. Biochemistry. 2001;40:3525–3535. doi: 10.1021/bi001782b. [DOI] [PubMed] [Google Scholar]
- 38.Sagar AJ, Pandit MW. Denaturation studies on bovine pancreatic ribonuclease. Effect of trichloroacetic acid. Biochim Biophys Acta. 1983;743:303–309. doi: 10.1016/0167-4838(83)90386-2. [DOI] [PubMed] [Google Scholar]
- 39.Goddard TD, Kneller DG. SPARKY 3. San Francisco, CA: University of California; 2006. [Google Scholar]


