

Abstract
Protein aggregation is an essential molecular event in a wide variety of biological situations, and is a causal factor in several degenerative diseases. The aggregation of proteins also frequently hampers structural biological analyses, such as solution NMR studies. Therefore, precise detection and characterization of protein aggregation are of crucial importance for various research fields. In this study, we demonstrate that fluorescence correlation spectroscopy (FCS) using a single-molecule fluorescence detection system enables the detection of otherwise invisible aggregation of proteins at higher protein concentrations, which are suitable for structural biological experiments, and consumes relatively small amounts of protein over a short measurement time. Furthermore, utilizing FCS, we established a method for high-throughput screening of protein aggregation and optimal solution conditions for structural biological experiments.
Keywords: protein aggregation, fluorescent correlation spectroscopy, NMR, MIP-1α
Introduction
Protein aggregation is an essential molecular event in a wide variety of biological situations, such as immunological reactions. In several cases, however, protein aggregation, such as amyloid fibril formation, causes degenerative diseases or severe anaphylactic responses.1 On the other hand, the aggregation of proteins frequently hampers structural biological analysis. For example, in protein NMR analysis, the aggregation of proteins causes low dispersion and severe line-broadening of NMR signals.2 Therefore, extensive research into adequate solution conditions is required to determine the range in which the target protein is stable and soluble during NMR measurements. However, such trials are a major limiting step in protein NMR studies.3–7
To date, several screening methods for exploring solution conditions have been reported: microdialysis “button tests”4; hanging-drop5; and crystallization “microbatch” tests.3,6 These methods are based on the observation of visible precipitation for each solution condition. However, it is difficult to detect soluble aggregates, which are not visible but which seriously deteriorate the quality of NMR spectra, using these methods. In such cases, repetitive NMR measurement with changing solution conditions should be performed in order to optimize solution conditions, but this would require unrealistic amounts of sample and NMR machine time.7
Fluorescence correlation spectroscopy (FCS) measures fluorescence intensity fluctuations of fluorescence-labeled molecules, which cross through the immobile confocal spot formed by the laser due to Brownian motion in solution, and the translational diffusion time of the molecule is calculated by the fluorescence autocorrelation function.8–10 Translational diffusion times τD are given by the Stokes–Einstein equation;  . In this equation, ω0 is the base radius of the pillar confocal region formed by the laser and D is the translational diffusion coefficient of the target molecule.8–10D is given by the equation; D = KBT/6πηr, where KB, T, η, and r are the Boltzmann constant, absolute temperature, viscosity of solution, and hydrodynamic molecular radius, respectively.8–10 Thus, translational diffusion times are correlated with protein molecular size.
In this study, we demonstrate that FCS enables assessment of soluble aggregation of proteins at higher protein concentrations, which are suitable for structural biological experiments, with relatively small samples and short measurement times. Furthermore, by utilizing FCS, we established a method for assessing protein aggregation and screening of optimal solution conditions for structural biological analyses in a high-throughput manner.
Results and Discussion
Initially, we verified whether the FCS is capable of detecting soluble aggregation of target proteins using macrophage inflammatory protein-1α (MIP-1α)11,12 as a model protein. MIP-1α has a strong tendency toward forming soluble aggregations in a neutral pH range, but the aggregates reversibly disperse in an acidic pH range.11,12 In fact, we confirmed that MIP-1α forms soluble aggregates using multiangle laser light scattering (Supporting Information, Figure S1), and the NMR signals show marked line-broadening with the change from acidic to neutral pH [Fig. 1((a–d)]. The translational diffusion times of MIP-1α in a wide pH range were then measured by FluoroPoint-Light [Olympus, Tokyo, Japan; Fig. 1(e)]. Because of the high sensitivity of FluoroPoint-Light, the optimal concentration of the fluorescence-labeled molecules is 1–10 nM. Therefore, 1 nmol of MIP-1α, which is fluorescently labeled with FMAT-Blue dyes (FMAT-Blue-labeled MIP-1α was purchased from Applied BioSystems, Van Allen Way Carlsbad, CA), was mixed with 80 μM unlabeled MIP-1α.
Figure 1.
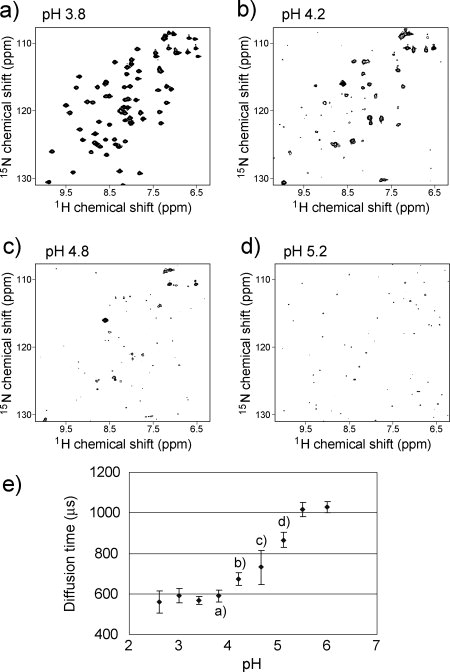
Assessment of protein aggregation using FCS. (a–d) 1H-15N HSQC spectra of MIP-1α at various pH levels. (e) FCS measurement of MIP-1α in pH titration.
We were able to measure the fluorescence intensity fluctuations of these samples, using 384-well plates with low consumption of samples (30 μL/well) and with rapid measurement times (0.5–1 min/well). Thus, the translational diffusion times of MIP-1α are clearly consistent with the qualities of NMR spectra [Figure 1(a–e)]. These results suggest that measurement of translational diffusion times with FCS allows the assessment of soluble aggregation in samples. Furthermore, it was confirmed that FCS measurements were successfully performed using concentrated protein samples (80 μM) by addition of 1–10 nM fluorescence-labeled protein as a probe, and the quality of NMR spectra could be rapidly evaluated without NMR measurements. This is significant in assessing the aggregation states of protein samples at high concentrations, which are typically used for protein crystallization and NMR measurement. In addition, as the amount of the conjugated fluorescent dyes present in the FCS samples is very small, target protein aggregation is less susceptible to the conjugated dyes. However, in some cases, such as in partially aggregated proteins or proteins whose nature is changed by the incorporation of fluorescence tags, it is possible that fluorescent dyes nonspecifically interact with target proteins. In such cases, optimal fluorescent dyes must be identified. The procedures for screening fluorescent dyes are described in the Supporting Information.
By utilizing FCS measurements, we explored the optimal NMR solution conditions for the pleckstrin homology domain of ceramide trafficking protein (CERT PH domain),13 and designed an experimental work flow to perform high-throughput screening for solution conditions. The CERT PH domain forms soluble aggregates at concentrations of more than 0.2 mM, and this is a major obstacle for structural analysis by NMR. Initially, fluorescent labeling of the CERT PH domain was performed as follows; 10 nM ATTO633 fluorescent dye, which has N-hydroxysuccinimide ester groups, was mixed and reacted with 8 mM CERT PH domain. As a result, the concentration of fluorescently labeled CERT PH domains was approximately 4 nM. This was quantitated by counting the number of fluorescence-labeled molecules passing through the confocal region of the laser on FCS measurement.
We examined 30 solution conditions by two-step FCS measurement. In the first step, fifteen combinations of pH and salt concentrations were examined, as these were dominant factors to typically influence the solubility and stability of proteins.4,14,15 At the second step, chemical additives, such as detergents and polyols, were tested under specific pH and salt conditions, as determined in the first screening. A diagram of the work flow is shown in the Supporting Information.
In the first screening, aggregation of the CERT PH domain largely absent at pH 7.5; however, NMR spectrum quality at pH 7.5 was not sufficient [Fig. 2(a,c)]. In the second screening, fifteen chemical additives were examined at pH 7.5. These chemical additives are listed in the Supporting Information. The translational diffusion time of the CERT PH domain was only improved by addition of 50 mM Na2SO4 [Fig. 2(b)], and this led to a marked improvement in the NMR spectrum [Fig. 2(d)]. Based on the present results, a satisfactory NMR spectrum can be obtained for diffusion times of around 600 μs or less.
Figure 2.

High-throughput screening of optimal solution conditions using FCS. (a) FCS measurements of CERT PH domain at various pH and NaCl concentrations. (b) FCS measurements of CERT PH domain with various chemical additives at pH 7.5. (c,d) 1H-15N HSQC spectra of CERT PH domain.
In this way, a total of 30 solution conditions were rapidly screened within a few hours and optimal solution conditions for NMR measurement of the CERT PH domain were successfully determined by FCS analysis. Total volume of the sample used in these screenings was 15 μL × 30 conditions = 450 μL, which corresponds to a typical sample volume for NMR. It was also confirmed that the samples, which contain 1–10 nM fluorescently labeled target proteins, could be measured in the FCS experiments, regardless of unlabeled protein concentrations.
Consequently, it was confirmed that our established protocol and FCS system is a useful tool for high-throughput assessment of protein aggregation and screening for solution conditions for NMR samples. This method is also applicable for screening crystallization conditions in X-ray analyses16 and assessing stability of target proteins in various solutions by altering the interval periods between sample preparation and FCS measurements. This system can also be expanded to a robotic system using an automated liquid handling machine. This would allow for increased screening speed, number of solution conditions, and reproducibility. Therefore, this screening method would accelerate the sample preparation step in structural biological studies.
Methods
NMR measurements
The procedures for protein expression and purification of MIP-1α and CERT PH domain are described in the Supporting Information, and in a previous report,13 respectively. Two-dimensional [15N,1H] HSQC spectra of uniformly 15N-labeled MIP-1α and CERT PH domain were obtained with a Bruker Avance 600-MHz spectrometer equipped with cryogenic probe at 37°C and 30°C, respectively. Data were processed with TopSpin 2.1 (Bruker Biospin, Rheinstetten, Germany) or NMRPipe/NMRDraw.17
FCS measurements
All FCS measurements were performed using a FluoroPoint-Light single-molecule fluorescence detection system (Olympus, Tokyo, Japan) at room temperature (25°C). Fluorescently labeled MIP-1α (FMAT-Blue-MIP-1α) was purchased from ABI. An 80 μM solution of unlabeled MIP-1α was prepared as described in the Supporting Information, and 1–10 nM FMAT-Blue-MIP-1α was added as a detection probe for FCS. The pH of the sample solutions were adjusted as described in the Supporting Information.
FMAT-Blue fluorescence was detected by an onboard helium-neon laser (633 nm) at a laser power of 100 μW for excitation. All FCS measurements were performed using 384-well glass-bottom microplates (Olympus, Tokyo, Japan). Thirty microliter aliquots of the mixture of the FMAT-Blue-MIP-1α and unlabeled MIP-1α were transferred to 384-well glass-bottom microplates. As a standard solution, 1 nM ATTO633 dissolved in the same buffer was used. Standard data were used to adjust optical parameters of the helium–neon laser of the FluoroPoint-Light. The fluorescence properties of FMAT-Blue such as fluorescence intensity and aggregation were not affected by the wide pH range. All of the data acquisition times were 40 s, and measurements were repeated five times per well. All FCS data analyses were performed using the FluoroPoint-Light software package (Olympus, Tokyo, Japan) and translational diffusion times were calculated by mathematical curve fitting of raw fluorescence autocorrelation data with two-component analysis. The standard deviations of translational diffusion times were calculated from the average values of five measurements.
Purified CERT PH domain was dialyzed against fluorescence-labeling buffer (10 mM HEPES-NaOH, 5 mM TCEP-HCl, pH 7.5), and was then concentrated to 8 mM (liquid volume, 500 μL). One microgram per milliliter stock solution of N-hydroxysuccinimide ester-ATTO633 (NHS-ATTO633) (Olympus, Tokyo, Japan) was prepared by dissolving with 100% dimethylslufoxide. The stock solution of NHS-ATTO633 was added to the CERT PH domain (final concentration of NHS-ATTO633 was approximately 10 nM), the mixture was gently rotated and incubated at room temperature for 1 h. Stop reagents (12% ethanolamine) were added to the mixture at a final concentration of 1.2% [w/w], followed by incubation at room temperature for 30 min. Residual unbounded fluorescent dyes were eliminated and the ATTO633-labeled CERT PH domains were purified by size-exclusion chromatography using Superdex 200 10/300 GL column (GE Healthcare Bio-Sciences, Piscataway, NJ).
In the FCS method, fluorescence intensity fluctuations due to the Brownian motion of fluorescence-labeled molecules are analyzed by the autocorrelation function; G(τ/τD) = 1 + (1/N){1/[1 + (τ/τD)]}{1/[1 + (ω1/ω2)2(τ/τD)]}1/2. In this equation, τD is the translational diffusion time, ω is the radius of the confocal region formed by the laser (ω1 for the x- and y-directions, ω2 for the z-direction), and N is the average number of fluorescent molecules that pass through the confocal region. Through this analysis, the number of fluorescent molecules in the samples can be calculated.18 In the case of FluoroPoint-Light (Olympus, Tokyo, Japan), the volume of the confocal region formed by the laser is approximately 1 fL. If the concentration of fluorescent molecules is 1 mol/L, the counted number of fluorescent molecules is 6 × 10⁸. Therefore, when the concentration of fluorescent molecules is 1 nM, the number calculated from the equation is ∼0.6. The number of fluorescence-labeled CERT PH domain molecules calculated by FCS is 2.3. We confirmed that the concentration of fluorescently labeled CERT PH domains was approximately 4 nM, and that 4 nM of fluorescently labeled-/8 mM unlabeled-CERT PH domain stock solution was suitable for FCS experiments.
In the first screening, the CERT PH domain stock solution was diluted two-fold, and the final concentrations of fluorescently labeled- and unlabeled-CERT PH domain were adjusted to 2 nM and 4 mM, respectively. The solvent for the CERT PH domain solution was replaced with fresh buffer under a range of pH and salt conditions, as listed in the Supporting Information, by repeating the ultrafiltration on Amicon Ultra (Millipore, Billerica, MA). Thirty-microliter aliquots of the solutions were transferred into the wells of a plate and FCS measurements were performed. Thus, the aggregation states of the CERT PH domain were assessed under various of pH and salt conditions, and the ideal conditions were identified.
In the second screening, 15 μL of the CERT PH domain stock solution was transferred to a 384-well plate. Next, 15 μL of stock solutions of various chemical additives (listed in Supporting Information), at concentrations two-fold higher than the desired final concentrations, were mixed with the protein solutions in the wells. Consequently, the CERT PH domain and chemical additives were diluted two-fold, and the final concentrations of fluorescently labeled- and unlabeled-CERT PH domain were adjusted to 2 nM and 4 mM, respectively. The 384-well plate was then incubated for 10 min at room temperature (25°C) and FCS measurements were performed as described earlier.
Acknowledgments
The authors thank Dr. Sayoko Kobayashi, Mr. Kazuhito Goda, and Dr. Noriko Kato (Olympus Corp., Tokyo, Japan) for technical support related to FluoroPoint-Light. The authors are also grateful to Dr. Masataka Kinjo (Hokkaido Univ., Sapporo, Japan) for discussions and suggestions regarding FCS, and to Dr. Kentaro Hanada (National Institute of Infectious Diseases, Tokyo, Japan) for providing expression vectors for the CERT PH domain.
References
- 1.Stefani M, Dobson CM. Protein aggregation and aggregate toxicity: new insights into protein folding, misfolding diseases and biological evolution. J Mol Med. 2003;81:678–699. doi: 10.1007/s00109-003-0464-5. [DOI] [PubMed] [Google Scholar]
- 2.Page R, Peti W, Wilson IA, Stevens RC, Wuthrich K. NMR screening and crystal quality of bacterially expressed prokaryotic and eukaryotic proteins in a structural genomics pipeline. Proc Natl Acad Sci USA. 2005;102:1901–1905. doi: 10.1073/pnas.0408490102. [DOI] [PMC free article] [PubMed] [Google Scholar]
- 3.Chayen NE, Shaw Stewart PD, Blow DM. Microbatch crystallization under oil - a new technique allowing many small-volume crystallization trials. J Cryst Growth. 1992;122:176–180. [Google Scholar]
- 4.Bagby S, Tong KI, Liu D, Alattia JR, Ikura M. The button tests: A small scale method using microdialysis cells for assessing protein solubility at concentration suitable fot NMR. J Biomol NMR. 1997;10:279–282. doi: 10.1023/a:1018359305544. [DOI] [PubMed] [Google Scholar]
- 5.Lepre CA, Moore JM. Microdrop screening: A rapid method to optimize solubent conditions for NMR spectroscopy of proteins. J Biomol NMR. 1998;12:493–499. doi: 10.1023/a:1008353000679. [DOI] [PubMed] [Google Scholar]
- 6.Howe PWA. A straight forward method of optimizing protein solubility for NMR. J Biomol NMR. 2004;30:283–286. doi: 10.1007/s10858-004-3739-4. [DOI] [PubMed] [Google Scholar]
- 7.Ducat T, Declerck N, Gostan T, Kochoyan M, Déméné H. Rapid determination of protein solubility and stability conditions for NMR studies using incomplete factorial design. J Biomol NMR. 2006;34:137–151. doi: 10.1007/s10858-006-0003-0. [DOI] [PubMed] [Google Scholar]
- 8.Magde D, Elson E, Webb WW. Thermodynamic fluctuations in a reacting system: measurement by fluorescence correlation spectroscopy. Phys Rev Lett. 1972;29:705–708. [Google Scholar]
- 9.Elson EL, Magde D. Fluorescence correlation spectroscopy. 1. Conceptual basis and theory. Biopolymers. 1974;13:1–27. doi: 10.1002/bip.1974.360130103. [DOI] [PubMed] [Google Scholar]
- 10.Krouglova T, Vercammen J, Engelborghs Y. Correct diffusion coefficients of proteins in fluorescence correlation spectroscopy. Application to tubulin oligomers induced by Mg2+ and paclitaxel. Biophys J. 2004;87:2635–2646. doi: 10.1529/biophysj.104.040717. [DOI] [PMC free article] [PubMed] [Google Scholar]
- 11.Graham GJ, MacKenzie J, Lowe S, Tsang ML, Weatherbee JA, Issacson A, Medicherla J, Fang F, Wilkinson PC, Pragnell IB. Aggregation of the chemokine MIP-1α is a dynamic and reversible phenomenon. J Biol Chem. 1994;269:4974–4978. [PubMed] [Google Scholar]
- 12.Cocchi F, DeVico AL, Garzino-Demo A, Arya SK, Gallo RC, Lusso P. Identification of RANTES, MIP-1α, and MIP-1β as the major HIV-suppressive factors produced by CD8+ T Cells. Science. 1995;270:1811–1815. doi: 10.1126/science.270.5243.1811. [DOI] [PubMed] [Google Scholar]
- 13.Hanada K, Kumagai K, Yasuda S, Miura Y, Kawano M, Fukasawa M, Nishijima M. Molecular machinery for non-vesicular trafficking of ceramide. Nature. 2003;426:803–809. doi: 10.1038/nature02188. [DOI] [PubMed] [Google Scholar]
- 14.Inyang UE, Iduh AO. Influence of pH and salt concentration on protein solubility, emulsifying and foaming properties of sesame protein concentrate. J Am Oil Chem. 1996;73:1663–1667. [Google Scholar]
- 15.Suilman MA, El Tinay AH, Elkhalifa AEO, Babiker EE, Elkhalil EAI. Solubility as influenced by pH and NaCl concentration and functional properties of lenti proteins isolate. Pakistan J Nutrition. 2006;5:589–593. [Google Scholar]
- 16.Schmauder R, Schmidt T, Abrahams JP, Kuli ME. Screening crystallization conditions using fluorescence correlation spectroscopy. Acta Cryst. 2002;D58:1536–1541. doi: 10.1107/s0907444902014373. [DOI] [PubMed] [Google Scholar]
- 17.Delaglio F, Grzesiek S, Vuister GW, Zhu G, Pfeifer J, Bax A. NMRPipe - a multi- dimensional spectral processing system based on Unix pipe. J Biomol NMR. 1995;6:277–293. doi: 10.1007/BF00197809. [DOI] [PubMed] [Google Scholar]
- 18.Rauer B, Neumann E, Widengren J, Rigler R. Fluorescence correlation spectroscopy of the interaction kinetics of tetramethylrhodamine α-bungarotoxin with Torpedo californica acetylcholine receptor. Biophys Chem. 1996;58:3–12. doi: 10.1016/0301-4622(95)00080-1. [DOI] [PubMed] [Google Scholar]