Abstract
Elevated blood levels of homocysteine (Hcy), hyperhomocysteinemia or homocystinuria, have been associated with various diseases and conditions. Homocysteine thiolactone (Hcy TL) is a metabolite of Hcy and reacts with amine groups in proteins to form stable amides, homocystamides or N-homocysteinylated proteins. It has been proposed that protein N-homocysteinylation contributes to the cytotoxicity of elevated Hcy. Due to its heterogeneity and relatively low abundance, detection of this post-translational modification remains challenging. On the other hand, the gamma-aminothiol group in homocystamides imparts different chemical reactivities than the native proteins. Under mildly acidic conditions, gamma-aminothiols irreversibly and stoichiometrically react with aldehydes to form stable 1,3-thiazines, whereas the reversible Schiff base formation between aldehydes and amino groups in native proteins is markedly disfavored due to protonation of amines. As such, we have developed highly selective chemical methods to derivatize N-homocysteinylated proteins with various aldehyde tags, thereby facilitating the subsequent analyses. For instance, fluorescent or biotin tagging coupled with gel electrophoresis permits quantification and global profiling of complex biological samples, such as hemoglobin and plasma from rat, mouse and human; affinity enrichment with aldehyde resins drastically reduces sample complexity. In addition, different reactivities of lysine residues in hemoglobin towards Hcy TL were observed.
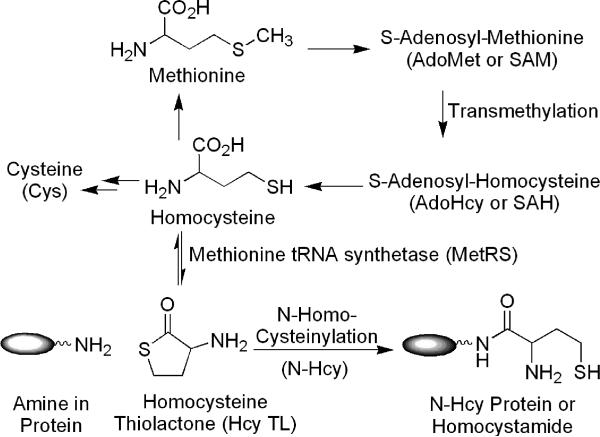
Elevated blood levels of homocysteine (Hcy), hyperhomocysteinemia and homocystinuria, have been associated with cardiovascular disease, neurodegenerative disorder (e.g., Alzheimer's disease) and other conditions.1-5 This elevation can be caused by a host of factors, including genetic defects, nutritional and dietary status (e.g., methionine rich diets).3, 4, 6, 7 Lowering of Hcy levels, for example via folic acid fortification, drastically reduces the incidence of neural tube defects in newborn babies.8 The pathophysiological mechanisms of Hcy toxicity, however, remain unclear.1, 3, 9 As illustrated in Scheme 1, homocysteine in humans is derived from methionine. First, methionine is converted to S-adenosyl-methionine (AdoMet or SAM). After transmethylation, S-adenosyl-homocysteine (AdoHcy or SAH) product is hydrolyzed to homocysteine. Finally, homocysteine thiolactone (Hcy TL) is generated via an error-editing mechanism of methionine tRNA synthetase (MetRS).10, 11 As the thiolactone is highly chemically reactive, it readily reacts with the amino groups in proteins to form stable amides, homocystamides or N-homocysteinylated (N-Hcy) proteins.11-13 Jakubowski and others have therefore hypothesized protein N-homocysteinylation as a contributing factor to the cytotoxic effects of elevated Hcy.11, 13 For example, autoantibodies against N-Hcy proteins in human have been detected.14 While N-homocysteinylation in a handful of individual proteins has been established,15-18 the prevalence of this protein post-translational modification has not been firmly established. Thus, there is an increasing interest in the systematic characterization of N-homocysteinylated proteins and their potential as disease markers. Due to its relatively low abundance and heterogeneous nature, the detection of N-Hcy proteins remains a challenge.
Scheme 1.
Formation of homocysteine thiolactone and its reaction with amino groups in proteins to form homocystamides.
Currently, the most common method for the analysis of N-Hcy proteins involves the complete hydrolysis of proteins to amino acids and the subsequent quantification of free Hcy amino acid by HPLC separation coupled with UV or fluorescence detection.11, 16 Obviously, this method cannot locate the modification site and is impractical for the analysis of many individual proteins in complex biological samples. Recently, polyclonal antibodies against N-Hcy proteins were used to visualize this modification in human cardiac tissue.19 In order to identify the sites of modification, a standard approach, combining proteolytic digestion and mass spectrometry, has been employed. Because of the relatively low abundance of this modification, which also spreads among several amino acid residues in a given protein, only a handful of purified proteins have been examined.15-18 Considering that N-Hcy proteins possess different chemical properties than their native proteins, protein chemistry methods should be particularly useful for their analysis. In fact, Strongin and others recently reported colorimetric methods for the detection of free homocysteine,20, 21 and for homocystamide, based on radical chemistry;22 however, improvements in selectivity and sensitivity are still required before these methods can be applied towards the analysis of biological samples, and, again, the sites of modification cannot be determined by these methods.
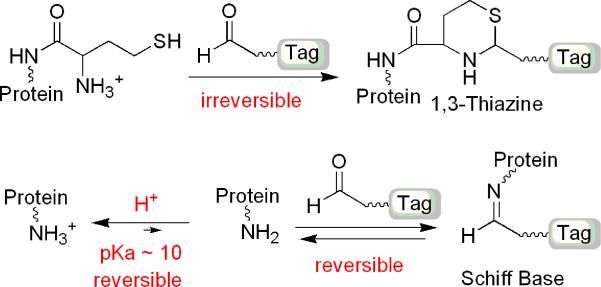
Herein, we report the development of new chemical methods to selectively derivatize N-Hcy proteins with various aldehyde tags, thereby facilitating subsequent systematic and detailed analyses. Our method is centered around 1,3-thiazine adduct formation between aldehydes and N-homocysteinylated proteins, more specifically, the gamma-aminothiol functional group in homocystamides, as illustrated in Scheme 2.23-26 As detailed below, these reactions are highly specific against amines in proteins, are quantitative, and proceed at appreciable rates under mildly acidic conditions. In addition, the thiazine adducts can be analyzed by standard analytical techniques, such as SDS-PAGE and mass spectrometry. As such, fluorescent or biotin tagging permits quantification and global profiling of biological samples, including hemoglobin and plasma from rat, mouse and human. More significantly, N-Hcy proteins and peptides can be affinity enriched using an aldehyde resin, thus reducing sample complexity. Using our method, different reactivities of lysine residues in hemoglobin towards Hcy TL were observed. All together, our selective tagging, quantification and affinity enrichment methods offer, for the first time, a comprehensive approach for the analysis of protein N-homocysteinylation.
Scheme 2.
Selective formation of 1,3-thiazine against Schiff base formation under acidic conditions.
Experimental Section
General Methods and Procedures
All incubations were carried out in an Eppendorf Thermomixer R thermoblock (Brinkmann Instruments, Westbury, NY) at 25 °C unless specified otherwise. Sequencing grade modified trypsin was from Promega (Madison, WI). Peptide and protein stock solutions were stored at −80 °C. Neurotensin peptide (N6383, pyroGlu-Leu-Tyr-Glu-Asn-Lys-Pro-Arg-Arg-Pro-Tyr-Ile-Leu-OH), myoglobin from equine skeletal muscle (M0630), human hemoglobin (H7379), rat hemoglobin (H3883), bovine serum albumin (A3059), and biotinylated protein marker (B2787) were from Sigma-Aldrich (St. Louis, MO). Recombinant enzyme LuxS was prepared as previously described.27 Single donor human plasma Na Citrate (IPLA-N-02) was from Innovative Research (Novi, MI). Rat plasma (SRTPC35-296) was from Equitech-Bio, Inc. (Kerrville, TX). The protein concentrations in plasma were assayed according to Bradford method. Horseradish peroxidase streptavidin (SA-5004) was from Vector Laboratories, Inc. (Burlingame, CA). SuperSignal West Pico chemiluminescent substrate was from Thermo Scientific (Rockford, IL). Biotinyl-Asp-Glu-Val-Asp-aldehyde (N-1470) was from Bachem Americas (Torrance, CA). Rhodamine aldehyde (structure shown in the Supporting Information) was prepared as a 10 mM stock solution in 50% ethanol and its synthesis will be published elsewhere. All reagents were ACS grade and used as received without further purification.
Preparation of N-Hcy Proteins
Equine myoglobin (17.0 kDa) was dissolved in 100 mM ammonium bicarbonate at pH 8.0 to give a final concentration of 34 mg/mL (2 mM) by weight. Myoglobin (1 mM) was incubated with Hcy TL (5 mM) in 100 mM ammonium bicarbonate, 10 mM tris(2-carboxyethyl)phosphine (TCEP) hydrochloride (Thermo Scientific), pH 7.8 at 25 °C for 16 hr. After incubation, modified myoglobin was dialyzed against 50 mM potassium phosphate, 1 mM TCEP, pH 8.0, at 4 °C using 7 kDa cutoff dialysis cassette (Thermo Scientific, Rockford, IL), using 500 times volume of buffer for 2 hr (twice) and then overnight at 4 °C. The modified myoglobin sample was stored at −80 °C. Approximately 40% of the myoglobin was modified by Hcy TL as judged by LC/MS.
Human hemoglobin was dissolved in 50 mM ammonium bicarbonate at pH 8.0 to give a final concentration of 20 mg/mL (310 μM, based on a molecular weight of 64,500 for tetramer). Hcy TL (10 mM) was incubated with human hemoglobin (221 μM) in 100 mM ammonium bicarbonate, 2 mM TCEP, pH 8, at 25 °C for 24 hr. Then, the remaining Hcy TL was removed using Micro Bio-Spin chromatographic columns (Bio-Rad, Hercules, CA), following the vendor's instructions. First, the buffer for suspending the gel matrix in spin columns was exchanged to 50 mM ammonium bicarbonate, 1 mM TCEP at pH 8. New buffer was discarded by centrifugation at 1000 × g for 2 min. Then, modified hemoglobin was loaded on the column and centrifuged at 1000 × g for 5 min. The sample was collected in a clean 1.5 mL microcentrifuge tube and stored at −80 °C.
Labeling of N-Hcy Myoglobin with Rhodamine-Aldehyde at Different pH and Detection by Fluorescence Imaging
Hcy TL modified myoglobin (13 μM, total protein concentration, including 40% N-Hcy myoglobin) and LuxS (70 μM, negative control) were incubated with 200 μM Rhodamine-aldehyde in various pH solutions at 25 °C in the dark, for 8-16 hr. For acidic conditions, 50 mM citric acid including 500 μM TCEP was adjusted to pH 3, 4, 5 and 6 by addition of 10 mM sodium hydroxide. For neutral and basic conditions, 50 mM sodium phosphate including 500 μM TCEP at pH 7 and 8 were used. Then, the samples (12 μL) were mixed with 8 μL SDS loading buffer (5% SDS and 25% glycerol) and loaded into a precast Tris-HCl gel (12%) for SDS-PAGE analysis using a Mini-Protein 3 Electrophoresis Cell system with a PowerPac HV power supply (Bio-Rad). The voltage was maintained at 200 volts. After electrophoresis, the gel was analyzed by Molecular Dynamics Storm 840 imaging system (GE Healthcare, Piscataway, NJ). Fluorescence was detected with an excitation wavelength at 450 nm and an emission wavelength at 520 nm using a Storm Scanner Control version 5.03 (Amersham Bioscience), and the data were visualized by ImageQuant TL 7.0 (GE Healthcare).
Western-Blotting and Chemiluminescence Detection of N-Hcy Proteins
Human or rat hemoglobin 93 μM (6 mg/mL) was incubated with 250 μM biotinylated aldehyde in 50 mM citric acid, 2 mM TCEP, pH 3 in the dark, at 25 °C for 8 hr. Then, 10 μL of the sample was mixed with 10 μL 2 × SDS loading buffer and incubated in boiling water for 5 min. Heat treated samples were loaded into a precast gel (12% or 15%) for SDS-PAGE separation. The voltage was maintained at 150 volts. After electrophoresis, the proteins were transferred onto an Immun-Blot PVDF Membrane (0.2 μm, Bio-Rad) for protein blotting in transfer buffer (25 mM Tris, 192 mM glycine, 20% methanol at pH 8.3), using a Mini Trans-Blot Cell coupled with a PowerPac HV power supply for 70 min. The voltage was maintained at 100 volts. After the protein transfer, the membrane was stained by Ponceau-S solution (0.1% (w/v) Ponceau-S in 5% (v/v) acetic acid). The dye was then removed with MilliQ water. Following this step, the membrane was blocked with 2% BSA in TBST (25 mM Tris, 137 mM NaCl, 3 mM KCl, 0.1% Tween-20 at pH 7.4) for 1 hr. After blocking, the membrane was washed with TBST for 3 × 10 min and incubated with 4 μg/mL streptavidin-HRP in 20 mL TBST for 1 hr. Then, the membrane was washed again by TBST for 5 × 8 min and incubated in PBS (68 mM NaCl, 1 mM KCl, 5 mM Na2HPO4, 1 mM KH2PO4 at pH 7.4) for 10 min. After incubation, the buffer was discarded, and the chemiluminescence signal was developed by addition of 1 mL SuperSignal West Pico chemiluminescent substrate for 1 min. Chemiluminescence was detected by FluorChem Imager SP (Alpha Innotech Corp., San Leandro, CA), and the image was analyzed by AlphaEase EC 4.1.0.
Human or rat plasma (40 mg/mL, total protein concentration) was incubated with 250 μM biotinylated aldehyde in 200 mM citric acid, 2 mM TCEP, pH 3 in the dark, at 25 °C for 8 hr. Next, 15 μL of the sample was mixed with 2 × SDS loading buffer (15 μL) and placed in boiling water for 5 min. Precast gels (12% or 4-15%) were used during SDS-PAGE separation. Then, the samples were detected by Western blotting and chemiluminescence as described above.
Tryptic Digestion of N-Hcy Hemoglobin
Hcy TL modified hemoglobin (1.2 mg, total protein) was digested with trypsin (enzyme to protein ratio, 1:60) in 95 mM ammonium bicarbonate, 1 mM TCEP and 10% acetonitrile at 37 °C, 400 rpm overnight. After digestion, 5% trifluoroacetic acid (TFA) was added (final volume of 1:10, 5% TFA:solution) to terminate the reaction, followed by solvent evaporation by speed vac.
Affinity Enrichment of N-Hcy Peptides and Proteins
The tryptic digest of N-Hcy human hemoglobin (2.4 mg) was dissolved in 250 μL binding solution (150 mM citric acid, 20 mM TCEP, 20% acetonitrile at pH 3). N-Hcy peptides were captured on Self Pack POROS 20 AL resin functionalized with an aliphatic aldehyde (Applied Biosystems, Foster City, CA). The resin was preconditioned following the manufacturer's recommendations. Briefly, 30 mg resin was placed in a Spin Column-Screw Cap (Thermo Scientific) followed by the addition of 500 μL water. Then, the resin was washed with water (3 × 500 μL) and binding solution (3 × 500 μL). After preconditioning, the binding solution was passed through the column using a syringe. Peptide solution was loaded onto the column and mixed with the resin in the Eppendorf Thermomixer with 700 rpm rotation, at 25 °C for 4 hr. After binding, the supernatant was removed and the resin was washed three times with 500 μL washing solution I (150 mM citric acid, 10 mM TCEP, 20% acetonitrile at pH 3), three times with 500 μL washing solution II (150 mM citric acid, 2 M sodium chloride, 10 mM TCEP, 5% acetonitrile at pH 3), and three times with 500 μL washing solution III (150 mM citric acid, 10 mM TCEP, 50% acetonitrile at pH 3). For each step, the washing solution was incubated with resin for 10 min. After washing, the resin was conditioned with binding solution (500 μL, three times). Then, 200 μL of elution solution I (400 mM O-methylhydroxylamine, 100 mM citric acid, 20 mM TCEP, 20% acetonitrile at pH 3) was incubated with resin in the Eppendorf Thermomixer with 700 rpm rotation, at 25 °C overnight, and the eluant was collected. The resin was incubated with 200 μL elution solution II (400 mM O-methylhydroxylamine, 50% acetonitrile with 10 mM TCEP) for 1 hr before the eluant was collected, and this step was repeated a final time. All three eluted fractions were combined and concentrated to 40 μL by speed vac.
LC-LTQ-FT MS Analysis
An LTQ-FTMS instrument (Thermo Fisher Scientific, San Jose, CA) equipped with a PicoView ESI source (New Objective, Woburn, MA) coupled to an Ultimate 3000 nanoflow LC pump (Dionex, Mountain View, CA) was used. Affinity enriched hemoglobin peptide solution (5 μL) was loaded onto a self-packed reversed phase column (75 μm i.d. × 15 cm, Magic C18 resin, 3 μm particle size, 200 Å pore size, Michrom BioResources, Auburn, CA). The flow rate was approximately 200 nL/min for both sample loading and separation. The column was eluted using 0.1% (v/v) formic acid in water (mobile phase A) and 0.1 % (v/v) formic acid in acetonitrile (mobile phase B), and started at 2% B and increasing to 40% B over 35 min, then to 90% B over 10 min, and finally isocratic 90% B for 10 minutes. Before injection of the next sample, the column was washed with 2% B for 30 min. At least three blank runs were used to minimize carryover between different injections. The temperature of the ion transfer tube of the linear ion trap was held at 245 °C, and the electrospray voltage at 2.2 kV. The mass spectrometer was operated in the data-dependent mode to switch automatically between MS and MS2 acquisition. A full MS (m/z 400-1800) scan was acquired in the FT-ICR cell with the mass resolution of 100,000 at m/z 400 (target ion counts at 2 × 10⁶ ions), followed by 9 sequential data-dependent MS2 scans in the ion trap, which isolated 9 ions with the highest intensity in the MS scan. For the data-dependant mode, the dynamic exclusion was implemented with 2 repeat counts (repeat duration of 30 seconds, exclusion list 200, and exclusion duration of 30 seconds). The normalized collision energy was 28% for the MS2 scans.
Data Processing
All LC-MS/MS data were analyzed using the Xcalibur 2.0 software (Thermo Fisher Scientific, Waltham, MA). MS2 spectra were extracted and searched against a protein database containing human hemoglobin protein sequence (see Figure S8.3) using the SEQUEST algorithm. The Hcy TL modification for lysine was set at + 117.02 Da and employed in the database search. Specific tryptic cleavage with 2 missed cleavage sites was applied with a mass tolerance of 1.5 amu for the average mass of precursor. The SEQUEST results were then filtered using the program Bioworks 3.2 (Thermo Fisher Scientific) requiring XCorr cutoffs of 1.9, 2.2, and 3.75 for +1, +2, and +3 charged peptides, respectively; a peptide probability cutoff of 0.01; mass accuracy of monoisotopic mass of precursor ions lower than 2 ppm; and fully tryptic status of identified peptides.
RESULTS AND DISCUSSION
Formation and Detection of 1,3-Thiazines between Homocystamides and Aldehydes
As illustrated in Scheme 2, our approach is centered around the formation of 1,3-thiazine adducts between aldehydes and N-Hcy proteins and peptides, more specifically, the gamma-aminothiol group of homocystamides. This transformation has been documented in the literature and in fact, has been explored by Strongin and others for the detection of free homocysteine amino acid.23-26 Since a free thiol group is required for the reaction, all samples were treated with reducing reagents, such as TCEP, to convert any disulfides into free thiols. Pertinent to this study, we have found that the 1,3-thiazine adducts are chemically stable between pH 3 to 9 and amenable to all the subsequent analytical methods, including mass spectrometry (both MALDI and ESI) and gel electrophoresis coupled with fluorescence imaging and Western blotting. For example, the MS and MS/MS spectra (Figure S1.1-2, S2.1-6) of N-Hcy neurotensin (Neu) and its thiazine adducts with several aldehydes confirmed that the modified site was on lysine.
Selective, Quantitative Formation of 1,3-Thiazine Adducts Under Mildly Acidic Conditions and Reaction Kinetics
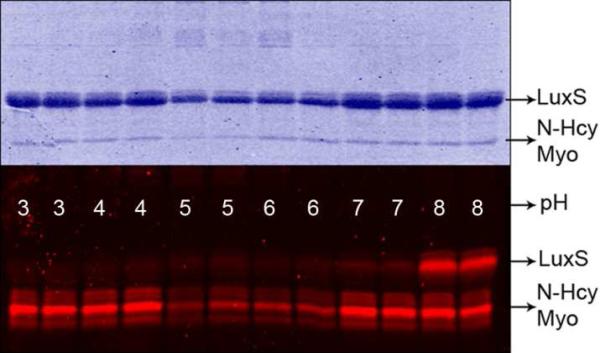
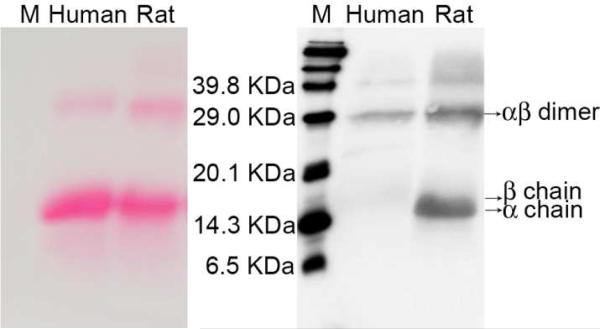
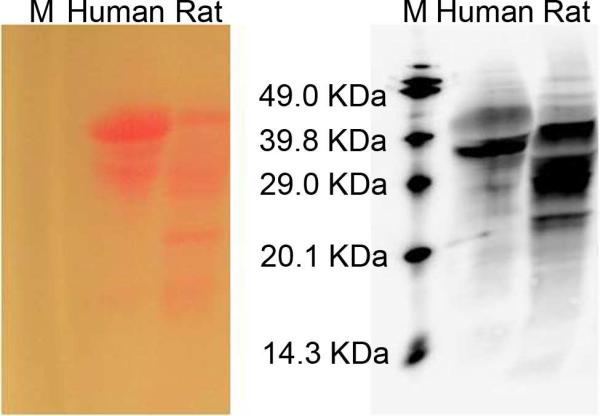
In order to selectively detect homocystamides with aldehyde reagents, competing reactions, particularly formation of Schiff base (imines), must be minimized. Under acidic conditions, Schiff base formation between aldehydes and amines is reversible, and the overall equilibrium favors the protonated free amines, whereas thiazine formation is irreversible, and thus, the overall reaction is not affected (Scheme 2). Studies of 1,3-thiazine formation between N-Hcy myoglobin and Rhodamine aldehyde under various pH conditions indicate that labeling of N-Hcy protein remains constant throughout pHs 3, 4, 7, and 8 (protein loss due to precipitation was observed at pH 5 and 6, as shown in Figure 1). In comparison, there was considerable labeling of unmodified bacterial LuxS protein (used as a negative control) at pH 8 but no detectable signal above background at pH 3 or 4, even though the concentration of LuxS was 5-fold higher than that of myoglobin. Another demonstration of the high selectivity is shown in Figure 2: a weak signal (less than 1 pmole) was detected for the α- and β-monomers of human hemoglobin by Western blotting using a biotinylated aldehyde, even though each unit contains 11 lysine residues and was present in relatively large amounts (~60 μg total or 1.9 nmole for each monomer). The reaction between N-homocysteinylated myoglobin and aldehyde under acidic conditions was also investigated by LC-ESI mass spectrometry (Figures S3.1 and S3.2) and Schiff base formation was not detected despite the presence of excess aldehyde (Figure S4.1). Similar strategies of modulating selectivity via judicious pH control have been effectively employed in the affinity enrichment of protein hydrazides as part of our detection method for isoaspartic acid.28 In addition, mass spectrometric analysis shows that homocystamides in proteins and peptides were converted into the corresponding 1,3-thiazines in a quantitative manner, which further allows for the quantification of N-homocysteinylation content in proteins (Figure S4.1). As shown in Figures S4.2 and S4.3, an excellent linear correlation was observed (r2: 0.999) between the amount of N-homocysteinylation present and the fluorescence intensity. The kinetics of thiazine formation between pH 3 and 5 at 25 °C were monitored by LC-ESI mass spectrometry. As shown in Figure S5.1, the labeling reactions were essentially complete after 3 hr incubation with 50 or 100 μM aldehyde. Based on these observations, all subsequent labeling experiments were carried out between 3 and 16 hours.
Figure 1.
SDS-PAGE gel images of Coomassie staining (top) and fluorescence imaging (bottom) of N-Hcy myoglobin (Myo) and LuxS treated with Rhodamine-aldehyde at the indicated pH.
Figure 2.
Ponceau-S staining (left) and chemiluminescent (right) images of human and rat hemoglobin treated with the biotinylated aldehyde. “M” denotes biotinylated protein markers. In the right image, chemiluminescence intensity indicates the amount of N-Hcy proteins; in the left image, the color density from Ponceau-S staining indicates the total amount of protein. On each image, rat proteins (60 μg) are shown in the right lane and human hemoglobin (60 μg) in the left lane.
A potential complication for our method is that free N-terminal cysteine residues, which are beta-aminothiols, also react with aldehydes to form thiazolidines under our reaction conditions.29-31 However, cysteine is fairly rare with an average occurrence of 1.6% in proteins.32 In addition, comprehensive sequence analysis of the human genome indicates that the occurrence of cysteine at the N-termini is markedly suppressed,32 and none of the forty most abundant proteins in plasma and heart tissue we examined have cysteine at their N-termini, perhaps to avoid reactions with biological aldehydes. A similar finding was reported recently, i.e., only 0.5% (99 out of 20,327) of human proteins are predicted to have an N-terminal cysteine.30 Furthermore, it is estimated that N-terminal amines in over 80% of all mammalian proteins are acetylated, and consequently, will not react with aldehydes. Even in the presence of a few proteins with free N-terminal cysteine, the overall sample complexity is still greatly reduced by affinity enrichment and the analysis of other proteins will not be affected. In principle, N-terminal serine and threonine can also react with aldehydes to form 1,3-oxazolidines. However, in aqueous solution and under our reaction conditions, 1,3-oxazolidine formation is disfavored both kinetically and thermodynamically, as reported by several laboratories and observed by ours.29-31
Sensitivity of Fluorescence and Chemiluminescence Detection
Based on the fluorescence imaging data shown in Figure S4.2, the detection limit was about 80 ng (4.7 pmole) for N-Hcy myoglobin using Rhodamine aldehyde as the labeling reagent. Then, we investigated whether the Rhodamine aldehyde was sensitive enough to detect N-homocysteinylation in biological samples. Human plasma proteins (84 μg) were labeled with the Rhodamine aldehyde, and N-Hcy myoglobin at different concentrations was added as standard. As shown in Figure S6.1, fluorescence was clearly detected for the bands of human serum albumin. However, other potentially modified proteins in plasma were not detected using this Rhodamine aldehyde. Of course, brighter fluorophores can enhance the overall sensitivity.
Alternatively, Western blotting coupled with chemiluminescent detection offered much higher sensitivity (Scheme S7.1). Briefly, a biotin aldehyde (Biotin-D-E-V-D-Aldehyde, Figure S7.1) was used to label N-Hcy myoglobin and a standard Western blotting protocol was followed. Figure S7.2 shows the chemiluminescent gel image for 80, 40, 20 and 10 ng of N-Hcy-myoglobin. Within 5 min of exposure, the 20 ng N-Hcy protein (1 pmole) band was clearly visible.
Detection of N-Homocysteinylation in Biological Samples
Our method of biotin labeling and chemiluminescence detection was tested with biological samples. As illustrated in Figure 2, we were able to detect N-homocysteinylation in both human and rat hemoglobin. In addition, the extent of modification was greater in the rat hemoglobin than that observed for the human protein. Our results were consistent with previous findings by Jakubowski that human and rat hemoglobin contained 1.4% and 8.2% N-homocysteinylation, respectively.16 Interestingly, a much higher percentage of modification was found in the dimer form of both human and rat hemoglobin. This is particularly pronounced in the human protein, as N-homocysteinylation was barely detected in the alpha- and beta-monomers (which eluted very close to each other), in spite of the much larger amount of monomer present. Again, the weak signal from the human monomers demonstrates the high selectivity of our detection method. The exact nature and origin of hemoglobin dimers is unknown. Nonetheless, our data suggest that different isoforms of a given protein may be modified differently by Hcy TL, or perhaps, N-homocysteinylation itself contributes to the heterogeneity of these proteins. Next, human and rat plasma were analyzed in the same manner. As shown in Figure 3, human and rat plasma proteins produced distinct patterns. Moreover, in comparison to Rhodamine aldehyde labeling coupled with fluorescence detection, many more bands were detected by biotin labeling coupled with chemiluminescence detection. Quantitatively, the same total amount of proteins (60 μg) was loaded in each lane, and it is clear that the overall level of N-homocysteinylation in rat plasma is much higher than in human, mirroring the difference we observed in hemoglobin.
Figure 3.
Ponceau-S staining (left) and chemiluminescence (right) images of human and rat plasma treated with the biotinylated aldehyde. “M” denotes biotinylated protein markers. Chemiluminescent intensity (right image) indicates the amount of N-Hcy proteins, and the color density from Ponceau-S staining (left image) shows the total amount of all the proteins. In each image, the left and right lanes contained human and rat plasma proteins (60 μg), respectively.
Affinity Enrichment of N-Homocystamides
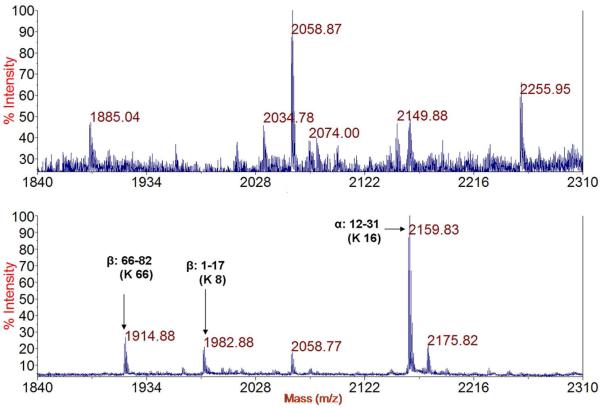
The highly reactive Hcy TL typically modifies several amino groups in any given protein, resulting in a heterogeneous pool of N-homocysteinylated peptides that each may only be present at low abundance.16 For these reasons, affinity enrichment of N-homocysteinylated peptides will greatly facilitate their analysis. The efficiency of our affinity enrichment methodology was examined using peptides (e.g., N-Hcy Neu, and tryptic digest of N-Hcy hemoglobin) or proteins (e.g., N-Hcy myoglobin) with aldehyde resins. In each case, the initial capture of homocystamide was complete or near complete, as evidenced by the disappearance or noticeable reduction of the peaks for the homocystamides in the supernatant after binding (see Figure 4 for tryptic digest of N-Hcy hemoglobin, Figure S8.1 for N-Hcy Neu, and Figure S8.2 for N-Hcy myoglobin). Two washing solutions were used to remove peptides that did not contain homocystamides: one with high salt (2 M NaCl) to disrupt electrostatic interactions, and the other one with high percentage of organic solvent (50% acetonitrile) to minimize hydrophobic interactions. Elution with O-methylhydroxylamine at pH 3 effectively released all homocystamide, as acidic conditions also favor the kinetics of 1,3-thiazine dissociation.30, 31 As illustrated in Figure 4 (N-Hcy hemoglobin) and Figure S.8.1 (N-Hcy Neu), the majority of peptides containing no homocystamide were removed and the prominent peaks in the elution were due to homocystamides. There were some peaks from peptides without homocystamide, for example, the peaks at 2058.77 was from peptide 41-59 in the beta-chain (FFESFGDLSTPDAVMGNPK, predicted [M+H]+: 2058.95), which contains multiple hydrophobic residues (e.g., three phenylalanine residues), indicating secondary non-specific interactions likely contribute to the binding of these peptides to the resin. Taken together, these results demonstrate the high efficiency of our enrichment procedures.
Figure 4.
Mass spectra of the supernatant of the tryptic digest of N-Hcy human hemoglobin after incubation with the aldehyde resin (POROS 20 AL) (top) and elution with O-methylhydroxylamine (bottom). H-Hcy peptides are labeled in the bottom spectrum. The predicted [M+H]+ of N-Hcy peptide 66-82 of β-chain (K*VLGAFSDGLAHLDNLK) is 1915.01, peptide 1-17 of β-chain (VHLTPEEK*SAVTALWGK) is 1983.04, and peptide 12-31 of α-chain, (AAWGK*VGAHAGEYGAEALER) is 2160.03. K* denotes the N-homocysteinylated lysine.
Identification of Modification Sites in N-Hcy Hemoglobin
While over twenty proteins have been shown to be N-homocysteinylated, the sites of modification have been established in only a handful of proteins and all resulted from in vitro model studies except for the case of human serum albumin (HSA). One major challenge is that multiple sites in a given protein are likely to be modified by Hcy TL, but this is overcome by our affinity enrichment method. Indeed, over a dozen modification sites in N-Hcy hemoglobin (lysine 7, 11, 16, 56, 61, 90, 99 and 139 in α-chain; lysine 8, 17, 59, 61, 65, 66, 82, 95, 120 and 144 in β chain) were identified by mass spectrometry. The large set of data allows us to examine some of the contributing factors in N-homocysteinylation. For example, lysine 127 in the alpha chain is mostly buried inside the protein, and as expected, no modification of this residue was detected. On the other hand, for lysine residues that are more accessible to solvent, there is no clear correlation between their accessibility and the degree of modification. For example, modification of more solvent exposed lysine residues (60 in α-chain and 132 in β-chain) was not detected. This is not unexpected, as the pKa, nucleophilicity and the local environment of each amino group are all factors in determining their susceptibility to modification. Interestingly, modification of the N-terminal amines in alpha- and beta-chains was not detected, although glycation of N-terminal valine of the beta-chain of hemoglobin by glucose has been well documented. This work represents one of the very first comprehensive analyses of the sites of protein N-homocysteinylation.
Proteomic studies of N-Hcy proteins is biologically relevant because lysine residues participate in other critical protein post-translational modifications such as methylation and acetylation,33 and irreversible N-homocysteinylation would directly compete with these processes. Using our method, large sets of data can be gleaned for other proteins as well, and this will lead to a better understanding of the contributing factors of protein N-homocysteinylation and may also allow for the prediction of such events in biological systems.
Mass Spectrometric Analysis of N-Homocysteinylated Peptides
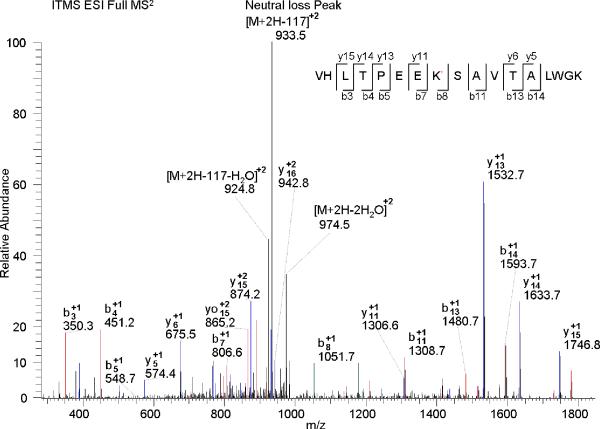
For most N-homocysteinylated peptides, “neutral loss” with characteristic mass shift, 117 m/z for singly charged ions (+1), 58.5 m/z for +2 ions, and 39 m/z for +3 ions, with respect to the molecular ion of the parent peptide fragments, were observed, as exemplified by Figure 5. This is not surprising given that N-homocysteinylation consists of an amide linkage between the epsilon amine of lysine and the carboxylic group of homocysteine. The neutral loss derived peaks sometimes was dominant in CID MS2 spectra and resulted in poor fragmentation efficiency and lower identification rates using the conventional method of data dependent CID scanning. Nevertheless, much higher specificity for MS3 detection could be achieved when some particular MS based scan function, such as neutral-loss-triggered MS3 and multi-stage activation, were applied.34-37 These approaches could significantly minimize the false positive rate of spectra interpreter and expedite identification of N-homocysteinylated peptide from complex biological sample.
Figure 5.
MS2 spectrum of +2 charged precursor ion of an N-Hcy peptide (VHLTPEEK*SAVTALWGK) from the β-chain of human hemoglobin. K* denotes the N-homocysteinylated lysine. The neutral loss peak m/z (+2) is 933.5 (predicted m/z: 933.5).
CONCLUSIONS
Protein N-homocysteinylation has been hypothesized as a contributing factor in homocysteine related diseases and conditions, but has not been fully explored due to analytical challenges. As reported herein, we have devised highly specific, quantitative and sensitive methods for the analysis of N-homocysteinylation in biological samples. Furthermore, our affinity enrichment method captures homocystamides and effectively reduces sample complexity, enabling us to systematically examine multiple modification sites. Taken together, our methods will be of great utility to biomedical investigations, proteomic research and clinical studies, such as the discovery of related protein biomarkers and to better understand the etiology of homocysteine associated diseases.
Supplementary Material
ACKNOWLEDGMENT
We thank Penny Beuning, Bill Hancock and Alex Makriyannis for access to instrumentation. We also thank Matthew Francis, Rob Strongin and Hieronim Jakubowski for helpful discussions. This work was supported by NIAID, NIH (1R01AI05814) and Autism Research Institute to Z.S.Z., in part by NIH (GM15847 to BLK.), and a predoctoral fellowship award from the American Heart Association (09PRE2300071 to T.Z.). This is contribution number 945 from the Barnett Institute.
Footnotes
Support Information Available. Characterization of modified peptides and proteins. This material is available free of charge via the Internet at http://pubs.acs.org.
References
- 1.Maron BA, Loscalzo J. Annu. Rev. Med. 2009;60:39–54. doi: 10.1146/annurev.med.60.041807.123308. [DOI] [PMC free article] [PubMed] [Google Scholar]
- 2.Joseph J, Joseph L. Metab. Syndr. Relat. Disord. 2003;1:97–104. doi: 10.1089/154041903322294425. [DOI] [PubMed] [Google Scholar]
- 3.Carmel R, Jacobsen DW. Homocysteine in health and disease. Cambridge University Press; Cambridge, UK ; New York: 2001. [Google Scholar]
- 4.Selhub J, Jacques PF, Wilson PW, Rush D, Rosenberg IH. J. Am. Med. Assoc. 1993;270:2693–2698. doi: 10.1001/jama.1993.03510220049033. [DOI] [PubMed] [Google Scholar]
- 5.Mudd SH, Finkelstein JD, Irreverre F, Laster L. Science. 1964;143:1443–1445. doi: 10.1126/science.143.3613.1443. [DOI] [PubMed] [Google Scholar]
- 6.Finkelstein JD. Semin. Thromb. Hemost. 2000;26:219–225. doi: 10.1055/s-2000-8466. [DOI] [PubMed] [Google Scholar]
- 7.Goyette P, Sumner JS, Milos R, Duncan AM, Rosenblatt DS, Matthews RG, Rozen R. Nat. Genet. 1994;7:195–200. doi: 10.1038/ng0694-195. [DOI] [PubMed] [Google Scholar]
- 8.De Wals P, Tairou F, Van Allen MI, Uh SH, Lowry RB, Sibbald B, Evans JA, Van den Hof MC, Zimmer P, Crowley M, Fernandez B, Lee NS, Niyonsenga T. N. Engl. J. Med. 2007;357:135–142. doi: 10.1056/NEJMoa067103. [DOI] [PubMed] [Google Scholar]
- 9.Jacobsen DW. Clin. Chem. 2009 in press. [Google Scholar]
- 10.Jakubowski H. Proc. Natl. Acad. Sci. U S A. 1990;87:4504–4508. doi: 10.1073/pnas.87.12.4504. [DOI] [PMC free article] [PubMed] [Google Scholar]
- 11.Jakubowski H. J. Physiol. Pharmacol. 2008;59(Suppl 9):155–167. [PubMed] [Google Scholar]
- 12.Garel J, Tawfik DS. Chemistry. 2006;12:4144–4152. doi: 10.1002/chem.200501145. [DOI] [PubMed] [Google Scholar]
- 13.Jakubowski H. J. Biol. Chem. 1997;272:1935–1942. [PubMed] [Google Scholar]
- 14.Undas A, Perla J, Lacinski M, Trzeciak W, Kazmierski R, Jakubowski H. Stroke. 2004;35:1299–1304. doi: 10.1161/01.STR.0000128412.59768.6e. [DOI] [PubMed] [Google Scholar]
- 15.Glowacki R, Jakubowski H. J. Biol. Chem. 2004;279:10864–10871. doi: 10.1074/jbc.M313268200. [DOI] [PubMed] [Google Scholar]
- 16.Jakubowski H. Anal. Biochem. 2008;380:257–261. doi: 10.1016/j.ab.2008.05.049. [DOI] [PubMed] [Google Scholar]
- 17.Perla-Kajan J, Marczak L, Kajan L, Skowronek P, Twardowski T, Jakubowski H. Biochemistry. 2007;46:6225–6231. doi: 10.1021/bi602463m. [DOI] [PubMed] [Google Scholar]
- 18.Sauls DL, Lockhart E, Warren ME, Lenkowski A, Wilhelm SE, Hoffman M. Biochemistry. 2006;45:2480–2487. doi: 10.1021/bi052076j. [DOI] [PubMed] [Google Scholar]
- 19.Perla-Kajan J, Stanger O, Luczak M, Ziolkowska A, Malendowicz LK, Twardowski T, Lhotak S, Austin RC, Jakubowski H. Biomed. Pharmacother. 2008;62:473–479. doi: 10.1016/j.biopha.2008.04.001. [DOI] [PubMed] [Google Scholar]
- 20.Wang D, Crowe WE, Strongin RM, Sibrian-Vazquez M. Chem. Commun. (Camb) 2009:1876–1878. doi: 10.1039/b819746f. [DOI] [PMC free article] [PubMed] [Google Scholar]
- 21.Wang W, Escobedo JO, Lawrence CM, Strongin RM. J. Am. Chem. Soc. 2004;126:3400–3401. doi: 10.1021/ja0318838. [DOI] [PMC free article] [PubMed] [Google Scholar]
- 22.Strongin Robert. personal communication. 2009. Portland State University.
- 23.Jakubowski H. Chemistry. 2006;12:8039–8043. doi: 10.1002/chem.200600785. [DOI] [PubMed] [Google Scholar]
- 24.Rusin O, St Luce NN, Agbaria RA, Escobedo JO, Jiang S, Warner IM, Dawan FB, Lian K, Strongin RM. J. Am. Chem. Soc. 2004;126:438–439. doi: 10.1021/ja036297t. [DOI] [PMC free article] [PubMed] [Google Scholar]
- 25.Wang W, Rusin O, Xu X, Kim KK, Escobedo JO, Fakayode SO, Fletcher KA, Lowry M, Schowalter CM, Lawrence CM, Fronczek FR, Warner IM, Strongin RM. J. Am. Chem. Soc. 2005;127:15949–15958. doi: 10.1021/ja054962n. [DOI] [PMC free article] [PubMed] [Google Scholar]
- 26.Zhang D, Zhang M, Liu Z, Yu M, Li F, Yi T, Huang C. Tetrahedron. Lett. 2006;47:7093–7096. [Google Scholar]
- 27.Hilgers MT, Ludwig ML. Proc. Natl. Acad. Sci. U S A. 2001;98:11169–11174. doi: 10.1073/pnas.191223098. [DOI] [PMC free article] [PubMed] [Google Scholar]
- 28.Alfaro JF, Gillies LA, Sun HG, Dai S, Zang T, Klaene JJ, Kim BJ, Lowenson JD, Clarke SG, Karger BL, Zhou ZS. Anal. Chem. 2008;80:3882–3889. doi: 10.1021/ac800251q. [DOI] [PubMed] [Google Scholar]
- 29.Fülöp F, Mattinen J, Pihlaja K. Tetrahedron. 1990;46:6545–6552. [Google Scholar]
- 30.Giron P, Dayon L, David F, Sanchez JC, Rose K. J. Proteomics. 2009;71:647–661. doi: 10.1016/j.jprot.2008.11.009. [DOI] [PubMed] [Google Scholar]
- 31.Tam JP, Miao Z. J. Am. Chem. Soc. 1999;121:9013–9022. [Google Scholar]
- 32.Rejtar Tomas. personal communication. 2009. Northeastern University.
- 33.Choudhary C, Kumar C, Gnad F, Nielsen ML, Rehman M, Walther T, Olsen JV, Mann M. Science. 2009 doi: 10.1126/science.1175371. in press. [DOI] [PubMed] [Google Scholar]
- 34.Schroeder MJ, Shabanowitz J, Schwartz JC, Hunt DF, Coon JJ. Anal. Chem. 2004;76:3590–3598. doi: 10.1021/ac0497104. [DOI] [PubMed] [Google Scholar]
- 35.Villen J, Beausoleil SA, Gygi SP. Proteomics. 2008;8:4444–4452. doi: 10.1002/pmic.200800283. [DOI] [PMC free article] [PubMed] [Google Scholar]
- 36.Zhang Q, Petyuk VA, Schepmoes AA, Orton DJ, Monroe ME, Yang F, Smith RD, Metz TO. Rapid Commun. Mass Spectrom. 2008;22:3027–3034. doi: 10.1002/rcm.3703. [DOI] [PMC free article] [PubMed] [Google Scholar]
- 37.Zumwalt A, Choudhary G, Cho D, Hemenway E, Mylchreest I. Proc. 51st ASMS Confer. Mass Spectrom. Allied Top..2003. [Google Scholar]
Associated Data
This section collects any data citations, data availability statements, or supplementary materials included in this article.


