

Abstract
This study tests if measures of hippocampal water diffusivity at baseline can predict future progression to Alzheimer’s Disease (AD) in amnestic mild cognitive impairment (aMCI). Higher baseline hippocampal diffusivity was associated with a greater hazard of progression to AD in aMCI (p=0.002). MR diffusion weighted imaging (DWI) may help identify patients with aMCI who will progress to AD as well or better than structural MRI measures of hippocampal atrophy.
People with amnestic mild cognitive impairment (aMCI) are recognized as an important clinical group in identifying early markers for Alzheimer’s Disease (AD) (1). While most people with aMCI progress to AD in the future, the rate of progression to AD varies among these individuals. This provides the incentive to develop neuroimaging markers that can predict the rate of progression to AD in aMCI. Diffusion weighted MR imaging (DWI) is sensitive to the random motion of water molecules in brain tissue. Measures of apparent diffusion coefficient (ADC) from DWI can quantify the alterations in water diffusivity resulting from microscopic structural changes. In a previous cross-sectional study, we found that hippocampal ADC values were higher in people with aMCI and AD than in cognitively normal elderly subjects (2). Our objective in this study was to determine if baseline hippocampal ADC can predict future progression to AD in people with aMCI, and if baseline hippocampal ADC may better predict progression to AD when combined with hippocampal volumetry in a multivariate model.
Methods
Between September 1998 and June 2000, 24 aMCI patients and 60 cognitively normal elderly subjects were consecutively recruited for a DWI study from the AD Research Center (ADRC)/AD Patient Registry (ADPR) at the Mayo Clinic Rochester. We previously published the cross-sectional data from 19 of the aMCI patients and 55 of the normal subjects (2). This study was approved by the Mayo Institutional Review Board, and informed consent for participation was obtained from every subject and/or an appropriate surrogate. Individuals participating in the ADRC/ADPR undergo approximately annual clinical evaluations, brain MRI and routine laboratory tests. Subjects with structural abnormalities that could produce dementia, such as cortical infarction, tumor, subdural hematoma, or who had treatments or concurrent illnesses interfering with cognitive function other than AD were excluded. The diagnosis of probable AD was made according to the DSM-III-R (3)criteria for dementia, and NINCDS/ADRDA (4) criteria for AD. Patients with aMCI met the criteria by Petersen et al. (1). Normals were independently functioning community dwellers with no neurological or psychiatric conditions.
The MRI and DWI studies were performed on a 1.5T MR scanner (Signa; GE). Single shot echo planar-fluid attenuated inversion recovery (EPI-FLAIR) DWI was performed in a coronal plane with TR/TE/TI = 9999/93/2200 ms. A FLAIR image volume with b=0 s/mm2, and DWI with b=1000 s/mm2 in three orthogonal directions were acquired at identical slice positions. Average ADC maps were computed pixel by pixel with the Stejskal and Tanner equation (5). Coronal T1 weighted spin echo images from the same slice locations as DWI were obtained to be used as anatomic reference for defining the hippocampal regions of interest (ROI) for ADC measurements. Hippocampal ADC were determined from ROIs traced on the most posterior coronal slice that included the hippocampal heads on EPI-FLAIR images. These traces then concurrently appear on the ADC maps (Figure 1). The borders of the hippocampal heads in all subjects were traced by the same investigator (KK), who was blinded to the clinical diagnosis. Special attention was paid to excluding CSF from the ROI.
Figure 1.

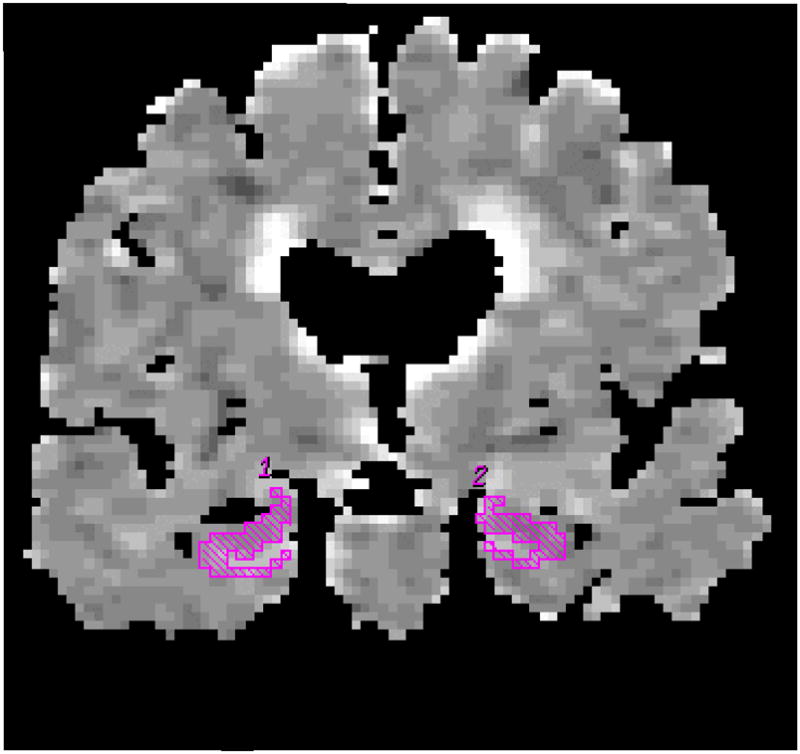
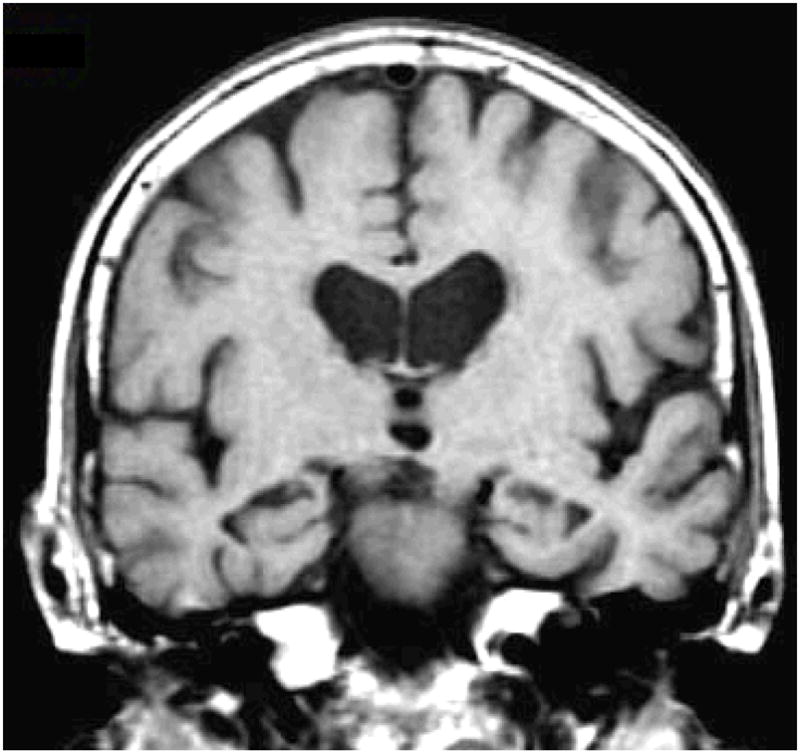
Hippocampal ROI are traced on the coronal FLAIR image (b=0 mm2/sec) (a). These ROI concurrently appear on the ADC (average) map (b). The corresponding coronal T1-weighted image is used to guide the placement of the ROI (c).
Hippocampal volume measurements were traced on T1-weighted, three-dimensional volumetric spoiled-gradient recalled echo sequence images (6). Hippocampal volumes of each subject were normalized for inter-subject variation in head size. Volumes were then converted to normal deviates, referred to as W scores, using age and gender specific normal percentile based on a previous study (7). A value of 0 =50th percentile, +1.64 = 95th percentile, −1.64 = 5th percentile among normals.
We used a series of univariate Cox proportional hazards models to separately estimate the effect of baseline hippocampal ADC, hippocampal W-scores, age, gender, education, and MMSE scores on the relative hazard of conversion from aMCI to AD. The two predictors that were significant univariately were then combined in a bivariate Cox proportional hazards model.
Results
Fifty four of the 60 cognitively normal subjects returned for follow-up and remained as normal. Two aMCI patients did not return for follow-up, and one aMCI patient developed a rapidly growing menningioma. These subjects were excluded from all further analyses. Of the 21 aMCI subjects analyzed, 12 of them converted to AD during longitudinal assessment. There were no significant differences with respect to mean age, mean education, or gender distribution between normals and patients with aMCI (p>0.05) (Table). At baseline, hippocampal ADCs of aMCI subjects were higher (p=0.02), and hippocampal W-scores were lower (p<0.001) than those of normals. The more atrophic hippocampi were associated with higher hippocampal ADC values (Pearson correlation estimate = −0.47, p =0.03) ((E)F-1). The Kaplan-Meier estimates of the probability of conversion to AD in aMCIs with hippocampal ADC values above versus at or below 888×10−6 mm2/s (median hippocampal ADC among aMCI stables) are demonstrated in Figure 2.
Table.
Demographics, hippocampal ADCs and volumes of the subjects at baseline
| Normal | All aMCI | aMCI stable | aMCI converter | |
|---|---|---|---|---|
| No. of patients | 54 | 21 | 9 | 12 |
| Age (mean ± SD in years) | 80.9 ± 7.1 | 81.8 ± 6.9 | 79.9 ± 8.6 | 83.2 ± 5.4 |
| Male / Female | 25 / 29 | 12 / 9 | 5 / 4 | 7 / 5 |
| Education (mean ± SD in years) | 13.7 ± 2.7 | 13.0 ± 3.3 | 13.2 ± 2.3 | 12.8 ± 3.9 |
| MMSE (median (interquartile range)) | 29 (28, 30) | 28 (27, 29) ** | 29 (29, 29) | 28 (27, 28) |
| Follow-up (mean ± SD in months) | 42.8 ± 12.8 | 36.4 ± 16.1 | 45.7 ± 10.7 | 29.5 ± 16.2*** |
| Hippocampal ADC × 10−6 mm2/s * (mean ± SD) | 854 ± 45 | 894 ± 66** | 859 ± 55 | 919 ± 63 |
| Hippocampal volume (mean ± SD W-scores) | 0.37 ± 1.14 | −0.85 ± 1.24** | −0.22 ± 1.11 | −1.32 ± 1.14 |
Right and left hippocampal ADC were not different among normals, nor among people with aMCI. Therefore they were averaged for all analyses.
MMSE of normals at baseline were higher than aMCI (rank-sum test p=0.02), and hippocampal ADC of aMCI patients at baseline were higher than normals (t-test p=0.02). Hippocampal volumes (W-scores) of aMCI patients at baseline were lower than normals (t-test p<0.001).
The large difference in follow-up time between aMCI stables and converters is due to censoring at the time of conversion.
Figure 2.

Kaplan-Meier plots of the estimated probability of aMCI patients remaining stable as a function of follow-up time. The plots represent aMCI patients with hippocampal ADC ≤ 888 × 10−6 mm2/s (median hippocampal ADC among aMCIs), and aMCI patients with hippocampal ADC >888 × 10−6 mm2/s.
The Cox proportional hazards model showed that both higher hippocampal ADC values (p=0.002), and lower (more atrophic) hippocampal W-scores (p=0.02) in people with aMCI at baseline are associated with a higher relative risk of progression to AD in the future ((E)F-2). Based on this model, we estimate that among aMCI subjects, a 65.8×10⁻⁶ mm2/s increase in hippocampal ADC (one standard deviation among aMCI stables), increases the relative risk of conversion to AD by a factor of 3.1 (95% confidence interval =1.5–6.4). A 1.24 point decrease in hippocampal W-scores (one standard deviation among aMCI stables) increases the relative risk of conversion to AD by a factor of 2.5 (95% confidence interval =1.0–6.2). Age, gender, education and MMSE scores were not related to time to conversion among aMCI patients (p>0.05). The likehood ratio test on the Cox proportional hazards model which included both hippocampal ADC and W-scores showed that hippocampal ADC and W-scores describe the data better than a model with only W-score (p=0.02). On the other hand, adding hippocampal W-score to a model with hippocampal ADC did not fit the data better than hippocampal ADC alone (p=0.20).
Discussion
Most people with aMCI have early AD pathology in the medial temporal limbic cortex (8). Elevated hippocampal ADC in people with aMCI who progress to AD in the near future, indicates that DWI is sensitive to subtle variations in disease stage in the hippocampus before the clinical diagnosis of AD is possible. Increased diffusivity in the brains of people with AD has been attributed to the loss of neuron cell bodies, axons and dendrites, causing expansion of the extracellular space where water diffusivity is faster (2,9,10). Loss of hippocampal neuron cell bodies, synapses and dendrites early in the pathological progression of AD lead to macroscopic structural changes in the hippocampus that can be measured by hippocampal volumetry. The negative correlation we found between hippocampal diffusivity and volume in people with aMCI, further indicates that both MR techniques are sensitive to the same neurodegenerative process in early AD.
While hippocampal ADC improved the ability of hippocampal volume measurements to predict future progression to AD in aMCI, hippocampal volume measurements did not have any additional effect on hippocampal ADC in predicting progression to AD. This finding suggests that elevated hippocampal diffusivity predicts progression to AD in aMCI as well or better than hippocampal atrophy. DWI is sensitive to alterations in water diffusivity in the hippocampus at microscopic level, which may be apparent earlier than the macroscopic change measured with hippocampal volumetry in aMCI patients who progress to AD in the future. With both techniques, overlap between values in aMCI stables and converters limit the diagnostic predictive value in individual subjects. But like MR volumetry, DWI may be useful for monitoring drug effects during the progression of aMCI to AD, for early therapeutic interventions.
Supplementary Material
Acknowledgments
Grant Support: AG11378, AG06786, AG16574.
References
- 1.Petersen RC, Doody R, Kurz A, Mohs RC, Morris JC, Rabins PV, Ritchie K, Rossor M, Thal L, Winblad B. Current concepts in mild cognitive impairment. Arch Neurol. 2001;58:1985–1992. doi: 10.1001/archneur.58.12.1985. [DOI] [PubMed] [Google Scholar]
- 2.Kantarci K, Jack CR, Xu YC, et al. Regional diffusivity of water in mild cognitive impairment and Alzheimer’s disease. Radiology. 2001;219:101–107. doi: 10.1148/radiology.219.1.r01ap14101. [DOI] [PMC free article] [PubMed] [Google Scholar]
- 3.American Psychiatric Association. Diagnostic and statistical manual of mental disorders. 3. Washington, DC: 1987. DSM-III-R. revised. [Google Scholar]
- 4.Mc Khann GM, Drachman D, Folstein M, Katzman R, Price D, Stadlan EM. Clinical diagnosis of Alzheimer’s Disease: report of the NINCDS ADRDA work group under the auspices of Department of Health and Human Services Task Force on Department of Health and Human Services Task Force on Alzheimer’s disease. Neurology. 1984;34:939–944. doi: 10.1212/wnl.34.7.939. [DOI] [PubMed] [Google Scholar]
- 5.Jack CR, Bentley MD, Twomey CK, Zinsmeister AR. MR imaging based volume measurements of the hippocampal formation and anterior temporal lobe: validation studies. Radiology. 1990;176:205–209. doi: 10.1148/radiology.176.1.2353093. [DOI] [PubMed] [Google Scholar]
- 6.Stejskal EO, Tanner JE. Spin diffusion measurements: spin-echo in presence of a time dependent field gradient. J Chem Phys. 1965;42:288–292. [Google Scholar]
- 7.Jack CR, Petersen RC, Xu Y, et al. Medial temporal atrophy on MRI in normal aging and very mild Alzheimer’s disease. Neurology. 1997;49:786–794. doi: 10.1212/wnl.49.3.786. [DOI] [PMC free article] [PubMed] [Google Scholar]
- 8.Morris JC, Storandt M, Miller JP, McKeel DW, Price JL, Rubin EH, Berg L. Mild cognitive impairment represents early-stage Alzheimer disease. Arch Neurol. 2001;58:397–405. doi: 10.1001/archneur.58.3.397. [DOI] [PubMed] [Google Scholar]
- 9.Hanyu H, Sakurai H, Takasaki M, Shindo H, Abe K. Diffusion weighted MR imaging of the hippocampus and temporal white matter in Alzheimer’s disease. J of Neurol Sci. 1998;156:195–200. doi: 10.1016/s0022-510x(98)00043-4. [DOI] [PubMed] [Google Scholar]
- 10.Sandson TA, Felician O, Edelman RR, Warach S. Diffusion weighted magnetic resonance imaging in Alzheimer’s Disease. Dement Geriatr Cogn Disord. 1999;10:166–171. doi: 10.1159/000017099. [DOI] [PubMed] [Google Scholar]
Associated Data
This section collects any data citations, data availability statements, or supplementary materials included in this article.