

Abstract
Starving Dictyostelium cells respond chemotactically to cell-generated waves of cyclic adenosine −3′,5′- monophosphate (cAMP) that guide cell aggregation toward a signaling center. In this process, a large number of cells are recruited, resulting in the formation of aggregation territories that are essential for fruiting body formation. The enzyme PdsA phosphodiesterase (PDE), a crucial component of the signaling system, breaks down the external cAMP and can be either membrane-bound or secreted. The existence of two such forms is unusual in cell biology, and it remains to be determined why they have both been maintained through evolution. Here, using a model of the cAMP signaling system, I show that colonies can successfully organize into aggregates over a wider range of initial cell densities when both forms of PDE are present in an appropriately tuned ratio than when only a single form is present. The model indicates that membrane-bound PDE maintains aggregation-territory integrity in colonies with high initial cell density, whereas the secreted form is important for wave propagation at low cell densities. Thus, the ultimate retention of both forms can increase territory size. These findings have implications for other excitable media, including Ca2+ propagation in cardiac cells and propagation of electrical excitation in nerve axons, since these systems have similar features of spatial nonuniform “release” and “degradation” of the relevant signals.
Introduction
A striking feature of Dictyostelium discoideum (Dd) is its ability to self-organize over a huge range of initial cell densities (104–106 cells/cm2) (1,2) and form large aggregation territories. This system has fascinated both experimental and theoretical biologists, leading to many studies of chemotaxis, signal transduction and gradient sensing (3,4), and aspects of development such as cell sorting, size regulation, and pattern formation (5,6). The behavior of this developmental system has also been examined (7,8). Dictyostelium is well suited for modeling because, although it is a relatively simple system, it shares most of the basic features of more complex systems. Many modeling studies have explored cell signaling and cyclic adenosine-3′,5′-monophosphate (cAMP) wave propagation (9–15), and many models of cell chemotaxis and mobility for the multicellular stage (4,16–18), as well as models of cell sorting and cell adhesion (17,19,20), gradient sensing (6,21,22), and size regulation (7,23), are available.
Here, I look at a distinct issue involving a detail of the signaling system that has not previously been addressed, namely, the functional significance of retaining two forms of PDE in these cells. PDE is an important enzyme that is implicated in the aggregation of Dd. The chemoattractant cAMP is secreted by these cells in their aggregating phase and degraded by PdsA, a phosphodiesterase (PDE) that can be either membrane-bound (PDEm) or secreted (PDEe) (24–26). Both of these forms are encoded by the same gene, and at first glance they seem to have the same function, i.e., to degrade extracellular cAMP. This raises the question: Why does Dd retain both forms, and how does each form affect the system? To date, the effects of the minor difference between the two proteins, and the mechanism that governs selection between them remain unknown. The presence of two forms of this enzyme suggests the possible emergence of an alternative splicing site within the gene, or a specific enzyme that cleaves off the membrane attachment site. One could argue that the second form of PDE emerged at some time during evolution and was never deleted, and that this novel emergence provided a functional advantage. Here I present a compelling analysis that points to the advantages of retaining both forms. I show, using a mathematical model, that the benefit of having both forms is only manifested under special conditions.
Biological background
In Dd, self-organization begins with free-ranging amoebae that feed on bacteria and multiply by cell division (1). Starved cells can spontaneously begin to secrete pulses of cAMP. The cAMP signal propagates via positive feedback and relay, inducing a similar response in other cells. A circular wave of cAMP spreads outward and is slowly degraded by either PDEm or PDEe. PDEe is regulated by a PDE inhibitor (PDI), also secreted by the cells (27). External cAMP levels drop due to diffusion and PDE activity (28), and the cells slowly become sensitive to cAMP once again. These properties are characteristic of excitable systems, such as the Belousov-Zhabotinsky reaction (29), Ca2+ waves in fertilized eggs (30), and wave propagation in cardiac muscle (31–33). An understanding of excitable systems in general can yield insights into how wave propagation and patterning are affected by changes in the various parameters, such as changes in PDE activity for the Dd signaling system.
To date, no mutants expressing only the membrane-bound or the secreted form of PDE have been found; therefore, direct experiments cannot be carried out. Until such mutants are devised, however, a mathematical model can be helpful in performing in silico experiments to test hypotheses regarding the dual roles of the two forms of PDE. That was the main purpose of the numerical analysis used in this study.
Materials and Methods
Modeling excitability of cAMP signaling system
The model presented here shows that although both the membrane-bound (PDEm) and secreted (PDEe) forms of PDE have a similar effect on excitability during Dd aggregation, they do not affect wave propagation in the same way. To explore this issue, I use a formalism that includes both cell movement and a cAMP signaling scheme suggested by Martiel and Goldbeter (9), hereafter called the M&G scheme. The full model is described in detail elsewhere (20); here, I will mention only the main features. In the model, the cells are represented as viscoelastic ellipsoids that conserve volume under deformation of any of the three semi-axes. Cell characteristics include stiffness, adhesion, locomotive force generation, and response to environmental cues. The cells also respond chemotactically to the cAMP generated by the cells' own cAMP signaling system. Equations of motion and deformation incorporate all of the forces that act on each cell from its neighbors and the external environment, leading to a net movement of all the cells. Since the main focus here is the propagation of waves and the response of the cAMP signaling system, the signaling part of the model is described here; details of the cell movement can be found in the Supporting Material. Simulations were also performed for two other signaling schemes to show the robustness of the results. The results and the equations and parameters for these schemes are given in the Supporting Material.
In the M&G scheme, the cAMP receptor can be in two different forms: active or inactive. Only binding of cAMP to the active receptor stimulates adenylyl cyclase to produce cAMP. cAMP binding also shifts the receptor equilibrium toward the inactive form. The equations of the M&G model describe the change over time for the three variables: the total fraction of receptor in active form, ρ, intracellular cAMP concentration, β, and extracellular cAMP, γ, in a well-mixed suspension. My model includes a spatial component, and the variables are associated with each individual cell in which PDEm and PDEe are distinguished, yielding the following equations:
| (1) |
| (2) |
| (3) |
where ρn is the total fraction of receptor in active form, βn is the intracellular cAMP concentration and γn is the local external cAMP concentration, where the subscript n indicates cell number γ is extracellular [cAMP]; ke_e (PDEe) and ke_m (PDEm) are the activities of external and membrane-bound PDE, respectively; D = 0.024 mm2/min is the diffusion constant for cAMP; h is a dilution factor; and ki and kt are the degradation and secretion of internal cAMP, respectively. The summation term in Eq. 3 represents the discrete cAMP contribution from all the cells. Ψn = 1 in the region where cell n is located, and zero otherwise. The parameter values; the functions f1, f2, and Φ; and details regarding handling of the cAMP are provided in the Supporting Material. Because the secretion of PDE occurs steadily and slowly over a period of several hours (34), here the PDEe levels are assumed to be uniform (see the Supporting Material).
Analysis
First, I consider the spatially uniform ρ-γ dynamics that represent an excitable system, as shown in the two-dimensional phase plane plot of Fig. 1. The ρ-nullcline shows for what values of ρ and γ, ρ does not change and the γ-nullcline shows where γ does not change. The shape and location of the nullclines and where they cross depend only on the parameters, and determine the stability of the steady state. Trajectories on the phase plane show how ρ and γ change over time, for a given parameter set, for some initial ρ and γ. The diagrams give a graphical representation of the effect of various components (e.g., cAMP receptor density and presumed PDE activity) on the shape of the nullclines and thus on the general excitability of the system.
Figure 1.
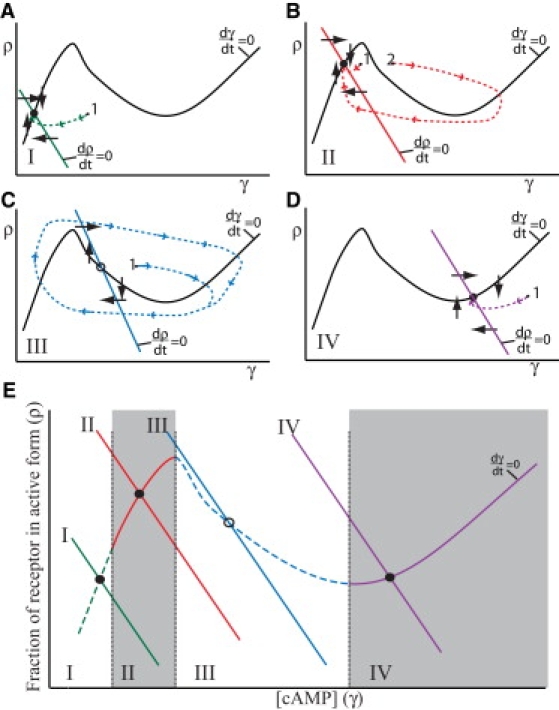
Idealized phase plane plots for an excitable system. Illustration of changes in the excitability in a field of Dictyostelium cells, showing the transitions from low (A) to high (B) excitability, continuing into the oscillatory regime (C) and finally into a nonexcitable state (D). The curves show a schematic version of the ordinary differential equations phase space for the variables ρ and γ (where ρ is the fraction of receptors in the active state, and γ is [cAMP]) based on Eqs. 1–3 for a well mixed and spatially uniform system (no subscript n), by projecting them onto two dimensions for the γ and ρ variables, and by making β = constant × γ as in previous studies (12,35). The solid black curve represents the γ nullcline (dγ/dt = 0), and the straight downward-sloping lines represent the ρ nullcline. Important attributes are the “N” shape of the γ nullcline and the point at which the two nullclines cross. The position where the nullclines cross (the steady state) indicates which excitability state the system is in. The open circle (O) indicates an unstable steady state, and the solid circle (•) indicates a stable steady state. Panels A–D show the corresponding nullclines for the four different excitability states, and panel E is the composite of all four states. The four states indicate the global excitability for a uniform system for a given set of parameters. For example, increasing the number of cAMP receptors or number of adenylyl cyclase molecules or reducing PDE activity moves the excitability of the system from state I toward state IV. (A) State I is nonexcitable or weakly excitable. (B) State II is excitable. (C) In state III the steady state is unstable and the system is oscillatory. (D) State IV is a nonexcitable state in which the steady state is at a higher [cAMP]. The arrows on the dotted lines indicate the time trajectory of two of the variables, γ and ρ, after perturbation away from the steady state. For example, in state II (B), a suprathreshold stimuli past the peak (point 1) initiates rapid cAMP production, followed by a refractory period as cAMP receptors become deactivated and cAMP levels drop and then begin to recover, which demonstrates excitability. If the stimulus is subthreshold (point 2), the system quickly relaxes back to the steady state. As the steady state moves closer to state III, the necessary threshold stimulus gets smaller and smaller until the system undergoes a bifurcation and becomes unstable, and γ and ρ levels oscillate in a periodic fashion (C). In state I or IV, the system returns directly back to the steady state regardless of the size of the stimulus (A and D). Panel E shows where the state transitions occur, as determined by where the ρ nullcline crosses the γ nullcline.
Fig. 1, A–D, shows four different plots, each in a different state of excitability, and Fig. 1 E shows a composite of all four phase plots. The activity of PDE is important in explaining possible state transitions in Fig. 1, although other factors can also affect such transitions. When the activity of PDE is too high (Fig. 1 A), cAMP is degraded rapidly, and no cAMP waves propagate. The system is then in the low [cAMP] nonexcitable state (state I). As the PDE activity decreases, the system moves toward state II and is weakly excitable. If cAMP waves are initiated, they begin to propagate but quickly die out. A further decrease in PDE activity brings the system into state II, where it is excitable and cAMP waves can propagate (Fig. 1 B). At even lower PDE activity, the system enters state III (Fig. 1 C), the steady state becomes unstable, and cells become oscillatory, but waves can still propagate when the cells are entrained by a signaling center. For really low PDE activity, the system becomes nonexcitable (state IV). Here, the steady state is again stable, but at a higher cAMP concentration, and cAMP waves cannot propagate.
In a spatially nonuniform system, diffusion removes the secreted cAMP from the immediate surroundings of the cell and thus, like PDE, also reduces local excitability. Other factors, such as increases in the number or affinity of the cAMP receptors, PDI secretion, number of adenylyl cyclase molecules, or increase in local cell density all make the system more excitable (the intersection of the ρ and γ nullclines in Fig. 1 moves to the right).
These state transitions can be linked to the developmental changes observed in Dd cells after they undergo starvation. At the onset of starvation, the cells are in state I. As time goes on, the cells begin to increase the expression of a number of molecules, such as cAMP receptors and adenylyl cyclase (36), and PDE activity is lowered. This slowly moves the system into state II. Some cells may move all the way to state III and become pacemakers either temporarily or permanently (12). Once the cAMP waves propagate, the cells begin to reduce the expression of several molecules, such as cAR1 and PdsA (37), and the increase in excitability is halted. This ensures that the system will remain in either state II or state III, where cAMP wave propagation is possible.
We can study how PDE activity affects the stability of the whole system (Eqs. 1–3) by looking at changes in the three eigenvalues (Eigs) of the stability matrix (Table 1). There are two noticeable key transitions: at high PDE, all Eigs are negative and the steady state is stable, whereas at lower PDE = 9, Eig1 and Eig2 are still negative but are now a complex conjugate pair, suggesting a small oscillation of the variables toward the stable steady state. The transition from PDE = 8 to PDE = 7.9 is a Hopf bifurcation in which the real part of Eig1 and Eig2 becomes positive and the steady state becomes unstable. Since the system of equations is bounded, this gives rise to spontaneous oscillations in the variables around the steady state. As PDE drops from 1.2 to 1.1, the real parts of Eig1 and Eig2 become negative again and the steady state becomes stable. Here the steady state is at a high γ = 0.255 and is not excitable.
Table 1.
Eigenvalues and steady states of the M&G model for different values of PDE
| PDE | ρ | β | γ | Eig1 | Eig2 | Eig3 |
|---|---|---|---|---|---|---|
| 0.5 | 0.0631 | 0.435 | 0.391 | −0.12 + 0.462i | −0.12 – 0.462i | −2.45 |
| 1.1 | 0.112 | 0.623 | 0.255 | −0.00307 + 0.549i | −0.00307 – 0.549i | −3.21 |
| 1.2 | 0.120 | 0.648 | 0.243 | 0.0116 + 0.553i | 0.0116 – 0.553i | −3.34 |
| 7.0 | 0.533 | 0.855 | 0.055 | 0.306 + 0.084i | 0.306 – 0.084i | −9.65 |
| 7.1 | 0.545 | 0.836 | 0.053 | 0.304 + 0.0282i | 0.304 – 0.0282i | −9.75 |
| 7.2 | 0.557 | 0.815 | 0.0509 | 0.373 | 0.227 | −9.85 |
| 7.9 | 0.741 | 0.414 | 0.0236 | 0.0856 + 0.0656i | 0.0856 – 0.0656i | −10.2 |
| 8.0 | 0.775 | 0.338 | 0.019 | −0.0299 + 0.175i | −0.0299 – 0.175i | −10 |
| 9 | 0.833 | 0.223 | 0.0112 | −0.389 + 0.138i | −0.389 – 0.138i | −10.4 |
| 9.5 | 0.842 | 0.207 | 0.00981 | −0.597 | −0.366 | −10.7 |
| 10 | 0.849 | 0.197 | 0.00884 | −0.774 | −0.336 | −11 |
| 15 | 0.877 | 0.162 | 0.00486 | −1.44 | −0.335 | −15.4 |
Results
PDEm/PDEe and cell density affect aggregation and mound formation
The time it takes for a cell to progress from state I to state II or III depends on (among other things) the initial cell density at the onset of starvation. Increasing the cell density increases the local excitability, since cAMP secretion per unit area is higher when the cells are closer together. During aggregation, local cell density increases as the cells move toward signaling centers. This local increase in density can cause cells to become pacemakers that compete with the original signaling center, resulting in the aggregation territory breaking up into many smaller territories.
Cell density, PDE activity, and the PDEm/PDEe ratio all affect Dd aggregation and mound formation. In my simulations, a few cells in the center of an aggregate were made more excitable by increasing the number of cAMP receptors by 30%, effectively making them pacemakers. These pacemaker cells periodically initiate outward, propagating circular cAMP waves that trigger a relay of the cAMP signal and chemotaxis in the rest of the aggregation territory. Fig. 2 A shows that when PDEm/PDEe ≈ 7, aggregation proceeds normally, forming one large mound. However, when PDEm/PDEe ≈ 1 (Fig. 2 B), aggregation is interrupted once the streams begin to form, resulting in the formation of many smaller mounds. This can be explained by the fact that the increase in cell density during stream formation makes the system more excitable, triggering a transition from state II to state III. This gives rise to new regions in which the cells become pacemakers that begin to signal and initiate new territories. The increase in excitability at higher cell densities is reduced when the PDEm/PDEe ratio is high, because the PDEm activity per unit volume also increases with increased cell density. Therefore, with a high PDEm/PDEe ratio, initiation of new pacemaker regions is deterred, aggregation is not disrupted, and a single large mound forms. At this cell density, a single large mound forms even for PDEe = 0 (results not shown). Although both pacemakers and rotating spiral waves can act as a signaling center, I used pacemakers in this work because they are easier to initiate. The results are qualitatively similar; however, if the signaling center is a spiral, a hollow core often forms in the mound and the core slowly fills in (Fig. S1). Movies corresponding to the figures for many of these simulations are provided in the Supporting Material.
Figure 2.
PDEm/PDEe ratios affect aggregation. Aggregation of 10,000 Dd cells in response to cAMP waves initiated from the pacemaker cells (red) in the center, for different PDEm/PDEe ratios. (A) PDEm = 5.1 and PDEe = 0.7, and only one large aggregation center forms. (B) PDEm = 1.75 and PDEe = 1.75, and new pacemaker regions arise as the cell density increases. As a result, many smaller aggregation centers form. The time is in minutes (as indicated). The domain size is 2 × 2 mm. The values for PDEm and PDEe were adjusted so that the wave propagation would be the same in A and B if the cells were immobilized.
These results demonstrate that at a low PDEm/PDEe ratio, the aggregation territory can break up into smaller territories due to the formation of multiple signaling centers, and this can be prevented by an increase in the fraction of PDEm.
PDEe can stimulate wave propagation at low cell densities
To separate the contributions of PDEe versus PDEm, wave propagation was explored for various cell densities and levels of PDEe or PDEm. The PDE levels were systematically varied from high to low, to cover all possible states of excitability for the system. In each case, the cells were immobilized so that the excitability could be studied at fixed cell densities. At high or low PDE values, the system is in nonexcitable state I or IV, respectively, and at intermediate PDE values the system can be in state II or III (Fig. 1).
Fig. 3 A (i) shows the cAMP wave propagation (blue) and cell distribution (green) as viewed from above for six different time points. Fig. 3 A (ii) and Fig. 3, B–D, show the corresponding space-time plot for different cell densities and selected PDE values. By gradually increasing the level of either PDEe or PDEm while maintaining the level of the other form at zero, one can easily see their separate contributions to wave propagation. This is particularly evident at cell densities below a threshold level.
Figure 3.
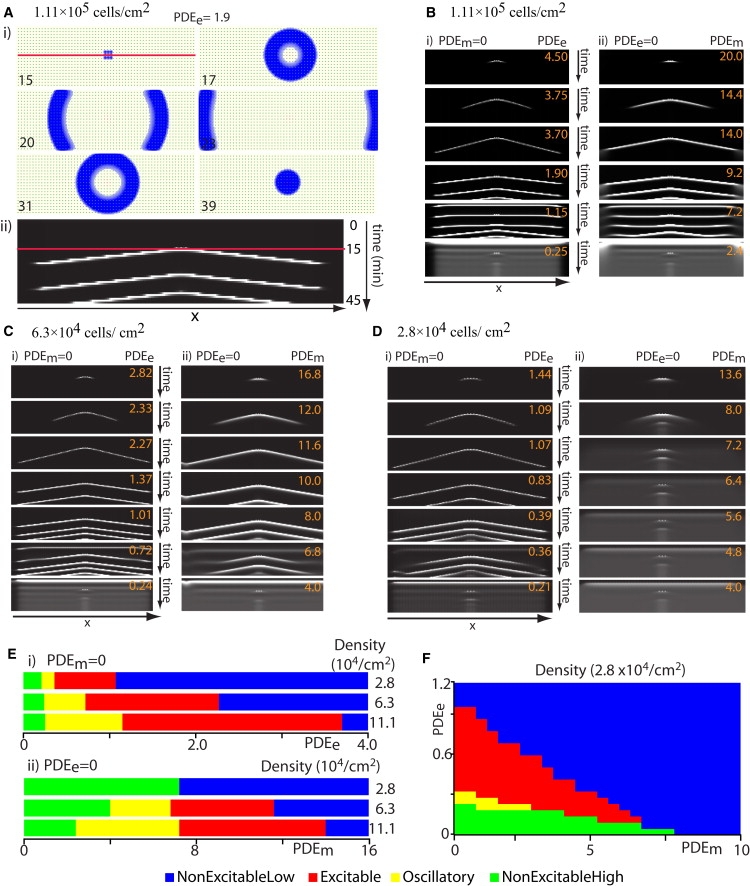
Cell density affects cAMP wave propagation. Simulations of cAMP wave propagation in a field of immobilized Dd cells for different cell densities. A cAMP pulse is initiated at 15 min by raising the external [cAMP] around nine central cells (e.g., blue square, first frame of A (i)). Ten minutes later, the number of cAMP receptors was permanently increased 30% for the same nine cells in the center. For a certain range of PDE values, these cells transform into pacemakers that initiate the successive waves emerging after the first stimulus. Cells are uniformly distributed on a domain with a 0.1 mm wide, cell-free buffer zone at the boundaries. Panel A (i) Shows cAMP wave (blue) and cells (green) at indicated times (minutes) for PDEe = 1.9 and PDEm = 0. Panel A (ii) shows the temporal changes in the [cAMP] profile on a line drawn through the center of the aggregation field recorded at 1 min intervals. The red line in A (i) corresponds to the red line in A (ii). Each row of pixels represents a [cAMP] profile, through the center of the field, at the given time. The total time for all the simulations was 45 min. Light intensity indicates [cAMP]. The wave speed can be determined from the slope. For panels B–D, PDEm = 0 in the left column (i) and PDEe = 0 in the right column (ii). (B) Cell density = 1.11 × 10⁵/cm2; domain size = 2.2 × 0.9 mm with 1200 cells; [cAMP] profiles through the center of the field over time for different values of PDEm, and PDEe (i) PDEe range: 0.25–4.5 and (ii) PDEm range: 2.4–20. Notice that as PDE values are reduced, the wave period is shortened. At low PDE values (PDEe ≤ 1.15 or PDEm ≤ 7.2), the whole field of cells is oscillatory. This is indicated by a horizontal line (slope = 0) and occurs before the initial external cAMP stimulus. The cells in the center have a shorter period and eventually entrain the other oscillatory cells (emergence of a slope in the middle). At even lower PDE values (PDEe ≤ 0.25 or PDEm ≤ 2.4), the system is in a high [cAMP] steady nonexcitable state. (C) Cell density = 6.3 × 10⁴/cm2; domain size = 2.6 × 1.1 mm with 1200 cells; PDEm and PDEe as indicated when (i) PDEm= 0 and (ii) PDEe= 0. Waves cannot propagate for PDEe ≥ 2.3 or PDEm ≥ 12, and oscillations for all the cells occur when PDEe ≤ 0.72 or PDEm ≤ 6.8 for (i) and (ii), respectively. At the very low PDE values (PDEe ≤ 0.24 or PDEm ≤ 4.0), the system is in a steady nonexcitable state. (D) Cell density = 2.8 × 10⁴/cm2; domain size = 3.3 × 1.5 mm with 1000 cells. (i) PDEm = 0. Waves cannot propagate for PDEe ≥ 1.09 or PDEe ≤ 0.21. Oscillations occur when PDEe ≤ 0.36. (ii) PDEe = 0. Waves cannot propagate for any value of PDEm. (E) Summary of the findings from panels B–D, where rows 1–3 in (i) and (ii) correspond to columns (i) and (ii) in B–D. In both (i) and (ii) the range of PDE values in which cAMP waves can propagate (i.e., yellow and red corresponding to states II and III in Fig. 1) shrinks as the cell density is lowered. (i) With only PDEe, cAMP waves can propagate at low densities (2.8 × 10⁴/cm2). (ii) With only PDEm, at low density (2.8 × 10⁴/cm2), there is no value of PDEm at which the system is either oscillatory or excitable, and cAMP waves cannot propagate. (F) Plot showing what “state” the steady state is in for different values of PDEm (x axis) and PDEe (y axis), at cell density = 2.8 × 10⁴/cm2. Color code for the steady states: blue, nonexcitable at low [cAMP]; red, excitable; yellow, oscillatory; and green, nonexcitable at high [cAMP].
At a cell density of 1.11 × 10⁵ cells/cm2 and high activity of either PDEe or PDEm, wave propagation is inhibited (Fig. 3 B, first row). As PDE values are lowered (Fig. 3 B, second row), waves begin to propagate but then die out (since the field is not excitable enough to sustain the wave). At lower PDE values, the waves propagate fully (Fig. 3 B, third row) and sometimes the modified cells become pacemakers (Fig. 3 B, fourth row). As PDE values are lowered further, wave propagation is impeded because the whole system becomes oscillatory (Fig. 3 B, fifth row). Notice, however, that after a while the waves begin to propagate as other cells become entrained by the nine central pacemaker cells. At very low PDE activity, the system saturates at a constant high cAMP level (Fig. 3 B, sixth row). When cell density is decreased to 6.3 × 10⁴ cells/cm2, similar results are observed, except that wave propagation occurs over a narrower range of PDE when PDEe = 0 (Fig. 3 C (ii)) compared to PDEm = 0 (Fig. 3 C (i)).
At even lower cell density (2.8 × 10⁴ cells/cm2), cAMP waves do not propagate for any value of PDEm when PDEe = 0 (Fig. 3 D (ii)). At the higher PDEm values, the wave just dies out (Fig. 3 D (ii) upper rows), and at the lower PDEm values, the system reaches a nonexcitable steady state at elevated cAMP levels (Fig. 3 D (ii) lower rows, gray background rather than black). This presumably corresponds to a direct transition from state I to IV without going through state II and III. In contrast, when PDEm = 0, and over a range of PDEe activity, the system is still excitable and waves can propagate at very low cell densities (Fig. 3 D (i)). Fig. 3 E (i) and (ii) summarize these findings for the three different densities, with each color indicating a specific excitability state. The figure shows that if PDEe = 0, the range of PDEm activity (width of the yellow and red regions), consistent with cAMP wave propagation, gets smaller with decreasing cell density until (below some threshold density) the waves cannot propagate for any PDEm activity. However, in the presence of PDEe activity, PDEe = 0.36–1.07, and PDEm = 0, the system can remain excitable (yellow and red regions) at low cell densities. The addition of small amounts of PDEe (>0.15) to a system with only PDEm can rescue cAMP wave propagation at a cell density of 2.8 × 10⁴ cells/cm2 for a range of PDEm values (Fig. 3 F). Bear in mind that the exact transition point (PDEm/PDEm ratio) at which wave propagation becomes possible depends markedly on which model of the cAMP signaling system is used.
To verify that the findings from Fig. 3 are not exclusive to the M&G model and can be generalized to other excitable systems, I repeated the same simulations on two different models: 1), a more recent model of the cAMP signaling system developed by Halloy et al. (38); and 2), a generic excitable system, a two-variable Oregonator model that is based on the Belusov-Zhabotinsky reactions and adapted from Krug et al. (39). The results and equations (see Fig. S2 and Fig. S3) demonstrate the same phenomena, i.e., wave propagation is disrupted at low densities when the sources and sinks are discrete and located in the same place. I also found that the Eigs for the stability matrix in these models have the same two necessary key transitions as the M&G model (Fig. S2 and Table S3).
cAMP release for a single cell in a large domain
To understand why cAMP waves do not propagate below the threshold density for any value of PDEm when PDEe = 0, but they do when PDEe > 0, I placed a single cell in the center of a large domain (31 × 31 cell diameters, or 310 × 310 μm) with periodic boundary conditions to simulate very low cell density conditions, and then stimulated it with a fixed cAMP signal at 10 min. The amount of cAMP secreted in response to the stimulus was recorded. Recall that cAMP waves only propagate if the response to a cAMP stimulus is large enough to stimulate the neighbor cells. The graphs in Fig. 4 show the change in external cAMP concentration, γ (solid line), and the fraction of cAMP receptors in active form, ρ (dashed line), for that one cell. For PDEm = 0, a range of PDEe activities, which were uniform over the whole domain, were found that resulted in the cAMP stimulus initiating a large cAMP pulse (total area under the solid γ line). This pulse was significant enough to propagate waves (Fig. 4 A, solid line). For both higher and lower PDEe activities, the initiated pulse was smaller (Fig. 4, B and G). In contrast, when PDEe = 0 (now cAMP is only degraded in the grid square where the cell is located), regardless of PDEm activity, the response to the cAMP stimulus was small (the area under the solid line is much smaller in Fig. 4, C and D). This pulse is too small to initiate a new cAMP pulse from a nearby cell at low cell densities, and thus cAMP waves would not propagate.
Figure 4.
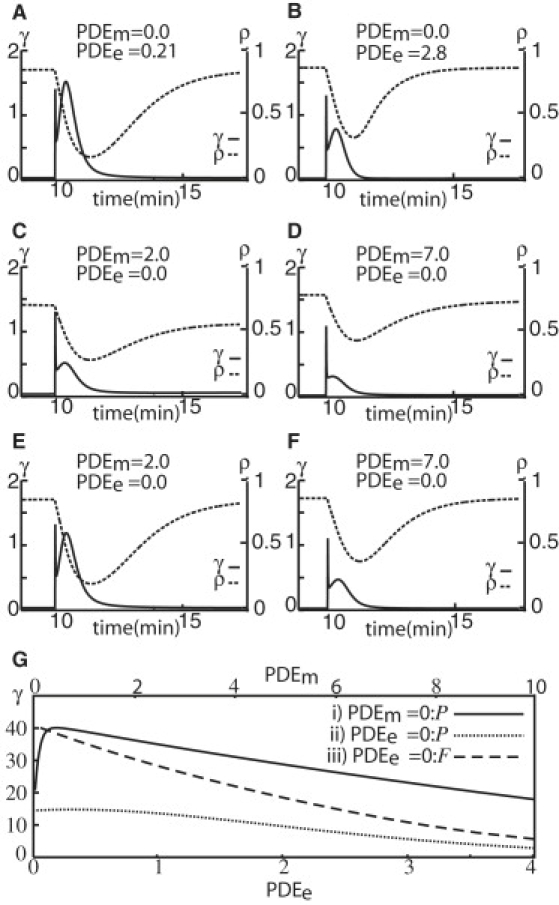
Temporal change in local [cAMP], γ, and fraction of active receptor, ρ, for a single cell for selected PDEm and PDEe values. (A–F) γ is shown on the left vertical axis, and ρ is shown on the right axis. The cell was stimulated with a cAMP signal at 10 min. The domain size was 0.3 × 0.3 mm with periodic boundary conditions (P) for A–D, and fixed (F) for E and F. (A and B) PDEm= 0, and PDEe is uniformly distributed on the domain. The PDEe values were 0.21 (A) and 2.8 (B). A large cAMP pulse was observed for PDEe = 0.21. (C and D) PDEe= 0, and the PDEm values were 2 (C) and 7 (D). Note that the cAMP response from the cell is much less than in A and B, and the fraction of active receptors continues to drop when PDEm activity is low (C). (E and F) The same PDEm activity as in C and D, respectively, but with fixed (F) boundary conditions. Now a large cAMP pulse is observed for low PDEm (E) because the boundary acts as a sink for the cAMP. (G) The size of the cAMP, γ, pulse secreted in response to a cAMP stimulus as a function of PDEe (PDEm). The curve was produced by successively increasing PDEe (PDEm) from 0 to 4 (10) and computing the total cAMP secreted for 5 min after the cAMP stimulus (the area under the γ curve in A–F) for each PDEe (PDEm). (i, solid line) PDEm= 0 and PDEe is varied from 0 to 4 (lower x axis). (ii, dotted line) PDEe= 0 and PDEm is varied from 0 to 10 (upper x axis). (iii, dashed line) The same as ii, but with fixed boundary conditions (F).
This reduced response when PDEe = 0 can be explained as follows: Quiescent cells secrete a basal amount of cAMP, some of which diffuses too far away to be degraded. When the PDEm activity is low, [cAMP] in the rest of the domain increases because cAMP is degraded very slowly and only in the immediate neighborhood of the cell. These elevated [cAMP] levels around the cell act as a buffer; cAMP continuously diffuses back into the neighborhood of the cell, preventing the cell from reactivating all its cAMP receptors. As a consequence, the cell's response to a cAMP stimulus is still a small pulse (Fig. 4 C) despite the low PDEm activity (i.e., the system is in state IV as shown in Fig. 1). When the simulation is continued for 1000 min, the external cAMP concentration slowly builds up, the fraction of active receptors continues to drop, and the cell becomes even less responsive to a new external stimulus (simulation not shown). At higher PDEm activity (Fig. 4 D), most of the cAMP produced is quickly broken down, the receptors recover more effectively, and cAMP levels away from the cell do not build up. However, the high PDEm activity degrades cAMP around the cell very rapidly and the cAMP response to a stimulus is severely reduced. Lowering PDEm takes the system straight from state IV into the nonexcitable state I (Fig. 1). This can explain why the parameter range in which cAMP waves can propagate (states II and III in Fig. 1) shrinks or disappears altogether as the cell density is decreased.
On the other hand, with fixed cAMP boundary conditions (γ = 0 at the boundary), which emulates high PDE activity at the edges of the domain, a cAMP stimulus can trigger a cAMP pulse large enough to propagate waves, when PDEe = 0, for some low PDEm activity (Fig. 4 E). The boundary now acts as a sink for cAMP, which suffices to prevent the “buffer” effect. At high PDEm activity (Fig. 4 F) the response is, as expected, small. The conclusion is that as long as the cAMP sink (cAMP removal) is not located at the same place as the cAMP source (the cell), the system will have a range of PDE values in which waves can propagate. Fig. 4 G shows that the size of the cAMP pulse in response to a cAMP stimulus reaches a maximum for some PDEe or PDEm activity and then falls off on either side. When PDEe = 0 with periodic boundary conditions (Fig. 4 G (ii), dotted line), the total cAMP response is too small for any value of PDEm to trigger a large enough response in a neighboring cell. In fact, the maximum response when PDEe = 0 (dotted line), is almost four times smaller than the maximum response when PDEm = 0 (solid line). The dashed line in Fig. 4 G shows that for fixed boundary conditions, the cAMP response is high for a range of low PDEm values when PDEe = 0, suggesting that the cAMP wave propagation can be restored for PDEe = 0 if cAMP is degraded at the boundary.
Overall, the above results demonstrate that PDEm decreases the excitability that accompanies increases in local cell density during aggregation, preventing the formation of local pacemaker regions. In addition, the results show that PDEe is necessary for cAMP waves to propagate at very low Dd cell densities. This suggests that having two forms of PDE expands the range of cell densities in which waves can propagate, and that each form of PDE is advantageous under different environmental conditions.
Discussion
It has been shown both experimentally (28) and numerically (9,10) that PDE is necessary for cAMP wave propagation, but until now there has been no attempt to explain why Dd retains both a membrane-bound and a secreted form of PDE. To date, no mutants that express only one form of PDE have been identified. Therefore, under the current conditions, it is difficult to experimentally determine the advantage that each form confers to Dd. For this reason, I used a mathematical model based on previously assembled cell motility simulations and signaling systems to explore what advantage is imparted to Dd by having both forms of PDE instead of only one. I found that the benefit of both forms is only manifested under special conditions: failure to aggregate at very low densities if PDEe = 0, or the possible formation of many smaller aggregation territories if PDEm = 0. This model not only explains the benefits of having two forms of PDE, it also has implications for other excitable systems. Indeed, I argue that having both forms provides a competitive advantage. By regulating the PDEm/PDEe ratio, Dd can take advantage of the different effects that PDEm and PDEe have on the excitability of the cAMP signaling system to extend the range of densities in which aggregation is possible. Based on these results, I propose that both the membrane-bound and secreted forms of PDE were selected for in Dd, and are not merely relics of evolution that were not deleted.
A high PDEm/PDEe ratio reduces the likelihood that the Dd aggregation territory will break up. PDEm makes the system less sensitive to the increases in cell density that occur during aggregation. If the PDEm/PDEe ratio becomes too low, spontaneous oscillating centers can form when the cell density increases during aggregation. This disrupts the aggregation and leads to the formation of many aggregation centers, giving rise to smaller territories. This could also explain why successive cAMP pulses or waves increase the amount of PDEm expressed on the cell membrane (40).
Secreted PDE enables cAMP wave propagation at low cell densities
When cells lack PDEe and the average distance to a neighboring cell is many cell diameters, cAMP waves do not propagate. This is because at modest PDEm activity, a buffer of low [cAMP] forms away from the cell. That impedes cAMP from diffusing away from the cell, lowers the fraction of receptors in active form, and results in a weak response from the cells to a cAMP stimulus. At higher PDEm activity, the cAMP buffer does not form, but instead the degradation of cAMP around the cell becomes too rapid. This suppresses the signaling system, and the cAMP response remains small. In conclusion, below a threshold cell density, cAMP waves cannot propagate if PDEe = 0. Some PDEe activity is needed.
PDE activity is important for Dd mound size regulation
Mound size regulation in Dd is achieved by at least three different developmental mechanisms (23). The first occurs during early aggregation when distinct aggregation territories are formed, and here the excitability of the cAMP signaling system (and thus PDE) clearly plays an important role. The second mechanism occurs during late aggregation, and it has been shown that a secreted cell counting factor (CF) is involved in breaking up the aggregation streams if the cell density is too high (41). The third mechanism breaks up an excessively large mound into a smaller mound.
Here I propose that PDE activity may also be involved in modulating stream breakup during late aggregation. Several mutants are defective in size regulation, including the PDI− (12), PDE overproducer (28), smlA− (42), and countin− mutants (42). The high levels of CF found in smlA− break up the aggregation streams into smaller domains, whereas CF is inactive in countin−, resulting in the formation of very large fruiting bodies (42). Jang and Gomer (23) pointed out that exogenous application of CF reduces cell-cell adhesion. On the basis of simulations, they suggested that it is this loss of adhesion, combined with motility forces, that is responsible for the breaking-up of the stream into smaller domains. This may not be the whole story, however, since it was previously shown (16) that cells can aggregate and form a single mound even in the absence of cell-cell adhesion as long as the cAMP wave propagation continues. It is reasonable to assume that cell-cell adhesion plays a role in the breakup, because the likelihood of breakup is enhanced if cell-cell adhesion is reduced. However, the local excitability of the cAMP signaling system in the streams is also quite important, as shown in Fig. 2 B (low PDEm/PDEe ratio), where the streams break up into many smaller centers. Indeed, it has been shown that CF upregulates the cAMP-induced cAMP signal (41), and this could move the system from being in the excitable state II into the oscillatory state III, triggering breakup. The same effect could be achieved by reducing PDEm levels. The likelihood that this breakup will occur is enhanced when cell-cell adhesion is reduced at the same time.
Since the M&G model is a simplified representation of the cAMP signaling system, the results shown here are qualitative trends, not absolute values, and hence cannot be used to predict the exact concentration of PDE and cell density at which transitions from excitability occur (Fig. 1). However, these transitions can be demonstrated by exploring the full range of PDE activities, from high to low for both membrane-bound and secreted forms: PDEm activity reduces the likelihood of stream breakup, leading to larger mounds, whereas PDEe activity ensures that long-distance aggregation takes place at low cell densities. Overall, the presence of both forms of PDE helps to increase the mound size. Once the cells have been recruited to the aggregation streams, Dd can use other mechanisms, such as CF, to regulate the mound size.
Future experiments to verify the differential roles of PDEm and PDEe
As noted above, despite much effort, mutants with only PDEm or PDEe are not yet available. Moreover, the significance of the distinct forms of PDE becomes apparent only under special circumstances. Thus, phenotypes lacking one or the other form might easily be overlooked during standard mutant-screening procedures. The model presented here can help suggest which mutants should be tested, and what types of conditions they should be challenged with, to observe the predicted phenotypic outcome. For instance, Dd with only PDEm and plated at low density would result in no wave propagation and the Dd cells would fail to aggregate. A number of experiments are still needed to verify the predictions of this model. PDEm or PDEe knockout mutants are needed to carry out these experiments. I predict that the aggregation territories would be smaller for a mutant with no PDEm. It should be possible to observe the wave breakup during stream formation using dark-field optics and time-lapse video. Mutants that lack the secreted PDE should aggregate very poorly at low densities, but the aggregation could be rescued by plating them on agar containing low levels of PDE.
Alternatively, as an indirect support, a PdsA mutant that has neither PDEm nor PDEe could be challenged to aggregate under controlled external PDE levels and different cell densities. It has been shown that external PDE levels are capable of rescuing such a mutant (43). These data are consistent with and support the simulations presented here. For some initial cell densities, the aggregation territories that form should be smaller than those formed in the wild-type, and one should be able to observe the wave breakup during late stream formation. Mutants in which the protein kinase A-mediated cAMP pulse-induced transcription of PDE is inhibited have many smaller aggregation territories compared to wild-type, but they still show periodic cAMP oscillations (44). This is consistent with the model indicating that PDE activity must increase at higher cell densities to prevent the formation of many oscillating centers.
Implications for other excitable systems
The results shown here for Dd are applicable to many excitable systems that have similar dynamics. The simulations demonstrate that PDEm and PDEe do not affect the excitability of the system in the same manner. Further, they show why PDEm by itself is not sufficient to excite the system at low cell densities. This effect of excitable systems in Dd, where the cells are the point sources, has general implications for other excitable systems. In an excitable system with only point sources, the ability to propagate waves as the distance between the point sources increases is significantly diminished if the sinks (activity of PDE) are located next to the sources (cAMP secretion), as opposed to when the sinks are more uniformly distributed over the plane. Wave propagation with discrete sources is common in biological systems. This excitability has been studied extensively in various systems, including signal propagation across the nodes of Ranvier in a nerve fiber (45), Ca2+ waves in oocytes (30,46), and Ca2+ wave propagation in cardiac cells (33,47). These systems behave differently when the system is assumed to be spatially nonuniform. Although it has been shown that wave speed is affected by the distance between the signal sources, and that wave propagation fails when the point sources are located too far apart (47–50), not much attention has been given to the spatial distribution of the sinks. This might have implications for development if the system has at least two cell types: one that produces and secretes a signaling molecule (a source), and one that contains enzymes that break down that signaling molecule (a sink). When these two cell types are attached to each other, wave propagation of the signal may be prevented, but if the cells move away and separate, wave propagation may be enabled because now the sinks and sources are not at the same location.
In summary, the appearance of two forms of PDE in Dd is not due to mere redundancy or duplication. I argue that the secreted and membrane-bound forms play distinct roles in a variety of circumstances. Although this dichotomy may not be seen in many normal cases, I have shown that when onset of starvation occurs at low or high cell density, a selective advantage ensues for cells that have both forms. I also extended previous findings to show how the location of the sinks also affects the overall excitability of the system. Similar ideas may apply more generally to excitable systems with discrete interconnected elements.
Acknowledgments
I thank Leah Keshet, Giselle Thibaudeau, and Carol Wenzel for many useful suggestions in the preparation of this manuscript, and Brian Ma for other help.
This work was supported in part by a grant from the National Sciences and Engineering Research Council of Canada (grant No. RGPIN249789).
Supporting Material
References
- 1.Bonner J.T. 2nd ed. Princeton University Press; Princeton, NJ: 1967. The Cellular Slime Molds. [Google Scholar]
- 2.Gingle A.R. Critical density for relaying in Dictyostelium discoideum and its relation to phosphodiesterase secretion into the extracellular medium. J. Cell Sci. 1976;20:1–20. doi: 10.1242/jcs.20.1.1. [DOI] [PubMed] [Google Scholar]
- 3.Song L.L., Nadkarni S.M., Bodeker H.U., Beta C., Bae A. Dicyostelium discoideum chemotaxis: threshold for directed motion. Eur. J. Cell Biol. 2006;85:981–989. doi: 10.1016/j.ejcb.2006.01.012. [DOI] [PubMed] [Google Scholar]
- 4.Iglesias P.A., Devreotes P.N. Navigating through models of chemotaxis. Curr. Opin. Cell Biol. 2008;20:35–40. doi: 10.1016/j.ceb.2007.11.011. [DOI] [PubMed] [Google Scholar]
- 5.Meinhardt H. Models of biological pattern formation: from elementary steps to the organization of embryonic axes. Curr. Top. Dev. Biol. 2008;81:1–63. doi: 10.1016/S0070-2153(07)81001-5. [DOI] [PubMed] [Google Scholar]
- 6.Janetopoulos C., Firtel R.A. Directional sensing during chemotaxis. FEBS Lett. 2008;582:2075–2085. doi: 10.1016/j.febslet.2008.04.035. [DOI] [PMC free article] [PubMed] [Google Scholar]
- 7.Roisin-Bouffay W., Gomer R.H. How to reach the right size? Med. Sci. (Paris) 2004;20:219–224. doi: 10.1051/medsci/2004202219. [DOI] [PubMed] [Google Scholar]
- 8.Urushihara H. Developmental biology of the social amoeba: history, current knowledge and prospects. Dev. Growth Differ. 2008;50:S277–S281. doi: 10.1111/j.1440-169X.2008.01013.x. [DOI] [PubMed] [Google Scholar]
- 9.Martiel J.L., Goldbeter A. A model based on receptor desensitization for cyclic AMP signaling in Dictyostelium cells. Biophys. J. 1987;52:807–828. doi: 10.1016/S0006-3495(87)83275-7. [DOI] [PMC free article] [PubMed] [Google Scholar]
- 10.Tyson J., Murray J. Cyclic AMP waves during aggregation of Dictyostelium amoebae. Development. 1989;106:421–426. doi: 10.1242/dev.106.3.421. [DOI] [PubMed] [Google Scholar]
- 11.Tang Y., Othmer H.G. Excitation, oscillations and wave propagation in a G-protein based model of signal transduction in Dictyostelium discoideum. Philos. Trans. R. Soc. Lond. 1995;B349:179–195. doi: 10.1098/rstb.1995.0102. [DOI] [PubMed] [Google Scholar]
- 12.Palsson E., Lee K.J., Goldstein R.E., Franke J., Kessin R.H. Selection for spiral waves in the social amoebae Dictyostelium. Proc. Natl. Acad. Sci. USA. 1997;94:13719–13723. doi: 10.1073/pnas.94.25.13719. [DOI] [PMC free article] [PubMed] [Google Scholar]
- 13.Laub M.T., Loomis W.F. A molecular network that produces spontaneous oscillations in excitable cells of Dictyostelium. Mol. Biol. Cell. 1998;9:3521–3532. doi: 10.1091/mbc.9.12.3521. [DOI] [PMC free article] [PubMed] [Google Scholar]
- 14.Goldbeter A. Computational approaches to cellular rhythms. Nature. 2002;420:238–245. doi: 10.1038/nature01259. [DOI] [PubMed] [Google Scholar]
- 15.Maeda M., Lu S.J., Shaulsky G., Miyazaki Y., Kuwayama H. Periodic signaling controlled by an oscillatory circuit that includes protein kinases ERK2 and PKA. Science. 2004;304:875–878. doi: 10.1126/science.1094647. [DOI] [PubMed] [Google Scholar]
- 16.Palsson E., Othmer H. A model for individual and collective cell movement in Dictyostelium discoideum. Proc. Natl. Acad. Sci. USA. 2000;97:10448–10453. doi: 10.1073/pnas.97.19.10448. [DOI] [PMC free article] [PubMed] [Google Scholar]
- 17.Dormann D., Vasiev B., Weijer C.J. Becoming multicellular by aggregation; the morphogenesis of the social amoebae Dictyostelium discoideum. J. Biol. Phys. 2002;28:765–780. doi: 10.1023/A:1021259326918. [DOI] [PMC free article] [PubMed] [Google Scholar]
- 18.Vasiev B., Weijer C.J. Modelling of Dictyostelium discoideum slug migration. J. Theor. Biol. 2003;223:347–359. doi: 10.1016/s0022-5193(03)00103-6. [DOI] [PubMed] [Google Scholar]
- 19.Umeda T., Inouye K. Cell sorting by differential cell motility: a model for pattern formation in Dictyostelium. J. Theor. Biol. 2004;226:215–224. doi: 10.1016/j.jtbi.2003.08.016. [DOI] [PubMed] [Google Scholar]
- 20.Palsson E. A 3-D model used to explore how cell adhesion and stiffness affect cell sorting and movement in multicellular systems. J. Theor. Biol. 2008;254:1–13. doi: 10.1016/j.jtbi.2008.05.004. [DOI] [PubMed] [Google Scholar]
- 21.Devreotes P., Janetopoulos C. Eukaryotic chemotaxis: distinctions between directional sensing and polarization. J. Biol. Chem. 2003;278:20445–20448. doi: 10.1074/jbc.R300010200. [DOI] [PubMed] [Google Scholar]
- 22.Schneider I.C., Haugh J.M. Mechanisms of gradient sensing and chemotaxis—conserved pathways, diverse regulation. Cell Cycle. 2006;5:1130–1134. doi: 10.4161/cc.5.11.2770. [DOI] [PubMed] [Google Scholar]
- 23.Jang W., Gomer R.H. Combining experiments and modelling to understand size regulation in Dictyostelium discoideum. J.R. Soc. Interface. 2008;5:S49–S58. doi: 10.1098/rsif.2008.0067.focus. [DOI] [PMC free article] [PubMed] [Google Scholar]
- 24.Chang Y.Y. Cyclic 3′,5′-adenosine monophosphate phosphodiesterase produced by the slime mold Dictyostelium discoideum. Science. 1968;161:57–59. doi: 10.1126/science.161.3836.57. [DOI] [PubMed] [Google Scholar]
- 25.Shapiro R.I., Franke J., Luna E.J., Kessin R.H. A comparison of the membrane-bound and extracellular cyclic AMP phosphodiesterases of Dictyostelium discoideum. Biochim. Biophys. Acta. 1983;758:49–57. [Google Scholar]
- 26.Bader S., Kortholt A., Hastert P.J.M.V. Seven Dictyostelium discoideum phosphodiesterases degrade three pools of cAMP and cGMP. Biochem. J. 2007;402:153–161. doi: 10.1042/BJ20061153. [DOI] [PMC free article] [PubMed] [Google Scholar]
- 27.Kessin R.H., Orlow S.J., Shapiro R.I., Franke J. Binding of inhibitor alters kinetic and physical properties of extracellular cyclic AMP phosphodiesterase from Dictyostelium discoideum. Proc. Natl. Acad. Sci. USA. 1979;76:5450–5454. doi: 10.1073/pnas.76.11.5450. [DOI] [PMC free article] [PubMed] [Google Scholar]
- 28.Wu L., Franke J., Blanton R.L., Podgorski G.J., Kessin R.H. The phosphodiesterase secreted by prestalk cells is necessary for Dictyostelium morphogenesis. Dev. Biol. 1995;167:1–8. doi: 10.1006/dbio.1995.1001. [DOI] [PubMed] [Google Scholar]
- 29.Zaikin A.N., Zhabotinsky A.M. Concentration wave propagation in two-dimensional liquid-phase self-oscillating system. Nature. 1970;225:535–537. doi: 10.1038/225535b0. [DOI] [PubMed] [Google Scholar]
- 30.Jaffe L.F. Calcium waves. Philos. Trans. R. Soc. Lond. 2008;363:1311–1316. doi: 10.1098/rstb.2007.2249. [DOI] [PMC free article] [PubMed] [Google Scholar]
- 31.Jalife J., Antzelevitch C. Phase resetting and annihilation of pacemaker activity in cardiac tissue. Science. 1979;206:695–697. doi: 10.1126/science.493975. [DOI] [PubMed] [Google Scholar]
- 32.Davidenko J.M., Pertsov A.V., Salomonsz R., Baxter W., Jalife J. Stationary and drifting spiral waves of excitation in isolated cardiac muscle. Nature. 1992;355:349–351. doi: 10.1038/355349a0. [DOI] [PubMed] [Google Scholar]
- 33.Bursac N., Aguel F., Tung L. Multiarm spirals in a two-dimensional cardiac substrate. Proc. Natl. Acad. Sci. USA. 2004;101:15530–15534. doi: 10.1073/pnas.0400984101. [DOI] [PMC free article] [PubMed] [Google Scholar]
- 34.Sucgang R., Weijer C.J., Siegert F., Franke J., Kessin R.H. Null mutations of the Dictyostelium cyclic nucleotide phosphodiesterase gene block chemotactic cell movement in developing aggregates. Dev. Biol. 1997;192:181–192. doi: 10.1006/dbio.1997.8720. [DOI] [PubMed] [Google Scholar]
- 35.Lauzeral J., Halloy J., Goldbeter A. Desynchronization of cells on the developmental path triggers the formation of spiral waves of cAMP during Dictyostelium aggregation. Proc. Natl. Acad. Sci. USA. 1997;94:9153–9158. doi: 10.1073/pnas.94.17.9153. [DOI] [PMC free article] [PubMed] [Google Scholar]
- 36.Parent C.A., Devreotes P.N. Molecular genetics of signal transduction in Dictyostelium. Annu. Rev. Biochem. 1996;65:411–440. doi: 10.1146/annurev.bi.65.070196.002211. [DOI] [PubMed] [Google Scholar]
- 37.Iranfar N., Fuller D., Loomis W.F. Genome-wide expression analyses of gene regulation during early development of Dictyostelium discoideum. Eukaryot. Cell. 2003;2:664–670. doi: 10.1128/EC.2.4.664-670.2003. [DOI] [PMC free article] [PubMed] [Google Scholar]
- 38.Halloy J., Lauzeral J., Goldbeter A. Modeling oscillations and waves of cAMP in Dictyostelium discoideum cells. Biophys. Chem. 1998;72:9–19. doi: 10.1016/s0301-4622(98)00119-7. [DOI] [PubMed] [Google Scholar]
- 39.Krug H.J., Pohlmann L., Kuhnert L. Analysis of the modified complete Oregonator accounting for oxygen sensitivity and photosensitivity of Belousov-Zhabotinsky systems. J. Phys. Chem. 1990;94:4862–4866. [Google Scholar]
- 40.Yeh R.P., Chan F.K., Coukell M.B. Independent regulation of the extracellular cyclic AMP phosphodiesterase-inhibitor system and membrane differentiation by exogenous cyclic AMP in Dictyostelium discoideum. Dev. Biol. 1978;66:361–374. doi: 10.1016/0012-1606(78)90245-2. [DOI] [PubMed] [Google Scholar]
- 41.Tang L., Ammann R., Gao T., Gomer R.H. A cell number-counting factor regulates group size in Dictyostelium by differentially modulating cAMP-induced cAMP and cGMP pulse sizes. J. Biol. Chem. 2001;276:27663–27669. doi: 10.1074/jbc.M102205200. [DOI] [PubMed] [Google Scholar]
- 42.Brock D.A., Gomer R.H. A cell-counting factor regulating structure size in Dictyostelium. Genes Dev. 1999;13:1960–1969. doi: 10.1101/gad.13.15.1960. [DOI] [PMC free article] [PubMed] [Google Scholar]
- 43.Faure M., Podgorski G.J., Franke J., Kessin R.H. Rescue of a Dictyostelium discoideum mutant defective in cyclic nucleotide phosphodiesterase. Dev. Biol. 1989;131:366–372. doi: 10.1016/s0012-1606(89)80010-7. [DOI] [PubMed] [Google Scholar]
- 44.Sawai S., Thomason P.A., Cox E.C. An autoregulatory circuit for long-range self-organization in Dictyostelium cell populations. Nature. 2005;433:323–326. doi: 10.1038/nature03228. [DOI] [PubMed] [Google Scholar]
- 45.Fitzhugh R. Computation of impulse initiation and saltatory conduction in a myelinated nerve fiber. Biophys. J. 1962;2:11–21. doi: 10.1016/s0006-3495(62)86837-4. [DOI] [PMC free article] [PubMed] [Google Scholar]
- 46.Dumollard R., Carroll J., Dupont G., Sardet C. Calcium wave pacemakers in eggs. J. Cell Sci. 2002;115:3557–3564. doi: 10.1242/jcs.00056. [DOI] [PubMed] [Google Scholar]
- 47.Keizer J., Smith G.D., Ponce-Dawson S., Pearson J.E. Saltatory propagation of Ca2+ waves by Ca2+ sparks. Biophys. J. 1998;75:595–600. doi: 10.1016/S0006-3495(98)77550-2. [DOI] [PMC free article] [PubMed] [Google Scholar]
- 48.Dawson S.P., Keizer J., Pearson J.E. Fire-diffuse-fire model of dynamics of intracellular calcium waves. Proc. Natl. Acad. Sci. USA. 1999;96:6060–6063. doi: 10.1073/pnas.96.11.6060. [DOI] [PMC free article] [PubMed] [Google Scholar]
- 49.Keener J.P. Propagation of waves in an excitable medium with discrete release sites. SIAM J. Appl. Math. 2000;61:317–334. [Google Scholar]
- 50.Shuai J.W., Jung P. The dynamics of small excitable ion channel clusters. Chaos. 2006;16:026104. doi: 10.1063/1.2210827. [DOI] [PubMed] [Google Scholar]
Associated Data
This section collects any data citations, data availability statements, or supplementary materials included in this article.