Abstract
The extent to which synaptic activity can signal a sensory stimulus limits the information available to a neuron. We determined the contribution of individual synapses to sensory representation by recording excitatory postsynaptic currents (EPSCs) in cerebellar granule cells during a time-varying, quantifiable vestibular stimulus. Vestibular-sensitive synapses faithfully reported direction and velocity, rather than position or acceleration of whole-body motion, via bidirectional modulation of EPSC frequency. The lack of short-term synaptic dynamics ensured a near perfect linear relationship between velocity and charge transfer, and as few as 100 synapses provided resolution approaching psychophysical limits. This indicates that highly accurate stimulus representation can be achieved by small networks and even within single neurons.
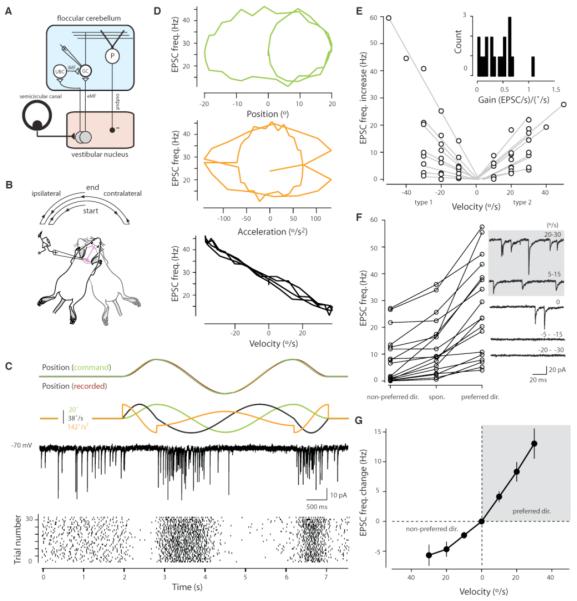
Sensory representation relies on the computational efficiency of individual neurons, which is limited by the amount of information available to a cell through its synaptic inputs. The quality of these synaptic signals will depend not only on presynaptic firing rates, but also on the stochastic properties and the short-term dynamics of release, postsynaptic receptor activation and desensitization. Although sensory representation has been studied in many cell types, poor control of sensory input parameters and uncertainty regarding the number of synapses involved in compound responses have hampered our understanding of unitary synaptic contribution. To overcome these problems we studied granule cells (GCs) in the cerebellar flocculus (Fig. 1A) where the contribution of individual mossy fibre (MF) inputs can be resolved (1, 2). However in contrast to previous studies (2, 3) this preparation permits the use of a highly accurate and quantifiable vestibular stimulus over a large region of sensory space (4-6). Moreover because several features of motion detection along the vestibular - cerebellar pathway have been elucidated by extracellular recordings (4-7) the synaptic information content can be placed in the broader context of cerebellar function.
Fig. 1.
Motion encoding at MF-GC synapses. (A) Simplified diagram of vestibular cerebellum with input from extrinsic MFs (eMF) or indirectly via intrinsic MFs (iMF) of local unipolar brush cells (UBC) (1, 26). The GC-Purkinje cell (P) pathway provides an inhibitory feedback loop to the vestibular nucleus. (B) Stimulus used to produce horizontal motion. (C) (Top) The positional command signal (green) and the recorded position (brown). (Middle) The position (green), velocity (black) and acceleration profiles (orange) obtained by differentiating the command signal. (Bottom) An example current trace of recorded EPSCs and a raster plot of EPSC onset times for 30 consecutive trials. (D) Trajectory plots for an example cell showing EPSC rate during motion (per 100 ms time bins, n = 30 trials) plotted against position, acceleration and velocity. (E) The evoked increase in EPSC frequency plotted against velocities recorded in the preferred direction for type 1 and type 2 responses. Linear fits through three to five average velocities (10°/s bins) are shown for each cell (n = 18). (Inset) A histogram of the slopes of each fit (gains). (F) Plot showing average EPSC frequencies recorded during baseline and for peak velocities in the preferred and non-preferred direction (range 35.2 to 37.7 °/s) for all cells. (Right) Example current traces showing asymmetry in EPSC frequency modulation. (G) Change in EPSC frequency from baseline rates plotted against velocity for all cells (n = 18). Error bars indicate SEM.
In vivo whole-cell voltage clamp recordings (8) in ketamine- and xylazine-anesthetized mice (9) revealed the presence of spontaneously occurring EPSCs with a mean frequency of 13 ± 2.3 Hz (n = 18 cells) in the absence of a vestibular stimulus. During horizontal rotation (Fig. 1B), a bidirectional modulation of EPSC frequency was observed (range from 0 to 110 Hz, time bins = 100 ms) (Fig. 1C and movie S1). Plotting the EPSC frequency as a function of the stimulus parameters angular position (green), velocity (black), and acceleration (orange) revealed that EPSC rate was linearly related to velocity (r2 = 0.7 ± 0.04) but not to position (r2 = 0.05 ± 0.02) or acceleration [r2 = 0.03 ± 0.01; analysis of variance (ANOVA), P < 10−20, n = 18 cells] (Fig. 1D). Synaptic responses to vestibular stimulation fell into one of two distinct classes (Fig. S1): positive rate modulation in the ipsilateral direction and negative modulation in the contralateral direction (type 1, n = 9) or vice versa (type 2, n = 9) (5). The GC excitatory drive, as quantified from the change in total charge transferred, was also modulated in a manner similar to that of EPSC frequency (Fig. S1). Both type 1 and type 2 cells showed a near-perfect correlation between EPSC frequency and velocity (type 1: r = 0.94 ± 0.09, n = 9; type 2: r = 0.97 ± 0.01, n = 9) (Fig. 1E). Although the slope (gain) of the relationship between EPSC frequency and velocity varied widely across cells (Fig. 1E, inset), the mean gain was also similar for type 1 and type 2 responses (type 1: 0.42 ± 0.11 Hz / (°/s), type 2: 0.36 ± 0.07 Hz / (°/s); P = 0.68). However, because inputs could be silenced at high velocities in the non-preferred direction (mean decrease = 58 ± 9%, range of 0 to 100%, n = 18 cells) (Fig. 1F) the correlation between EPSC frequency and velocity deteriorated in the non-preferred direction [r(pref. direct.) = 0.952; r(non-pref. direct.) = 0.753] (Fig. 1G).
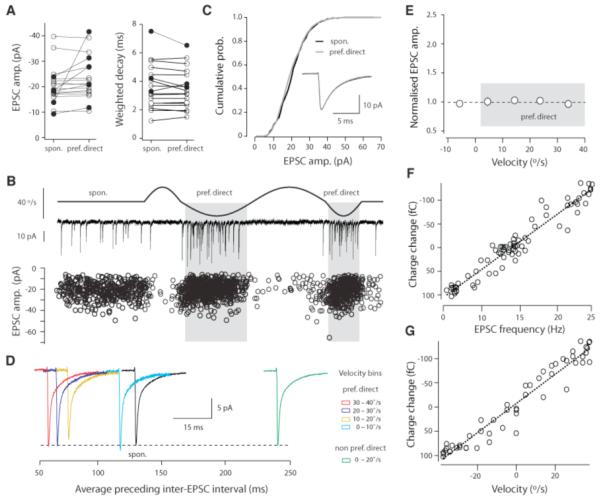
MF-GC EPSCs have been shown to exhibit frequency-dependent depression (10, 11) and glutamate-spillover-mediated AMPA receptor activation (12), suggesting that the excitatory charge in vivo could be a nonlinear function of velocity. We therefore assayed the synaptic excitatory drive by quantifying the amplitude and decay time course of spontaneous and motion-evoked EPSCs (Fig. 2A). In the majority of cases (n = 13/18 cells) we observed no significant difference (P > 0.05) in EPSC amplitude or EPSC weighted decay between spontaneous EPSCs and those recorded during movement in the preferred direction (Fig. 2B). Moreover, there was no change in the EPSC amplitude distribution as the angular velocity was increased in the preferred direction (Fig. 2, C to E). The relationship between charge per unit time, (calculated over 100 ms bins) and both EPSC frequency (r = 0.78 ± 0.05, n = 18 cells) and motion velocity (r = 0.73 ± 0.06, n = 18 cells) was linear (Fig. 2, F and G). This lack of short-term dynamics over these EPSC frequencies therefore allows angular velocity to be linearly represented both by EPSC frequency and excitatory charge at the postsynaptic membrane. Furthermore the coefficient of variation of EPSCs observed in this class of responses (cv = 0.55 ± 0.03, n = 13 cells) was similar to that for single MF inputs recorded in vitro (12), whereas the frequencies of both spontaneous and evoked EPSCs observed here are entirely consistent with recordings from individual MFs showing high action potential rates in vivo (5, 11, 13) (Fig. S2).
Fig. 2.

Velocity is linearly represented by charge transfer. (A) Mean EPSC amplitude and weighted decays for EPSCs occurring during baseline and motion in the preferred direction (group 1: cells showing no change, P > 0.05, open circles, n = 13; group 2: showing a significant change, P < 0.05, solid circles; n = 5). (B) (Top to bottom) Velocity stimulus waveform, example current trace and EPSC amplitudes recorded from a group 1 cell plotted over time (n = 31 trials, 1,545 events). (C) Cumulative probability distributions for spontaneous and stimulus-evoked EPSC amplitudes recorded from the cell shown in (B). (Inset) The average EPSCs recorded during baseline (black) and motion in the preferred direction (gray). (D) Average EPSC traces for the same cell over 10°/s velocity bins, aligned on the time scale reporting the average preceding inter-EPSC interval for that velocity bin. Scale bar insert shows time scale for EPSC traces. (E) Population data for average EPSC amplitude recorded at different velocities (n = 13 cells). Data points reflect the mean values obtained from 10°/s velocity bins and are normalized to the average EPSC amplitude observed during baseline. Plot of change in charge transfer from baseline against EPSC frequency (F) and velocity (G) (all calculated over 100 ms bins) from a representative cell.
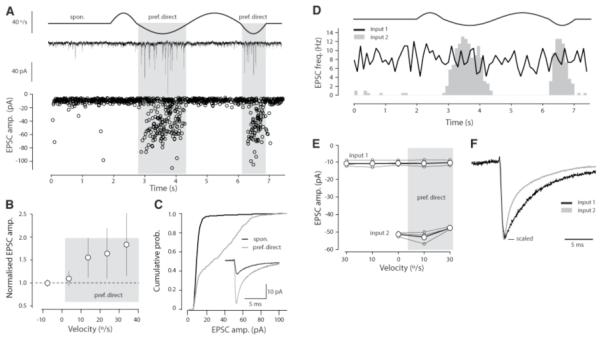
Some GCs (n = 5/18 cells) (Fig. 2A, solid circles) did, however, exhibit a significant increase in EPSC amplitude in the preferred direction (P < 0.05; Fig. 3,A and B) and a significantly higher cv (0.67 ± 0.04, P < 0.05). In these cells, the cumulative amplitude histogram changed shape during motion in the preferred direction, allowing in three out of five cells the separation of distinct inputs with use of an amplitude threshold criterion (−18 to −20 pA; n = 3 cells) (Fig. 3C) (2). We always observed that, although one population of EPSCs was insensitive to our stimulus, the other population was modulated by horizontal rotation (Fig. 3D). In two out of three cells, these two EPSC populations also showed significantly different decay time courses (P < 0.05), confirming that they arose from distinct synaptic inputs. In these cases, neither the non-modulated (input 1) nor modulated (input 2) input showed frequency-dependent changes in EPSC amplitude (input 1: P = 0.99; input 2: P = 0.07, ANOVA) (Fig. 3E). Because the slow decay time (overall wdinput 1 = 3.97 ± 1.24 ms versus wdinput 2 = 3.28 ± 1.07 ms, n = 3 cells) (Fig. 3F) and high spontaneous frequency (> 7 Hz, 3 cells) of the non-modulated input are distinct from the low frequency, very fast decaying miniature events observed in vitro (14), the non-modulated population consists predominantly of action potential-evoked events. Although we cannot distinguish intrinsic from extrinsic MF-evoked EPSCs, the overall similar decay time course (P = 0.17 n = 3 cells) of the non-modulated EPSC to the modulated EPSC and those EPSCs evoked by stimulation of a single extrinsic MFs in vitro (12) suggests that they arise from the same class of MFs.
Fig. 3.

Different GC inputs can be functionally distinct. (A) (Top to bottom) Velocity stimulus waveform, example current trace and EPSC amplitudes recorded from a group 2 cell plotted over time (n = 19 trials, 883 events). (B) Population data for group 2 cells showing the average amplitude for EPSCs recorded at different velocities (n = 5 cells). Error bars indicate SEM. (C) Cumulative probability distributions for spontaneous and stimulus-evoked EPSC amplitudes recorded from the cell shown in (A). (D) Peri-stimulus time histogram for the cell shown in (A), for which two populations of EPSCs could be distinguished. (E) On the basis of their amplitude distributions, inputs were separated (3/5 cells) and the amplitude for each input was plotted over a range of velocities. Small circles correspond to individual cells. Large circles are population averages (SEMs are plotted). (F) Average traces from the non-modulated (input 1) and modulated EPSC population (input 2) from the cell shown in (A). Average EPSC waveforms scaled to the same peak amplitude to highlight the distinct yet slow decay kinetics of both inputs.
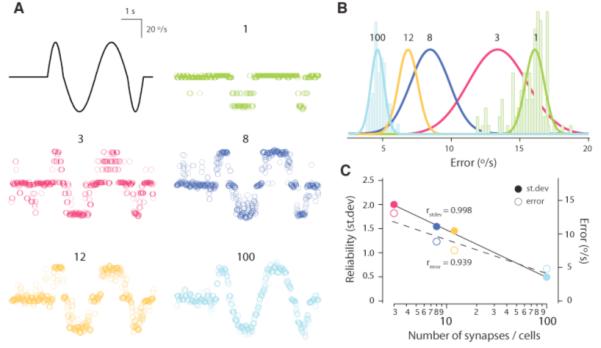
Because it is necessary for individual and populations of synapses to reliably report stimulus information online during a sensory event, coherent representations in the cerebellum are likely to involve signals distributed over many MF-GC connections. We used a Bayesian reconstruction algorithm (9) (Fig. S3) to quantify the ability of the MF-GC synapse to report our motion stimulus. Although activity through a single synapse could indicate the direction of motion (Fig. 4A), its estimate of motion velocity (per time bin) suffered from significant errors but improved with increasing synapse number towards psychophysical estimates (err1 synapse = 15.6 ± 1.3 °/s versus err100 synapses = 4.8 ± 0.5 °/s, stimulus range from −37.7 to +37.7 °/s, P < 10−8) (Fig. 4, B and C). In parallel, the reliability (SD of error) of the velocity estimate significantly improved with the logarithm of synapse number (r = −0.998, P < 0.01) (Fig. 4, B and C). This indicates that activity through as few as 100 MF-GC synapses can reliably report the direction and velocity of our motion stimulus.
Fig. 4.

Real-time velocity representation by MF-GC synapses. (A) Example stimulus estimates based on a single trial for 1, 3, 8, 12, and 100 synapses. (B) Distribution of mean error (average absolute deviation between reconstruction and applied stimulus) for 100 repetitions for the indicated number of synapses. Gaussian fits (scaled) for all distributions are shown. (C) The reliability (standard deviation of the error) and accuracy (mean error) plotted against the number of synapses used for stimulus reconstructions.
We recorded motion-evoked synaptic currents and found that velocity information is represented linearly via bidirectional modulation of EPSC frequency and charge around a tonically active vestibular input. By using differences in the EPSC waveform as a signature of distinct MF-GC synapses, we also found that floccular GCs receive inputs with unique receptive fields which suggests that vestibular, visual (15), and/or eye movement - related signals (16) may converge on individual GCs (17). In contrast to a single vestibular primary afferent which can accurately report subtle changes in velocity over a single trial (18), about 100 MF-GC synapses were required to provide enough resolution to meet psychophysical predictions (18, 19). This has two major implications for information processing in the cerebellum. MF-GC synapses do not simply relay peripheral spike rates (2, 11, 18, 20) but appear to present vestibular information to be integrated with other stimulus features. Second, although the quality of velocity information may be diluted by the probabilistic nature of transmitter release and action potential firing along the sensory pathway (21), sensory information is preserved by a population synaptic signal arising from many MFs. Although the absolute number of MF-GC synapses required will depend on the time frame of cerebellar operation it seems likely that reliable velocity information must be presented to downstream Purkinje cells as an orchestrated coincident GC signal (22, 23).
The highly linear synaptic properties and broad gain distribution of vestibular inputs onto GCs provide a system well suited for cue combination tasks, where stimulus probability distributions are inferred from linear combinations of neural activity (24). The very limited number of inputs onto GCs has allowed us isolate and monitor stimulus-evoked EPSCs arising from distinct synaptic contacts (2). However in more complex neurons such as Purkinje and pyramidal cells, non-linear interactions between synaptic inputs within the dendritic tree may affect on the processing of such information at the soma (25). However, in such cells, more reliable stimulus reconstruction and multimodal processing is likely to be achieved through the integration of large numbers of inputs with similar receptive fields.
Supplementary Material
Acknowledgments
We thank R. Callister and A. Brichta for advice and helpful discussion and the members of the lab and T. Mrsic-Flögel for comments on the manuscript. This work was supported by the Wellcome Trust (A.A., R.A.S, and T.W.M.), the UK Biotechnology and Biological Sciences Research Council (A.T.S., R.A.S., and T.W.M.), and the Human Frontier Science Program (T.W.M.).
References and Notes
- 1.Eccles JC, Ito M, Szentagothai J. The Cerebellum as a Neuronal Machine. Springer; Berlin: 1967. [Google Scholar]
- 2.Jorntell H, Ekerot CF. J Neurosci. 2006;26:11786. doi: 10.1523/JNEUROSCI.2939-06.2006. [DOI] [PMC free article] [PubMed] [Google Scholar]
- 3.Chadderton P, Margrie TW, Hausser M. Nature. 2004;428:856. doi: 10.1038/nature02442. [DOI] [PubMed] [Google Scholar]
- 4.Fernandez C, Goldberg JM. J Neurophysiol. 1971;34:661. doi: 10.1152/jn.1971.34.4.661. [DOI] [PubMed] [Google Scholar]
- 5.Lisberger SG, Fuchs AF. J Neurophysiol. 1978;41:764. doi: 10.1152/jn.1978.41.3.764. [DOI] [PubMed] [Google Scholar]
- 6.Angelaki DE, Shaikh AG, Green AM, Dickman JD. Nature. 2004;430:560. doi: 10.1038/nature02754. [DOI] [PubMed] [Google Scholar]
- 7.Barmack NH, Yakhnitsa V. J Neurosci. 2008;28:1140. doi: 10.1523/JNEUROSCI.3942-07.2008. [DOI] [PMC free article] [PubMed] [Google Scholar]
- 8.Margrie TW, Brecht M, Sakmann B. Pflüg Arch Eur J. Physiol. 2002;444:491. doi: 10.1007/s00424-002-0831-z. [DOI] [PubMed] [Google Scholar]
- 9.Materials and methods are provided on Science Online.
- 10.Saviane C, Silver RA. Nature. 2006;439:983. doi: 10.1038/nature04509. [DOI] [PubMed] [Google Scholar]
- 11.Rancz EA, et al. Nature. 2007;450:1245. doi: 10.1038/nature05995. [DOI] [PMC free article] [PubMed] [Google Scholar]
- 12.DiGregorio DA, Nusser Z, Silver RA. Neuron. 2002;35:521. doi: 10.1016/s0896-6273(02)00787-0. [DOI] [PubMed] [Google Scholar]
- 13.van Kan PL, Gibson AR, Houk JC. J Neurophysiol. 1993;69:74. doi: 10.1152/jn.1993.69.1.74. [DOI] [PubMed] [Google Scholar]
- 14.Cathala L, Brickley S, Cull-Candy S, Farrant M. J Neurosci. 2003;23:6074. doi: 10.1523/JNEUROSCI.23-14-06074.2003. [DOI] [PMC free article] [PubMed] [Google Scholar]
- 15.Noda H. Ann N Y Acad Sci. 1981;374:465. doi: 10.1111/j.1749-6632.1981.tb30892.x. [DOI] [PubMed] [Google Scholar]
- 16.Noda H, Suzuki DA. J Physiol. 1979;294:349. doi: 10.1113/jphysiol.1979.sp012934. [DOI] [PMC free article] [PubMed] [Google Scholar]
- 17.Marr D. J Physiol. 1969;202:437. doi: 10.1113/jphysiol.1969.sp008820. [DOI] [PMC free article] [PubMed] [Google Scholar]
- 18.Sadeghi SG, Chacron MJ, Taylor MC, Cullen KE. J Neurosci. 2007;27:771. doi: 10.1523/JNEUROSCI.4690-06.2007. [DOI] [PMC free article] [PubMed] [Google Scholar]
- 19.Mergner T, Hlavacka F, Schweigart G. J Vestib Res. 1993;3:41. [PubMed] [Google Scholar]
- 20.Yang A, Hullar TE. J Neurophysiol. 2007;98:3197. doi: 10.1152/jn.00798.2007. [DOI] [PubMed] [Google Scholar]
- 21.Calvin WH, Stevens CF. Science. 1967;155:842. doi: 10.1126/science.155.3764.842. [DOI] [PubMed] [Google Scholar]
- 22.Lisberger SG, Fuchs AF. J Neurophysiol. 1978;41:733. doi: 10.1152/jn.1978.41.3.733. [DOI] [PubMed] [Google Scholar]
- 23.Barbour B. Neuron. 1993;11:759. doi: 10.1016/0896-6273(93)90085-6. [DOI] [PubMed] [Google Scholar]
- 24.Ma WJ, Beck JM, Latham PE, Pouget A. Nat Neurosci. 2006;9:1432. doi: 10.1038/nn1790. [DOI] [PubMed] [Google Scholar]
- 25.London M, Hausser M. Annu Rev Neurosci. 2005;28:503. doi: 10.1146/annurev.neuro.28.061604.135703. [DOI] [PubMed] [Google Scholar]
- 26.Dino MR, Perachio AA, Mugnaini E. Exp Brain Res. 2001;140:162. doi: 10.1007/s002210100790. [DOI] [PubMed] [Google Scholar]
Associated Data
This section collects any data citations, data availability statements, or supplementary materials included in this article.


