

Abstract
The oxidative phosphorylation (OXPHOS) system consists of five multimeric complexes embedded in the mitochondrial inner membrane. They work in concert to drive the aerobic synthesis of ATP. Mitochondrial and nuclear DNA mutations affecting the accumulation and function of these enzymes are the most common cause of mitochondrial diseases and have also been associated with neurodegeneration and aging. For this reason, several approaches for the assessment of the OXPHOS system enzymes have been progressively developed. Based on the methods described elsewhere, we present here the use of blue native gel electrophoresis (BNGE) techniques to routinely assess the OXPHOS system and screen for enzymatic defects in homogenates or mitochondrial preparations from tissues or cultured cells.
Keywords: Blue Native Gel electrophoresis, Electron transport chain, Mitochondria, OXPHOS
INTRODUCTION
Over the last few years, an alternative method to the polarographic and spectrophotometric assessment of the OXPHOS system (see UNIT 19.3) has become popular among mitochondrial researchers when screening samples from patients with suspicion of mitochondrial disease. It consists of exploring the steady-state levels of respiratory complexes and their enzymatic activities using blue native gel electrophoresis (BNGE) followed by either western-blot or in gel enzyme activity assays (Schagger and von Jagow, 1991, Zerbetto et al., 1997, Nijtmans et al., 2002). Because the establishment of genotype/phenotype relationships in mitochondrial diseases is frequently difficult in the absence of functional studies, BNGE is often used as a complement to respiratory chain enzymology and oxygen consumption studies.
Blue native gel electrophoresis (BNGE) is based on the separation of protein complexes by electrophoresis according to their native molecular weight in the presence of Coomassie blue. The protein complexes are extracted from membranes with a mild detergent and subsequently exposed to the dye, which confers the negative charge required for electrophoretic separation without altering their native conformation. This technique was initially described by Schagger, H., and von Jagow, G. (Schagger and von Jagow, 1991) and although it has been slightly modified over the years to improve the technique, the basic principles remain (Nijtmans et al., 2002, Wittig and Schagger, 2008, Wumaier et al., 2009). This approach has been extensively used to analyze cellular and mitochondrial extracts from yeast, mouse tissues and human cell lines, as well as a diagnostic tool for the characterization of the electron transport chain in samples from patients suffering from mitochondrial diseases (Van Coster et al., 2001).
Basic Protocol 1
SAMPLE PREPARATION
The method presented here, adapted from Nijtmans et al. (Calvaruso et al., 2008, Nijtmans et al., 2002), can be used to analyze different kinds of biological materials, ranging from whole cells to isolated mitochondria and tissue or cellular homogenates.
Materials
Acrylamide (Roche)
Aminocaproic acid (6-aminohexanoic acid-Sigma)
Ammonium persulfate (APS)
Bis-acrylamide (BioRad)
Bis-tris (Sigma)
Digitonin (Sigma D-141)
Lauryl maltoside (Sigma)
Methanol
Glycine (Sigma)
Tris (Sigma)
Sodium dodecyl sulfate (SDS)
Polyvinylidene Fluoride (PVDF) membrane
Mitochondrial fraction, tissue culture cells or tissue homogenates.
Phosphate buffer saline (PBS)
Protease inhibitors cocktail (Roche)
Serva Blue G, alternatively Coomassie Brilliant Blue G (Sigma B-5133) can be used.
Additional equipment and reagents for electrophoresis, gel apparatus and power supply. Gradient maker.
In the absence of a gradient maker, it is possible to perform this technique with a fix acrylamide concentration (Yan and Forster, 2009).
Whole cell samples
-
Grow cells to confluence in a tissue culture flask (T75 flasks are recommended). Start with about 2.5×10⁶ cells but the protocol can be scaled down to 1×10⁶ cells.
The cell culture should be healthy and not overgrown. Change the growing media frequently (every other day or every day depending on cells), until they reach confluency. This is important, especially if growing cells with defects in the electron transport chain and OXPHOS system.
Harvest cells from culture flasks (one or two T75 are recommended) by trypsinization, resuspend them in culture media and count the number of cells.
Place cells in a microcentrifuge tube, wash them twice with cold PBS and resuspend cell pellet in 200 µl of PBS containing protease inhibitors.
Add 70 µl digitonin (8 mg/ml in PBS) to 2.5×10⁶ cells and incubate on ice for 10 min (adjust the amount of detergent according to the number of cells used).
Add 1 ml of cold PBS + protease inhibitors and centrifuge at 21,130×g for 5 min at 4°C.
Resuspend the pellet in 1 ml cold PBS+ protease inhibitors, centrifuge again and discard the supernatant. At this point, it is possible to proceed with the protocol or to freeze the pellet in liquid nitrogen to be stored at −80°C for several months.
Resuspend the digitonin pellet in 100 µl of 1.5 M aminocaproic acid, 50 mM Bis-Tris pH 7.0 buffer containing protease inhibitors and add 5–20 µl 10% lauryl maltoside (w/v) and incubate on ice for 10 min. The amount of detergent depends on the enzymatic complex to be analyzed. For complex I, the extraction requires less detergent since it is more labile.
Centrifuge at 21,130×g for 30 min at 4°C. Transfer the supernatant containing solubilized proteins to a clean tube.
Measure protein concentration with a method compatible with detergents in the sample such as the DC protein assay kit (BioRad).
Add 10 µl of 5% (w/v) Serva G buffer. Sample is ready to load in the gel.
Load between 10–40 µg of protein depending on the type of analysis. For western blot analysis, lower amounts of protein (~10 µg) are recommended. For in gel activity assays instead, larger amounts (≥40 µg) are required. These samples can also be analyzed by SDS-PAGE gels following the classical Laemmli protocol (Laemmli, 1970), with the purpose of confirming equal protein loading by western blot using antibodies against VDAC1 (porin) or Tim23.
Mitochondrial fraction from tissues and cultured cells
Resuspend 250 µg of mitochondria in a total volume of 100 µl of 1.5 M aminocaproic acid, 50 mM Bis-Tris pH 7.0 buffer in a microcentrifuge tube.
Add 10 µl of 10% (w/v) lauryl maltoside (the amount of detergent depends on tissue used, heart < muscle < brain about 3, 4 and 10 µl respectively (Nijtmans et al., 2002)) and incubate on ice for 20 min.
Centrifuge at 21,130×g for 30 min. Collect supernantant containing solubilized proteins to a clean tube and determine protein concentration with DC protein Kit.
Add 10 µl of 5% (w/v) Serva G. The sample is ready to be either directly loaded on gel or stored at −80°C until further analysis.
Tissues and cell homogenates
Prepare cell or tissue homogenates in small volume (100–200 µl depending on the amount of biological material) of PBS containing protease inhibitors using a tissue homogenizer.
Centrifuge at low speed (100×g) to remove unbroken material and then determine protein concentration.
Place 200 µg of proteins in a microcentrifuge tube and bring to a final volume of 100 µl with aminocaproic acid buffer, add 12 µl of 10% (w/v) lauryl maltoside and incubate on ice for 20 min.
Centrifuge at 21,130×g for 30 min and remove supernatant to a clean tube.
Add 6 µl of 5% (w/v) Serva G to supernatant sample and load desired amount in gel as described above.
Basic Protocol 2
ELECTROPHORESIS AND ANALYSIS OF SAMPLES
The different mitochondrial OXPHOS complexes can by analyzed by protein staining, by immunoblotting with specific antibodies or by in gel activity stain assays.
Materials
High molecular weight native markers (GE Health Care) can be used to follow the migration of proteins in the gel. Alternatively, mitochondrial preparations from rat heart or bovine heart can be treated with lauryl maltoside as described above for the samples and used as respiratory complexes markers. If enough protein is loaded (10–20 µg) the different complexes can be visualized while migrating through the gel.
Gel solutions (see Table 1)
Table I.
Polyacrylamide solutions
| Solutions | 4% | 10% | 13% |
|---|---|---|---|
| Acrylamide-bisacrylamide | 0.32 ml | 0.8 ml | 1.0 ml |
| Gel Buffer 3× | 1.33 ml | 1.33 ml | 1.33 ml |
| Glycerol | --- | 0.8 ml | 0.8 ml |
| Water | 2.29 ml | 1.0 ml | 0.79 ml |
| APS 10% | 44 µl | 12 µl | 12 µl |
| TEMED | 4.4 µl | 1.2 µl | 1.2 µl |
| Total | 4 ml | 4 ml | 4 ml |
Prepare the gel
-
1.
Prepare a 4–13% acrylamide gradient gel to see all complexes. Gradients can be adjusted to different percentages of acrylamide depending on the desired resolution. For example, complex I and supercomplexes are better resolved using 4–10% acrylamide gradient.
-
2.
Prepare 4 ml of each of the two percentage acrylamide solutions required as shown in the Table I for a mini gel (e.g. BIORAD) using 1.5 mm spacers. Add APS and TEMED just prior to preparing the gradient to avoid premature polymerization. Keep the mixtures on ice.
-
3.
Place the gradient maker with small stirring bars on each compartment on a stirring plate. Connect the outlet of the gradient maker to a peristaltic pump and make sure that the connection between the two chambers is closed.
-
4.
Add the cold solution mix with the higher acrylamide percentage in the compartment directly connected to the peristaltic pump and the mixture with lower acrylamide percentage in the other compartment.
-
5.
Turn on the stirring plate (at low speed to mix solution without creating bubbles), add the APS and TEMED. Start the pump at a speed of about 2 ml/min. When the pump starts to withdraw solution from the gradient maker open the connection between the two compartments so the mixed gradient can be formed.
-
6.
Place the tubing (with a needle at the end) coming out from the pump between the two glass plates to cast the gel against one side so the solution can slide down with minimal disturbance. Once all solution has been delivered between the two glass plates, carefully overlay the acrylamide gradient with water.
-
7.
To help with the visualization of the gradient a small amount of dye (1 µl of 5% Serva G solution) can be added to the higher percentage acrylamide solution. Once the gel is formed, a gradient of the blue dye in the gel should be observed, where the bottom of the gel is darker than the top of the gel.
-
8.
Allow enough time for the gel to polymerize. When polymerization is ready, a sharp band between the acrylamide solution and the water overlay is observed. Remove water and pour a stacking gel of 4% acrylamide and place the comb to form the sample wells.
-
9.
Alternatively, precast gels can be purchased from Invitrogen. Two types of gradients are available: NativePAGE™ Novex® 4–16% Bis-Tris Gels 1.0 mm, 10 well or NativePAGE™ Novex® 3–12% Bis-Tris Gels 1.0 mm, 10 well. Both gels are also available with 15 wells.
Load and run the gel
-
10.
Before loading the samples, fill the wells with the blue cathode buffer and wash any excess non-polymerized acrylamide from the well. Load the desired volume of sample in each well. Fill the gel cathode chamber with the blue cathode buffer and the bottom chamber with the anode buffer.
-
11.
Run the gel in blue cathode buffer at constant voltage of 100v for about 1 h or until the dye front has traveled approximately ½ of the gel. Then, change the blue buffer to clear cathode buffer and run at a constant current of 16 mA. The change to a clear buffer will reduce the excess of dye in the gel, which interferes with western blots and enzyme activity assays. Run gels at 4°C to avoid overheating.
-
12.
Run samples until the blue dye front leaves the gel completely, which will take around 3–4 hr depending on the acrylamide concentrations used. If enough protein is loaded (approximately 40 µg), the separation of bands corresponding to the respiratory complexes can be visualized while the gel is running.
Analyze respiratory complexes with Coomassie blue or silver staining
Materials
Staining solution: 0.1% (w/v) Serva G in 40% methanol, alternatively 0.25% Coomassie R250 in 40% methanol, 10% acetic acid. It is recommended to filter this solution with filter paper to remove insoluble particles.
Destaining solution: 40% methanol, 10% acetic acid.
Immerse the gel in a tray containing the staining solution (volume enough to cover the gel) and gently shake it for 20–40 min at room temperature. The entire gel will become dark blue.
Remove the staining solution (the staining solution can be stored and reused several times) and add a similar volume of destaining solution. The destaining procedure takes longer time and the destaining solution has to be periodically discarded and replaced by fresh solution as the dye is removed from the gel. Kimpwipes or a small sponge can be added to the solution to help with the destaining process as they trap the dye.
Once the background of the gel is clear and bands corresponding to the respiratory complexes can be observed (as in Figure 1A) the gel can be photographed or scanned.
Figure 1.
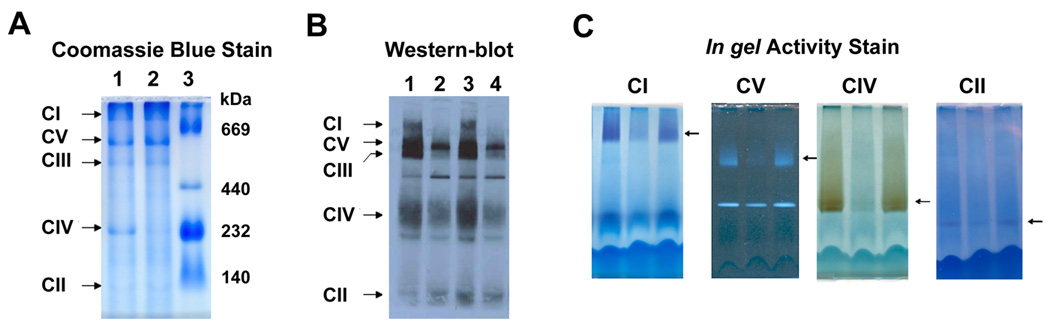
Blue Native Gel electrophoresis. (A) Mouse muscle mitochondria separated by BNG and stained with Coomassie blue to visualize respiratory complexes, lane 1: control mouse, lane 2: COX deficient mouse, lane 3: Native High Molecular weight marker (GE). (B) BN-western blot using Invitrogen 4–16 gradient gel and Antibody Cocktail from Mitosciences. The samples are mitochondrial fractions from mouse fibroblasts. Lanes 1 and 3 control cells and lanes 2 and 4 fibroblasts deficient in CI and CIII. (C) In gel activity stain of respiratory complexes of mouse liver mitochondria. In CV activity stain the F1 (lower band) dissociates from the fully assembled complex (arrow) and retains ATP hydrolysis activity.
Coomassie stain can detect bands of about 0.5 µg of protein. When a more sensitive method is required, we recommend silver staining using any commercially available kit. Ohter protein staining reagents can be used such as Sypro Ruby.
Analyze respiratory complexes by western blotting
Recommended: run out most of the blue dye from the gel since Coomassie will interfere with the antibody binding thus resulting in high background.
Assemble the transfer sandwich (filter paper, gel, membrane) according to standard protocols using a PVDF membrane (e.g., see UNIT 9.11). Remember to wet the PVDF in methanol prior to immersing it into the transfer buffer.
Use transfer buffer containing SDS (20 mM Trizma, 150 mM glycine, 20% methanol, 0.05% SDS) to facilitate the transfer of big respiratory complexes to the membrane. Transfer proteins to PVDF membrane overnight at 30 V at 4°C.
Following transfer, rinse PVDF membrane in water and let it air dry completely for approximately 1 h.
Distain the Coomassie present in the membrane with quick immersions in methanol, repeat this steps until most of the dye has been removed (2–3 times) but do not let it stand too long on the solvent. If the membrane is not completely dry, the methanol will not remove the dye.
Rinse the alcohol with water and block the membrane with 5% milk in PBS-Tween for 2–3 h and proceed with the standard western blot protocol incubating with the primary and secondary antibodies conjugated to horseradish peroxidase followed by chemiluminescent detection using commercially available kits (e.g. Supersignal from Pierce/Thermo Scientific).
Primary antibodies against subunits of each respiratory complex can be added sequentially. Start with antibodies against the complex with higher molecular weight to the lowest: CI, CV, CIII, CIV and CII or vice versa. Alternatively, cocktails of antibodies to recognize all the complexes in one step are commercially available (Mitosciences) as shown in Figure 1B.
Analyze respiratory complexes with in gel activity stains
After electrophoretic separation by the method described above, the respiratory complexes retain enzymatic activity. Based on histochemical staining methods, assays to perform in gel activity stains for each respiratory complex, with the exception of complex III, have been developed (Zerbetto et al., 1997). In general, samples from tissues, especially heart and muscle, give very strong signals, whereas samples from cells give weak signals. Examples of in gel activity stains are shown in Figure 1C. All staining solutions must be freshly made.
Complex I activity
Incubate gel in 0.1 M Tris-HCl pH 7.4 containing 1 mg/ml nitro blue tetrazolium and 0.14 mM NADH at room temperature. Depending on sample, the blue-purple color can develop as early as in 30–45 min.
Complex II activity
Incubate gel in 50mM phosphate buffer pH 7.4, 84 mM succinic acid, 0.2 mM phenazyne methasulfate, 2 mg/ml nitro blue tetrazolium, 4.5 mM EDTA and 10 mM KCN.
Complex IV activity
Incubate gel in 5 mg Diaminobenzidine tetrahydrochloride (DAB) dissolved in 9 ml of 50 mM phosphate buffer pH 7.4 containing, 10 mg cytochrome c and 750 mg sucrose. Depending on sample, brown color develops in approximately 2 hr.
Complex V activity
Wash gel with water a couple of times and then incubate in 50mM pH 8.6 for 1 hr to equilibrate gel.
Prepare reaction mix in the following order: 35 mM Tris, 270 mM glycine, 14 mM MgSO4, 5 mM ATP and adjust pH to 7.8, then add 0.2% Pb(NO3)2. A precipitate forms that dissolves by adjusting solution pH to 8.6 (solution remains a little cloudy). Incubate gel in this solution at 37°C. The reaction is slow so it could take up to 3 hr before white bands in the gel are observed. If required, incubate the gel overnight.
Following corresponding activity stains, wash gels extensively in water. Adding kimwipes in the water will help to absorb leftover reagents present in the gel and will eliminate background on gels faster. Scan or take pictures of the stained gels.
REAGENTS AND SOLUTIONS
Acrylamide solution
48 g acrylamide and 1.5 g bis-acrylamide in 100 ml water (50 ml will be enough for few months).
Aminocaproic buffer
1.5 M Aminocaproic acid, 50 mM Bis-Tris pH 7.0 at 4°C (make 10 ml). Store at 4°C.
Anode Buffer
50 mM Bis-Tris pH 7.0 at 4°C (make 500 ml of a 5× stock and store at 4°C).
Blue Cathode Buffer
cathode buffer + 0.02% (w/v) Serva blue G (or Coomassie Brilliant Blue G Sigma B-5133). When using Coomassie Blue G, dissolve dye overnight. If it is going to be used frequently, it is convenient to prepare 500 ml of a 5× stock. When using Serva G for the blue cathode buffer, the solubility of this dye in the buffer is higher than the one of Coomassie blue so you do not need to dissolve overnight. Store the solution at room temperature to avoid dye precipitation.
Cathode Buffer
50 mM Tricine, 15 mM Bis-Tris/HCl pH 7.0 at 4°C (make 500 ml of a 5× stock and store at 4°C).
Digitonin
8 mg/ml Digitonin (Sigma D-141) in PBS and heat at 95°C in heating block for 5 min. and then put immediately on ice. Make the solution fresh and only the amount needed. This solution is only needed when using whole cells as sample (see sample preparation).
Gel Buffer 3×
150 mM Bis-Tris, 1.5 M aminocaproic acid, adjust to pH 7.0 with HCl at 4°C (make 100 ml).
10% Lauryl Maltoside
very hygroscopy. It is better to resuspend the whole bottle and store aliquots at −20°C.
5% Serva G
5% Serva G (w/v) in 750 mM Aminocaproic acid, 50 mM Bis-Tris pH 7.0, 0.5 mM EDTA. Store at 4°C.
COMMENTARY
Background Information\
Blue native gel electrophoresis is a very useful technique for analyses of protein complexes in general and as such, it has broader applications than just the analysis of mitochondrial respiratory complexes. Over the years, variations have been implemented to suit different needs (reviewed in Wittig and Schagger, 2008).
One variation of this technique that was not described here that applies to the study of OXPHOS complexes is the Clear Native electrophoresis (CNE). The main differences are the absence of the blue dye and the use of a different buffer system that allows for the separation of proteins with high isoelectric pI (Wittig and Schagger, 2008).
Although CNE has lower resolution when compared to BNGE, it has the advantage to allow for staining methods (such as complex III activity) that are interfered by the blue dye.
The studies of the respiratory complexes can be extended by analyzing the samples by two dimensional gel electrophoresis following BNGE (2D-BNGE). Protocols for 2D-BNGE are described elsewhere (Calvaruso et al., 2008, Nijtmans et al., 2002).
Additionally, the study of interactions of the respiratory complexes to form supramolecular structures called supercomplexes can also be analyzed by BNGE including milder detergent treatments during the sample preparation (Schagger and Pfeiffer, 2000).
Critical Parameters and Troubleshooting
The successful analysis of the respiratory complexes by blue native gel electrophoresis (BNGE) depends on the state and handling of the cells and tissues to be examined. The conditions described here should be used as a guide. Depending on cell type or tissue, the concentrations of detergent (lauryl maltoside) might need some adjustment. For example, in case of complex I, usually less detergent is recommended since this complex is very labile. Similarly, one of the subunits of complex V, the F1 that has ATP hydrolysis activity, sometimes dissociates from the fully assembled complex and could be detected by in gel activity assay (Figure 1C) or by western blot (using anti ATPaseβ antibody). To avoid this, lower lauryl maltoside concentrations are recommended.
Assessing defects in the respiratory chain should involve the use of more than one technique to confirm the results. This is particularly important in the case of complex I activity, where the spectrophotometric assay cannot be performed in whole cells or tissue homogenates. Since in gel activity assays are semi-quantitative, it is advised to analyze complex I deficiencies by in gel activity and western blot.
One important factor to take into consideration when performing BNGE is time management. It is important striving for minimizing the time between electrophoresis and activity stain. Running the gel one day and performing the staining the next will result in some lost of complexes activities, depending on the sample. When performing activity staining, it is advised running the gels overnight at low voltage and then performing the staining as soon as the electrophoretic run is finished.
Equally important are the fresh preparation of the reaction mixtures and to avoid “over-development” of the colorimetric reactions. This is especially relevant in the case of the mixture for complex I activity, where long exposure results in high background. When convenient, reactions can be accelerated by incubating a 37°C for few hours instead of overnight at room temperature.
Anticipated Results
Blue native gel electrophoresis allows for the separation of proteins ranging from 100 kDa to at least 10,000 kDa depending on the concentrations of the acrylamide gradient used. The separation of the OXPHOS complexes in a 4–13% acrylamide gradient, as described here, allows for the resolution of discrete bands on the gel corresponding to each complex. Their molecular weights range from approximately: 1,000 kDa for complex I, 600 kDa for complex V, 500 kDa for complex III, 200 kDa for complex IV and 130 kDa for complex II as shown in Figure 1A. Analysis of samples with respiratory complex/es deficiencies by BNGE will permit to screen for defects on more than one complex at the same time. Since the respiratory chain can be organized in supramolecular structures or supercomplexes, the defect in one complex can affect other complexes (reviewed in Acin-Perez et al., 2008). An example of this pleiotropic effect is shown in Figure 1B, samples loaded in lanes 2 and 4 correspond to mouse fibroblasts harbouring a genetic defect in a complex III subunit that results in a deficiency of both complexes I and III. This is indicated by the reduction on the steady state level of these two complexes detected by western blot using a cocktail of antibodies against subunits of each respiratory complex.
More generalized defects on OXPHOS complexes can be observed in the samples presented in Figure 1C, analyzed by in gel activity stain. The second sample showed decreased enzymatic activity in all the respiratory complexes when compared to the other two samples. Further analysis of this sample by western blot would provide information about whether the enzymatic deficiency is due to lower steady state levels of the complex or decreased enzymatic activity.
Finally, because many mitochondrial disorders are characterized by impairment of the respiratory enzymes assembly process, subassembly intermediates can be detected by BNGE and western blotting.
Time Considerations
Once the biological material is obtained, the sample processing, gel casting, sample loading and electrophoretic run take one full day of work. This time is extended to 1 or more days depending on the method of analysis (Coomassie stain, in gel activity stain or western blot).
The time required for sample preparation is about 1.5 h. The time required for gel preparation, depending on the familiarity of the researcher with the necessary equipment (gradient maker and casting gel assembly), ranges from 1–2.5 h. The electrophoretic run using the parameters described in this Unit takes approximately 4–5 h. The protein transfer to PVDF membranes for western blot analysis is frequently carried out overnight. For analysis of respiratory complexes by in gel activity we recommend to run gels overnight at lower voltage (50–70v), starting in the late afternoon, and the next morning subsequently perform the activity stain.
It is possible to reduce to one day the time invested, by casting the gels in advance and keeping them stored at 4°C for a few days, or alternatively by using commercial precast gels.
AKCNOWLEDGEMENTS
We thank Dr. Tiziana Lodi and Darryl Horn for critically reading the manuscript. The following foundations are acknowledged for their financial support: NIH (RO1 Grant GM071775A to A.B.), Muscular Disease Association (MDA Research Grant to A.B.). The James and Esther King Biomedical Research Program, Florida Department of Health 08KN-01 (to F.D.).
REFERENCES
- Acin-Perez R, Fernandez-Silva P, Peleato ML, Perez-Martos A, Enriquez JA. Respiratory active mitochondrial supercomplexes. Mol. Cell. 2008;32:529–539. doi: 10.1016/j.molcel.2008.10.021. [DOI] [PubMed] [Google Scholar]
- Calvaruso MA, Smeitink J, Nijtmans L. Electrophoresis techniques to investigate defects in oxidative phosphorylation. Methods. 2008;46:281–287. doi: 10.1016/j.ymeth.2008.09.023. [DOI] [PubMed] [Google Scholar]
- Laemmli UK. Cleavage of structural proteins during the assembly of the head of bacteriophage T4. Nature. 1970;227:680–685. doi: 10.1038/227680a0. [DOI] [PubMed] [Google Scholar]
- Nijtmans LG, Henderson NS, Holt IJ. Blue Native electrophoresis to study mitochondrial and other protein complexes. Methods. 2002;26:327–334. doi: 10.1016/S1046-2023(02)00038-5. [DOI] [PubMed] [Google Scholar]
- Schagger H, von Jagow G. Blue native electrophoresis for isolation of membrane protein complexes in enzymatically active form. Anal. Biochem. 1991;199:223–231. doi: 10.1016/0003-2697(91)90094-a. [DOI] [PubMed] [Google Scholar]
- Schagger H, Pfeiffer K. Supercomplexes in the respiratory chains of yeast and mammalian mitochondria. EMBO J. 2000;19:1777–1783. doi: 10.1093/emboj/19.8.1777. [DOI] [PMC free article] [PubMed] [Google Scholar]
- Van Coster R, Smet J, George E, De Meirleir L, Seneca S, Van Hove J, Sebire G, Verhelst H, De Bleecker J, Van Vlem B, Verloo P, Leroy J. Blue native polyacrylamide gel electrophoresis: a powerful tool in diagnosis of oxidative phosphorylation defects. Pediatr. Res. 2001;50:658–665. doi: 10.1203/00006450-200111000-00020. [DOI] [PubMed] [Google Scholar]
- Wittig I, Schagger H. Features and applications of blue-native and clear-native electrophoresis. Proteomics. 2008;8:3974–3990. doi: 10.1002/pmic.200800017. [DOI] [PubMed] [Google Scholar]
- Wumaier Z, Nubel E, Wittig I, Schagger H. Chapter 8 Two-dimensional native electrophoresis for fluorescent and functional assays of mitochondrial complexes. Methods Enzymol. 2009;456:153–168. doi: 10.1016/S0076-6879(08)04408-X. [DOI] [PubMed] [Google Scholar]
- Yan LJ, Forster MJ. Resolving mitochondrial protein complexes using nongradient blue native polyacrylamide gel electrophoresis. Anal. Biochem. 2009;389:143–149. doi: 10.1016/j.ab.2009.03.043. [DOI] [PMC free article] [PubMed] [Google Scholar]
- Zerbetto E, Vergani L, Dabbeni-Sala F. Quantification of muscle mitochondrial oxidative phosphorylation enzymes via histochemical staining of blue native polyacrylamide gels. Electrophoresis. 1997;18:2059–2064. doi: 10.1002/elps.1150181131. [DOI] [PubMed] [Google Scholar]