

Abstract
Oligomeric forms of amyloid-β (Aβ) are thought to play a causal role in Alzheimer's disease (AD), and the p75 neurotrophin receptor (p75NTR) has been implicated in Aβ-induced neurodegeneration. To further define the functions of p75NTR in AD, we examined the interaction of oligomeric Aβ(1-42) with p75NTR, and the effects of that interaction on neurite integrity in neuron cultures and in a chronic AD mouse model. Atomic force microscopy was used to ascertain the aggregated state of Aβ, and fluorescence resonance energy transfer analysis revealed that Aβ oligomers interact with the extracellular domain of p75NTR. In vitro studies of Aβ-induced death in neuron cultures isolated from wild-type and p75NTR−/− mice, in which the p75NTR extracellular domain is deleted, showed reduced sensitivity of mutant cells to Aβ-induced cell death. Interestingly, Aβ-induced neuritic dystrophy and activation of c-Jun, a known mediator of Aβ-induced deleterious signaling, were completely prevented in p75NTR−/− neuron cultures. Thy1-hAPPLond/Swe × p75NTR−/− mice exhibited significantly diminished hippocampal neuritic dystrophy and complete reversal of basal forebrain cholinergic neurite degeneration relative to those expressing wild-type p75NTR. Aβ levels were not affected, suggesting that removal of p75NTR extracellular domain reduced the ability of excess Aβ to promote neuritic degeneration. These findings indicate that although p75NTR likely does not mediate all Aβ effects, it does play a significant role in enabling Aβ-induced neurodegeneration in vitro and in vivo, establishing p75NTR as an important therapeutic target for AD.
Introduction
The p75 neurotrophin receptor (p75NTR) is a potential therapeutic target for Alzheimer's disease (AD) (Longo and Massa, 2004b; Coulson, 2006; Longo et al., 2007). p75NTR regulates neuron survival, function, and structure by acting in concert with a collection of ligands and coreceptors (Dechant and Barde, 2002; Longo and Massa, 2008). Nerve growth factor (NGF) signaling through p75NTR may induce death or survival depending on the cellular context, whereas the pro form of NGF signals through p75NTR and sortilin to induce death (Barker, 2004; Nykjaer et al., 2004). p75NTR also regulates neurite outgrowth through its interactions with the Nogo and LINGO coreceptors (Wang et al., 2002; Mi et al., 2004). p75NTR is expressed by populations that are particularly vulnerable in AD, including basal forebrain cholinergic, hippocampal, cortical, and entorhinal neurons (Longo and Massa, 2004b); and its expression is further increased in AD (Mufson and Kordower, 1992; Hu et al., 2002). Amyloid-β (Aβ) (1-40) aggregates of undetermined structure have been reported to be death-inducing ligands of p75NTR (Yaar et al., 1997, 2002), although Aβ is also known to bind multiple other targets (Verdier and Penke, 2004). p75NTR mediates Aβ-induced death in hippocampal neurons (Sotthibundhu et al., 2008), PC12 cells (Rabizadeh et al., 1994), NIH 3T3 cells (Yaar et al., 1997), and human neuroblastoma cells (Perini et al., 2002), an effect requiring the receptor extracellular domain (Perini et al., 2002). Aβ toxicity mediated by p75NTR occurs via c-Jun kinase (JNK) and the transcription factor, c-Jun (Morishima et al., 2001; Hashimoto et al., 2004; Yaar et al., 2007). In addition, low level Aβ exposure may promote aberrant neurite outgrowth via p75NTR (Susen and Blochl, 2005). Finally, recent studies have found that Aβ causes substantially less neuronal death when injected into the hippocampus of p75NTR−/− mutant mice (in which exon III, which constitutes a large part of the extracellular domain of p75NTR, is deleted), than in wild-type (p75NTR+/+) mice (Sotthibundhu et al., 2008).
To further establish whether targeting of p75NTR might have a therapeutic role in AD, we addressed three questions regarding Aβ and p75NTR function. A first series of studies applied fluorescence resonance energy transfer (FRET)-based technology to investigate oligomeric Aβ interactions with the extracellular domain of p75NTR. A second series of experiments used neuronal cultures derived from p75NTR−/− mutant mice, to examine p75NTR contributions to oligomeric Aβ-induced cell death, neurite degeneration, and c-Jun signaling. Finally, we determined the effects of p75NTR on chronic Aβ-induced neuronal degeneration in vivo by crossing p75NTR−/− mice with Thy1-hAPPLond/Swe mice, a well characterized mouse model of AD (Rockenstein et al., 2001). The results support the ideas that oligomeric Aβ interacts with the extracellular domain of p75NTR and that p75NTR is required for Aβ-induced deleterious signaling and neurodegeneration, including neuritic degeneration, in vitro and in vivo. These findings point to p75NTR as a significant therapeutic target for slowing or preventing fundamental pathologic mechanisms underlying AD.
Materials and Methods
Materials.
Anti-phospho-c-Jun (p-c-Jun) polyclonal antibody was purchased from Cell Signaling Technology; microtubule-associated protein-2 (MAP-2) monoclonal antibody was purchased from Sigma. The p75NTR-blocking rabbit antibody 9651, directed against residues 43-161 of the extracellular domain cysteine repeat regions II, III, and IV, was obtained from Dr. Moses Chao (Skirball Institute, New York University, New York, NY) (Huber and Chao, 1995). Recombinant NGFR/TNFRSF16/Fc chimera protein, encoding residues 1-250 of the extracellular domain of human p75NTR fused to an Fc fragment, was expressed in Sf 21 cells using a baculovirus vector (obtained from R&D Systems). Cy3B-NHS ester was purchased from GE Healthcare Bio-Sciences. 5-FAM-X, SE [6-(fluorescein-5-carboxamido)hexanoic acid, succinimidyl ester] was obtained from AnaSpec. Fluorescein-labeled Aβ(1-42) peptide was purchased from AnaSpec. 8E5 anti-APP (amyloid precursor protein) antibody was obtained from Elan Pharmaceuticals. Goat anti-ChAT AB144P antibody and biotinylated rabbit anti-goat antibodies were obtained from Millipore Bioscience Research Reagents. Control rabbit IgG was purchased from Invitrogen. Secondary fluorescent antibodies were obtained from Jackson ImmunoResearch Laboratories. Thioflavin-S and cresyl violet stains were procured from Sigma.
Aβ preparations.
For work in neuronal cultures, Aβ(1-42) peptide was obtained from rPeptide and Aβ oligomers were prepared. In early experiments, Aβ peptide was resuspended in 0.2% NH4OH (Bozyczko-Coyne et al., 2001) at a concentration of 350 μm and stored at −70°C. The stock solution was incubated at 37°C for 5–7 d before application in cell cultures. In the majority of experiments, 1.0 mg of Aβ peptide was dissolved in 250 μl of hexafluoroisopropanol (HFIP), aliquoted in microcentrifuge tubes, and HFIP was removed under vacuum in a SpeedVac (Stine et al., 2003). Resulting peptide films were stored desiccated at −20°C. Before use, the peptide was resuspended to 2.5 mm in dry DMSO (Sigma), brought to 80 μm in PBS, and incubated at 4°C for 24 h. We have previously verified by atomic force microscopy (AFM) that Aβ prepared according to each of these protocols reliably forms oligomers that have indistinguishable toxic potency in neuron culture (Yang et al., 2008). For FRET analysis, oligomers of fluorescein-labeled Aβ(1-42) peptide were prepared using the HFIP-based protocol. To verify that fluorescein-labeled Aβ prepared with the HFIP-based protocol forms oligomers, nonlabeled AFM topography images were acquired in the light tapping mode using a MultiMode AFM (Veeco) controlled by a Nanoscope IIIA controller (Veeco). Resonant frequencies of the uncoated silicon tips (MikroMasch) were ∼150 kHz with tip radii <10 nm. Samples were made by dispersing solutions onto Pirahna cleaned silicon wafers with molecular smoothness ∼1 Å rms roughness as determined by AFM.
FRET spectroscopy.
p75NTR extracellular domain was labeled with Cy3B-NHS ester using standard protein coupling protocols recommended by the manufacturers. Briefly, 50 μg of Cy3B-NHS ester in 20 μl of dimethylformamide (DMF) was reacted with 100 μg of p75NTR extracellular domain dissolved in 200 μl of 50 mm borate buffer, pH 8.3. This solution was incubated at room temperature for 2 h. Nonreactive dye was separated using prepacked, disposable PD-10 columns containing Sephadex G-25 (GE Healthcare Bio-Sciences). Cy3B-p75NTR was eluted with 20 mm sodium phosphate buffer, pH 7.2, stored in the same buffer at 4°C, and used within 2 d. Biotinylated IgG was labeled with Cy3B-NHS using the same protocol. Streptavidin-FITC was obtained from R&D Systems. To link 5-FAM-X, SE (fluorescein) with NGF or p75NTR, 100 μg of 2.5S NGF or recombinant p75NTR was dissolved in 200 μl of bicarbonate buffer of pH 8.3 and treated with 20 μl containing 50 μg of fluorescein in DMF. This solution was incubated at room temperature for 2 h. Nonreactive dye was separated using Sephadex G-25 PD-10 columns as above. Fluorescein-NGF was eluted with 20 mm sodium phosphate buffer, pH 7.2, and stored in the same buffer at 4°C and used within 2 d. Because fluorescein is known for its self-quenching properties that would lead to lowering of fluorescence intensity with increasing aggregation (Lakowicz et al., 2003), we diluted fluorescein-Aβ with unlabeled Aβ in a 1:3 ratio. Aliquots of 10 mm PBS solution containing 0.7% BSA and various combinations of fluorescein- or Cy3B-labeled Aβ, p75NTR, NGF, biotinylated IgG, Streptavidin, or BSA were allowed to equilibrate for 2 h at room temperature and then subjected to FRET analysis using ultra-microfluorescence cuvettes with a sample capacity of 45 μl. Heat-denatured p75NTR-Cy3B and BSA-Cy3B were used as negative controls. The excitation wavelength was set as 490 nm, and intensity of fluorescent emissions was recorded between 500 and 750 nm. Fluorescence measurements were performed using a Fluorolog-Spectro fluorometer equipped with a xenon lamp. Both the excitation and emission slits were set at 1 nm.
Primary neuronal cultures.
All animal procedures were approved by the Stanford Committee on Laboratory Animal Care and were conducted in accordance with the National Institutes of Health Guide for the Care and Use of Laboratory Animals. Hippocampal and basal forebrain cultures were prepared from embryonic day (E) 15–17 C57BL/6 mice that expressed normal p75NTR (p75NTR+/+) or from mice lacking exon III (extracellular domain) of p75NTR (p75NTR−/−) (Lee et al., 1992). In studies that did not require p75NTR−/− neurons, hippocampal neurons were cultured from E16 CF-1 mouse fetuses. Tissue culture wells with or without coverslips were coated with 10 μg/ml poly-l-lysine in PBS. Cells were incubated in DMEM/F12 containing 10% fetal bovine serum and 1 mm Glutamax supplement for the first 24 h, and subsequently maintained in serum-free Neurobasal medium with 1× B27 and Glutamax supplement (Invitrogen) and antibiotics (penicillin/streptomycin and Fungizone, Invitrogen). For neuronal viability assays, neurons were seeded in 12-well plates at a density of 100,000 cells per well and allowed to mature 6–7 d. For neuritic dystrophy assays, 200,000–300,000 neurons per well were seeded into six-well plates containing 25 mm coverslips and matured for 21–22 d. Culture medium was changed every 48–72 h. Under these culture conditions, p75NTR+/+ hippocampal and basal forebrain cultures contain >95% p75NTR-immunopositive neurons (supplemental Fig. S1, available at www.jneurosci.org as supplemental material).
Quantitation of neuronal survival.
Survival assays were performed using cultures at 6–7 days in vitro (DIV), in which Aβ was added to p75NTR+/+ or p75NTR−/− neurons or, in some cases, to CF-1 wild-type neurons in the presence or absence of 9651 anti-p75NTR antibody or IgG antibody control, each added at a 1:500 dilution. After 72 h incubation, neurons were stained with Syto 13 (Invitrogen) or terminal deoxynucleotidyl transferase-mediated biotinylated UTP nick end labeling (TUNEL)/4′,6′-diamidino-2-phenylindole dihydrochloride (DAPI), using the fluorescein-12-dUTP, DeadEnd Fluorometric TUNEL System (Promega), and Vectashield + DAPI (Vector Laboratories). Stained neurons were visualized under a fluorescence microscope (Leica DM IRE2) using 520 nm (TUNEL, Syto 13) or 460 nm (DAPI, Hoechst) filters. Survival of neurons was determined based on morphological criteria as determined by phase-contrast microscopy and Syto13 (aids in cellular visualization) (Eichler et al., 1992; Yang et al., 2008). Dead or degenerating neurons were defined as those with vacuolated cytoplasm, shrunken cell bodies, and/or beaded or retracted neurites. Data are expressed as percentage of the total number of observed neurons that were scored as surviving. Neuron death was quantified with the TUNEL/DAPI system by dividing the number of nuclei exhibiting TUNEL staining by the total number of nuclei as identified by DAPI (Jana and Pahan, 2004).
Quantitation of neuritic dystrophy in hippocampal cultures.
Hippocampal neuron cultures (21 DIV) were treated with fresh culture medium containing 5 μm Aβ for 48 h, then fixed in fresh 4% paraformaldehyde. Neurites were visualized by immunostaining with MAP-2 antibody. Dystrophic neurites are defined as those showing increased tortuosity (multiple abrupt turns) (Ferreira et al., 1997) and/or diminished volume. As described previously (Yang et al., 2008), we quantitated the degree of neurite tortuosity, using a modification of an established method for assessment of neurite curvature (Knowles et al., 1999). Neurite courses from randomly selected fields were traced by a blinded observer into a series of n connected line segments using NIH Image software. The angle of each segment relative to a line connecting the endpoints of the neurite tracing (a) was calculated, each angle was subtracted from the previous angle in the chain, and the results were averaged to give the “mean differential curvature” score (MDC = Σ(ai + 1 − ai)/n). Thus, the MDC indicates the extent to which tortuosity is present, with an increasing score reflecting increased curvature. Neurite volumes were calculated based on manual tracing with Neurolucida (Microbrightfield) and were normalized to neuron length to control for neurite segments that passed out of selected fields.
c-Jun signaling assay.
p75NTR+/+ or p75NTR−/− neurons (6–7 DIV) were treated with 5 μm Aβ for 10–12 h, then fixed in fresh 4% paraformaldehyde and stained with p-c-Jun antibody and DAPI. Stained nuclei were visualized using a Leica DM IRE2 light/fluorescence microscope. The percentage of p-c-Jun expressing nuclei was quantitated in randomly selected fields (Smith and Deshmukh, 2007; Yang et al., 2008).
Generation of p75NTR−/−, APP transgenic mice.
All procedures were conducted at the Palo Alto Veteran's Administration Hospital with approval of the Committee on Animal Research. Studies used the well characterized Thy1-hAPPLond/Swe mouse model of Alzheimer's disease, which expresses human APP751 containing the London (V717I) and Swedish (K670M/N671L) mutations under control of the Thy-1 promoter, which is expressed postnatally (Rockenstein et al., 2001). Mice were maintained on a C57BL/6 background. The presence or absence of the mutant APP transgene is referred to as APPLond/Swe and APPwt, respectively. For the F1 cross, p75NTR−/−, APPwt mice (Lee et al., 1992) on a C57BL/6 background were crossed to APPLond/Swe mice to obtain the F2 generation of p75NTR+/−, APPLond/Swe or p75NTR+/−, APPwt mice. F2 mice were then intercrossed to generate multiple cohorts of mice containing each of the six possible genotypes, including p75NTR−/−, APPLond/Swe mice. Mice were aged to 5.5–7.5 months. In Thy1-hAPPLond/Swe mice, plaque deposition is known to occur by 3–4 months of age in frontal cortex and by 5–6 months in hippocampus (Rockenstein et al., 2001). After a lethal dose of 2.8% chloral hydrate, mice were perfused with saline (0.9% NaCl containing 2000 U/ml heparin). Brains were fixed in fresh 4% paraformaldehyde for 24 h and cryoprotected in 30% sucrose/PBS solution. Frozen coronal sections (50 μm) were taken through the entire brain using a Microm HM450 sliding microtome.
Immunohistochemistry.
For hippocampal dystrophic neurite analysis, sections were taken from the anterior hippocampus through bregma −2.7 mm at an intersection interval of 400 μm (i.e., every eighth section). The 8E5 anti-APP antibody (4.3 mg/ml) was biotinylated using the ProtOn Kit from Vector Laboratories (PLK-1202), and after biotinylation, staining of dystrophic neurites was optimized at an antibody dilution of 1:1000. 8E5 is directed against residues 444-592 of the 770 form of human APP (Games et al., 1995). Aβ(1-42) comprises amino acids 672-713 of human APP770; this antibody is not known to label Aβ and, therefore, does not label amyloid deposits such as plaques. However, it does serve as a useful marker of dystrophic neurites, which accumulate in the vicinity of amyloid plaques (Cras et al., 1991; Games et al., 1995; Schenk et al., 1999).
8E5 antibody also labels cell bodies such as those in the dentate gyrus and CA layers. Because our goal was to image neurite processes undergoing amyloid-induced degeneration, and not cell bodies, we focused on the central area of the hippocampus comprising the stratum lacunosum-moleculare, molecular layer of the dentate gyrus, and stratum radiatum, a region which would be expected to contain both projection fibers of hippocampal pyramidal neurons and granule cells, as well as septal cholinergic and entorhinal cortical efferent fibers.
Cholinergic cell bodies and neurites were labeled with anti-ChAT antibody (Yeo et al., 1997) at a dilution of 1:400 and, in stereological and Neurolucida studies, were counterstained with cresyl violet to visualize tissue architecture. Immunostains were developed using diaminobenzadine (Sigma) and the Vectastain ABC detection kit (Vector Laboratories). Amyloid plaques were labeled with 1% thioflavin-S stain.
Morphologic analyses of plaques and dystrophic neurites.
Dystrophic neurites and plaques were visualized using a Leica DM IRE2 light/fluorescence microscope. Percentage area occupied by dystrophic neurites in the central area of the hippocampus comprising the stratum lacunosum-moleculare, molecular layer of the dentate gyrus, and stratum radiatum was determined using ImageProPlus thresholding software (Media Cybernetics) (Schenk et al., 1999; Noda-Saita et al., 2004). Percentage area occupied by thioflavin-S-identified plaques in the hippocampus and cortex tissue was determined with an analogous method (Khan et al., 2007). Three to five sections were analyzed per mouse. One to three 10× fields covering the entire hippocampal area of each section were analyzed to achieve exhaustive sampling. For analysis of cortical plaque load, four 10× fields from cortex in the same sections that were used for hippocampal analysis were selected by a blinded observer and analyzed to achieve near exhaustive sampling (∼80–90% total cortical area per section).
ELISA detection of amyloid-β.
Hippocampal or cortical tissue was sonicated in radioimmunoprecipitation assay buffer (50 mm 1% Tris-HCl, 150 mm NaCl, 200 mm sodium orthovanadate, 1% NP40 detergent, 10% sodium deoxycholate, 10% SDS, 2× protease inhibitor mixture) (Roche Mini Tablet) and centrifuged in a Beckman TL100 ultracentrifuge at 45,000 rpm, 4°C for 30 min. The supernatant, containing soluble proteins and Aβ peptide, was retained. Aβ(x-42) was captured using antibody 21F12 [5 μg/ml, Aβ(37-42); Elan Pharmaceuticals]-coated plates, followed by detection with biotinylated 3D6 [2 μg/ml, Aβ(1-5); Elan Pharmaceuticals]. Samples were incubated with the secondary antibody, and then with avidin-HRP (1:4000 dilution; Vector Laboratories). Plates were developed using tetramethylbenzidine (TMB) as substrate (one-step Turbo TMB ELISA; Pierce Biotechnology), and optical density was read at 450 nm. Raw data were converted to nanograms per gram of wet tissue by comparison to a standard curve of synthetic Aβ.
Stereologic analysis of basal forebrain cholinergic neurons.
To visualize basal forebrain cholinergic neurons (BFCNs), every fourth 50 μm section through the entire anterior–posterior axis of the basal forebrain was stained. Systematic random sampling and unbiased stereology were used via StereoInvestigator software to determine the number and volume of BFCNs, according to methods similar to those previously established by our laboratory (Yeo et al., 1997). Using the optical disector probe for sampling, the region comprising the medial septum, and vertical and horizontal limbs of the diagonal band was delineated under a 5× objective, and neurons were then counted under a 40× objective and cellular volume of each neuron was estimated using the Nucleator probe. The thickness of sections after histological processing was determined to be 19–24 μm; thus, disector height was set at 15 μm to allow for ≥2 μm guard zones. The counting frame was set at 75 μm × 75 μm and grid size was set at 100 μm × 100 μm. Using this sampling scheme, Gunderson and Schaeffer coefficients of error were between 0.05 and 0.07.
Analysis of BFCN neurites.
Neurites of basal forebrain cholinergic neurons in the medial septal nucleus (MSN) and vertical limb of the diagonal band of Broca (VDB), which project to hippocampal and cortical areas, were analyzed using Neurolucida software (Microbrightfield) (Amendola and Durand, 2008) to manually trace neurites proceeding from neuron cell bodies in randomly selected fields comprising ∼50% of the total area. One section per mouse, containing the MSN and VDB, between +1.2 and +0.8 mm relative to bregma was analyzed. Anatomical landmarks contained within each section included the anterior part of the anterior commissure and the major island of Calleja. Typically, only one section from each series fit these criteria. Pictures (100×; images shown in Fig. 6) were taken with a Nikon Eclipse E600 microscope coupled with a DXM1200F camera through multiple z-planes and in one to two adjacent fields in the x and y axes. Photographs of z-planes within identical fields were then manually merged and adjacent fields were manually tiled in using Adobe Photoshop Version 9.02.
Figure 6.

BFCN neuritic dystrophy in Thy1-hAPPLond/Swe mice is mediated by p75NTR. A–D, Representative 100× images of ChAT-stained neurites projecting from basal forebrain cholinergic neurons from APPwt, p75NTR+/+ (A), APPwt, p75NTR−/− (B), APPLond/Swe, p75NTR+/+ (C), and APPLond/Swe, p75NTR−/− (D) mice are shown. Scale bar, 30 μm. Many neurites from APPLond/Swe, p75NTR+/+ mice exhibited degenerative changes, including interrupted segments, decreased length, and decreased volume, whereas these effects were not apparent in APPLond/Swe, p75NTR−/− mice. E, F, Neurite trees projecting from BFCNs were manually traced using Neurolucida software. Relative to APPwt, p75NTR+/+ mice, BFCN neurites of APPLond/Swe mice expressing wild-type p75NTR exhibited decreased length (E) and volume (F). However, in APPLond/Swe mice expressing p75NTR−/−, these changes were entirely absent. Asterisks (see Materials and Methods for explanation) represent statistically significant comparisons relative to APPLond/Swe, p75NTR+/+ mice. Data represent the mean ± SEM from n = 6 APPwt, p75NTR+/+ mice, 4 APPwt, p75NTR−/− mice, 7 APPLond/Swe, p75NTR+/+ mice, and 5 APPLond/Swe, p75NTR−/− mice.
Analysis of cortical cholinergic terminals.
In every 16th ChAT-stained section between bregma 1.95 and 0.10, cholinergic fibers were visualized using a Leica DM IRE2 light microscope. One 20× field covering the majority of the cingulate cortex was analyzed for each section, for a total of three to seven sections per mouse. Percentage area occupied by cholinergic fibers was determined using ImageProPlus thresholding software (Media Cybernetics).
Statistical analyses.
Statistical analyses of all experiments used ANOVA followed by the Student–Newman–Keuls post hoc test, except the studies described in Figure 5, in which two-tailed t tests were used. Significance was set at p < 0.05. For all figures, *p < 0.05, **p < 0.01, and ***p < 0.001.
Figure 5.

Neuritic dystrophy but not amyloid deposition in Thy1-hAPPLond/Swe mice is mediated by p75NTR. Dystrophic neurites were visualized with anti-APP 8E5 antibody staining in APPLond/Swe, p75NTR+/+ and p75NTR−/− mice. Upper left, APPLond/Swe, p75NTR+/+ mice exhibit prominent neuritic dystrophy. Upper right, Costaining of the identical area with thioflavin-S shows localization of dystrophic neurites with amyloid plaque. Lower left, Neuritic dystrophy appears diminished in p75NTR−/− mice. Lower right, Costaining with thioflavin-S demonstrates no gross change in plaque number or size in p75NTR−/− mice. Images were acquired at 63×. Scale bars, 25 μm. Quantitation of amyloid load by hippocampal and cortical plaque area measurement and ELISA quantitation of soluble Aβ(1-42) concentration in hippocampal and cortical extracts from APPLond/Swe, p75NTR+/+ and p75NTR−/− mice revealed no differences (see Results for ELISA data).
Results
p75NTR interacts with Aβ oligomers
It has been reported that Aβ(1-40) aggregates bind to p75NTR on cell surfaces; however, the structure of these aggregates was not determined (Yaar et al., 1997, 2002). We used FRET analysis to determine whether oligomers derived from Aβ(1-42) interact with the extracellular domain of p75NTR. FRET is an efficient technique to study protein–protein interactions, in which light excitation of a donor molecule elicits energy transfer to an acceptor when the two are in close proximity (1–10 nm) (Vogel et al., 2006), and has been used to study ligand–receptor interactions (Whitby et al., 2006; Yamamoto et al., 2008). Aβ oligomers were generated using a well established protocol (Stine et al., 2003) that has been shown by several laboratories to produce relatively pure oligomeric preparations (Dahlgren et al., 2002; Maloney et al., 2005). AFM imaging revealed that unlabeled Aβ (supplemental Fig. S2A,B, available at www.jneurosci.org as supplemental material) and fluorescein-labeled Aβ (supplemental Fig. S2C,D, available at www.jneurosci.org as supplemental material) prepared by the HFIP protocol form oligomers as expected. Particle analysis of unlabeled (supplemental Fig. S2B, available at www.jneurosci.org as supplemental material) and fluorescein-labeled Aβ (supplemental Fig. S2D, available at www.jneurosci.org as supplemental material) demonstrated formation of oligomers in both preparations. The resolution of the technique did not allow quantitation of the size distributions of the oligomeric populations; therefore, the possibility that the labeling process affected oligomer structure cannot be ruled out. The finding that ∼99% of aggregates were <5 nm in z-height confirmed the absence of larger aggregate forms such as fibrils which by AFM would have been readily detected (Yang et al., 2008). Of note, the presence of Aβ monomers in these preparations cannot be ruled out.
Emission intensities of fluorescein-Aβ and fluorescein-NGF in the presence and absence of Cy3B-p75NTR are shown in Figure 1. Solutions containing Cy3B-p75NTR with fluorescein-Aβ or fluorescein-NGF show decreased fluorescein fluorescence around 520 nm, accompanied by increased Cy3B fluorescence at 570 nm relative to emission intensities of fluorescein-NGF and fluorescein-Aβ in the absence of p75NTR. This pattern indicates energy transfer occurring from fluorescein to Cy3B groups within 10 nm, and that NGF and Aβ oligomers interact with the extracellular domain of p75NTR. In positive control studies (FITC-streptavidin/Cy3B-BtIgG), 20% FRET was detected, whereas interactions of FITC-Aβ and Cy3B-p75NTR produced an unusually large FRET signal (50%). This finding suggested at least two possible explanations. First, multiple aggregates of FITC-Aβ could bind to one Cy3B-labeled p75NTR and thereby increase the probability that FRET occurs. Second, binding of multiple FITC-Aβ oligomers to p75NTR could result in self-quenching of FITC fluorescence and thereby increase the apparent FRET signal, a well documented phenomenon (Lakowicz et al., 2003). To determine the possible contribution of these mechanisms, fluorophores were reversed (FITC-p75NTR and Cy3B-Aβ), resulting in a 20% energy transfer. This result is consistent with self-quenching of FITC-labeled Aβ oligomers, and indicates that multiple Aβ oligomers may bind to a single p75NTR molecule. In contrast, FRET did not occur when fluorescein-Aβ was incubated with heat-denatured Cy3B-p75NTR, and no FRET was observed when fluorescein-Aβ was incubated solely with Cy3B-BSA. Overall, these data support a specific interaction between Aβ and p75NTR.
Figure 1.

Aβ oligomers interact with the extracellular domain of p75NTR. For FRET analysis, the indicated proteins linked to either fluorescein or Cy3B were incubated at 500 nm in PBS solution containing 0.7% BSA. The intensity of fluorescent emissions from 500 to 750 nm was measured after excitation at λ = 490 nm (y-axis = fluorescent activity in arbitrary units). Conditions in which FRET occurred are indicated by bold lines. Incubation of fluorescein-labeled Streptavidin, NGF, and Aβ alone demonstrated no FRET. Incubation of fluorescein-labeled Aβ with denatured p75NTR-Cy3B or BSA-Cy3B also demonstrated no FRET. As a positive control, fluorescein-labeled Streptavidin (SA-FITC) was reacted with Cy3B-labeled biotinylated IgG (IgG-Bt Cy3B), resulting in a 25% energy transfer as indicated by decreased fluorescein fluorescence at 520 nm, accompanied by increased Cy3B fluorescence at 570 nm (bold line). Incubation of fluorescein-NGF or fluorescein-Aβ with Cy3B-p75NTR exhibited FRET (24% energy transfer for NGF-p75 and 50% for Aβ-p75NTR, both lines shown in bold) and, thereby, NGF and Aβ interaction with p75NTR. The relatively high transfer energy (50%) in the Aβ-p75NTR condition raised the possibility of Aβ-FITC self-quenching due to potential Aβ self-aggregation. To further assess Aβ-p75NTR interaction, a solution containing Aβ-Cy3B and p75NTR-FITC (fluorophore reversal) was submitted to FRET analysis and demonstrated 20% energy transfer (data not shown), confirming a molecular interaction between p75NTR and Aβ. Data are representative of three separate experiments.
p75NTR enables Aβ-induced neuron death
To further characterize the functional consequences of p75NTR signaling in the context of Aβ exposure, we tested the ability of Aβ oligomers to induce neuron death of neurons derived from p75NTR+/+ and p75NTR−/− mice, in which exon III, encoding the majority of the extracellular domain, has been deleted, but which express a truncated protein containing the transmembrane and intracellular domains of p75NTR. Previous studies in which Aβ was injected into the hippocampus of p75NTR+/+ and p75NTR−/− mice demonstrated protection from basal forebrain cholinergic neuron loss in mice expressing mutant p75 (Sotthibundhu et al., 2008). In addition, hippocampal neurons derived from p75NTR−/− mice exhibited the absence of Aβ-induced cell death at 24 h in vitro. In the present studies we examined Aβ effects in additional culture models. Since the degree of maturation of cultured neurons can affect responses to Aβ, we determined whether the death-promoting activity of oligomeric Aβ(1-42) in hippocampal cultures allowed to mature for 5–6 d is p75NTR dependent. In addition, we determined whether Aβ toxicity is p75NTR dependent in cultures of basal forebrain cholinergic neurons. Under each of these culture conditions, we determined that ∼95% of cells were p75NTR-expressing neurons (supplemental Fig. S1, available at www.jneurosci.org as supplemental material). Previous work in our laboratory established that a 72 h period is required to observe maximum Aβ toxicity in neuronal cultures (data not shown). After 72 h treatment with fresh culture medium (CM) alone or CM containing increasing doses (1, 2.5, 5, and 10 μm) of oligomeric Aβ, hippocampal neuron survival was quantified based on morphological criteria as described in Materials and Methods. p75NTR+/+ hippocampal neurons exhibited dose-dependent increases in Aβ-induced neuron death (Fig. 2A). Aβ also induced death in p75NTR−/− hippocampal neurons at most doses tested (2.5, 5, and 10 μm). However, p75NTR−/− cultures demonstrated a 1.5- to 2-fold rightward shift in the dose–response curve, with 25–40% increased survival at doses of 1, 2.5, and 5 μm Aβ. Maximum toxicity in both p75NTR+/+ and p75NTR−/− cultures was reached at 10 μm Aβ. p75NTR+/+ and p75NTR−/− basal forebrain cultures responded with a similar shift in dose–response curve and increased survival of p75NTR−/− cells (Fig. 2B).
Figure 2.

p75NTR modulates Aβ-induced neuron death. p75NTR+/+ or p75NTR−/− neurons, 6–7 DIV, were treated with increasing doses of Aβ for 72 h then fixed in fresh paraformaldehyde. A, B, Hippocampal (A) or basal forebrain (B) neurons were photographed under phase contrast microscopy and survival was quantified based on morphological criteria. p75NTR+/+ and p75NTR−/− neurons each exhibited dose-dependent decreases in survival. In both hippocampal and basal forebrain cultures, p75NTR−/− neurons showed significantly less Aβ-induced death than p75NTR+/+ neurons at multiple Aβ doses, with 25–40% more neurons surviving (indicated by asterisks; see Materials and Methods for explanation). Hippocampal neuron data represent n = 46–56 fields from six separate cultures (p75NTR+/+) or 30–40 fields from four separate cultures (p75NTR−/−). Basal forebrain neuron data represent n = 28–38 fields from four separate p75NTR+/+ and p75NTR−/− cultures. C, To confirm the morphologic findings described in A, B, hippocampal neuron death was quantified by TUNEL analysis. p75NTR+/+ and p75NTR−/− hippocampal neurons each exhibited increases in death proportional to the dose of Aβ; however, at multiple doses of Aβ, p75NTR−/− neurons exhibited only 60–80% of death exhibited by p75NTR+/+. Data represent n = 80–160 fields from seven separate cultures (p75NTR+/+) or 70–89 fields from six separate cultures (p75NTR−/−). D, To confirm the modulatory effect of p75NTR on Aβ-induced neuron death using an independent method, 6–7 DIV p75NTR+/+ or p75NTR−/− hippocampal neurons were treated with fresh CM alone, or in the presence or absence of Aβ, p75NTR antibody, or control IgG. p75NTR antibody (but not IgG control) prevented entirely Aβ-induced neuron death when treated with 5 μm Aβ, whereas the protective effect was significantly diminished when neurons were treated with 10 μm Aβ. Data represent the means of n = 20–30 fields from six independent experiments.
To verify these findings, TUNEL analysis was performed in p75NTR+/+ and p75NTR−/− hippocampal cultures (Fig. 2C). In concordance with the morphologic data, dose-dependent increases in neuron death (% TUNEL/DAPI) were observed in neurons of both genotypes. In p75NTR−/− cultures, a rightward shift in the dose–response curve was again observed with a reduction in cell death by 20–40% compared with p75NTR+/+ cultures at intermediate doses. In cultures of both genotypes, maximum toxicity was reached at 10 μm Aβ. Together, these findings show that hippocampal and basal forebrain neuron cell death induced by oligomeric Aβ is only partially p75NTR dependent when observed after 72 h of Aβ exposure.
To confirm the modulatory role of p75NTR using a strategy distinct from genetic knock-down, we tested the ability of a well characterized p75NTR-blocking antibody, 9651, directed against the cysteine repeat regions II, III, and IV of the extracellular domain of p75NTR, to decrease Aβ toxicity in hippocampal neurons (Fig. 2D). Neither anti-p75NTR nor an IgG control affected neuron survival relative to baseline; however, anti-p75NTR (but not the IgG control) completely inhibited death induced by 5 μm Aβ, a finding similar to that of a previous study which used a p75NTR antibody directed to the extracellular domain of p75NTR (Sotthibundhu et al., 2008). In contrast, at 10 μm Aβ, addition of anti-p75NTR was only partially protective, consistent with the finding of partial protection in p75NTR−/− cultures at higher doses of Aβ. Thus, our data support the view that p75NTR significantly contributes to or enables Aβ-induced hippocampal neuronal death. However, a significant, though diminished, Aβ toxicity persists in the absence of normal p75NTR signaling. The present study also demonstrated a similar role for p75NTR in cultured basal forebrain cholinergic neurons, indicating a potential fundamental property of p75NTR in mediating or enabling Aβ toxicity that is not confined to hippocampal neurons.
p75NTR enables Aβ-induced neuritic dystrophy
Neuritic dystrophy, including abnormally tortuous and atrophic neurites (Knowles et al., 1999; Tsai et al., 2004), is part of a spectrum of degenerative changes which results from cytoskeletal derangement (Heredia et al., 2006), precedes neuron death (Grace et al., 2002), and manifests early in AD (Braak et al., 2006). Unlike cell death, the presence of neuritic dystrophy in early stages of AD and its likely role in contributing to early stages of dementia make it an important morphologic feature relevant to potential therapeutic targeting. The role of p75NTR in mediating Aβ-induced neuritic dystrophy has not been previously explored. In hippocampal cultures allowed to mature in vitro for ≥21 d, a period during which mature forms of tau protein become expressed, we and others (Ferreira et al., 1997; Yang et al., 2008) have observed that 48 h treatment with oligomeric Aβ results in minimal cell death. Instead, and perhaps more relevant to early and mid stages of AD, we found excessive tortuosity and diminished neurite volume resembling dystrophic features found in AD.
The 21 DIV p75NTR+/+ and p75NTR−/− hippocampal neurons were treated with 5 μm Aβ for 48 h, then fixed and stained for MAP-2 to visualize neurites by fluorescence microscopy (Fig. 3). In the presence of CM alone, p75NTR+/+ and p75NTR−/− neurites exhibited relatively straight courses with little tortuosity (Fig. 3, A and C, respectively). Treatment with 5 μm Aβ resulted in pronounced dystrophic changes including loss of normal straight appearance in p75NTR+/+ neurites (Fig. 3B), whereas the appearance of dystrophy was mild to absent in p75NTR−/− cultures (Fig. 3D). Neuritic dystrophy was then quantified to generate MDC scores, indicative of neurite tortuosity (Fig. 3E). Treatment with Aβ induced a significant increase in MDC in p75NTR+/+ cultures, whereas this effect was entirely absent in p75NTR−/− cultures. To further investigate degenerative Aβ-induced changes, we measured neurite volume and found that Aβ treatment resulted in significantly diminished neurite volume in p75NTR+/+ cultures, an effect that was not observed in p75NTR−/− cultures (Fig. 3F). These results indicate that full-length p75NTR signaling is required for Aβ-induced neuritic dystrophy.
Figure 3.

p75NTR mediates Aβ-induced neuritic dystrophy. A–D, p75NTR+/+ or p75NTR−/− hippocampal neurons, 21 DIV, were treated with fresh CM alone or with CM containing 5 μm Aβ for 48 h, then fixed in fresh paraformaldehyde and stained for MAP-2. Neurons were photographed with fluorescence microscopy. In the presence of CM alone, p75NTR+/+ (A) and p75NTR−/− (C) neurites were indistinguishable and without excessive tortuosity. In the presence of Aβ, p75NTR+/+ neurons exhibited pronounced neuritic dystrophy and shrinkage (B), whereas the appearance of dystrophy in p75NTR −/− neurons was greatly diminished (D). E, Quantitation of neurite tortuosity revealed a significant ∼1.3-fold increase in mean differential curvature in p75NTR+/+ neurons treated with Aβ, whereas this effect was absent in p75NTR−/− neurons. Data represent the means from n = 25–31 fields from three separate p75NTR+/+ cultures and four p75NTR−/− cultures. F, Quantitation of neurite volume normalized to neurite length demonstrated that treatment of p75NTR+/+ neurons with Aβ resulted in a 42% decrease in neurite volume, whereas this effect was absent in p75NTR−/− cultures. Data represent the means from 12 to 14 fields from three separate cultures for each genotype.
p75NTR mediates Aβ-induced c-Jun activation
The c-Jun transcription factor is downstream of c-Jun kinase, a pathway which has been previously linked to p75NTR and which is critical in Aβ-induced neurodegeneration (Bozyczko-Coyne et al., 2001; Morishima et al., 2001; Fogarty et al., 2003). Aβ-induced c-Jun activation has not been investigated in p75NTR−/− neurons. To do so, 6–7 DIV p75NTR+/+ and p75NTR−/− cultures were treated with 5 μm Aβ for 10–12 h, then fixed and stained for phosphorylated c-Jun and DAPI. Quantitation of phosphorylated c-Jun has been established as an indicator of c-jun activation (Smith and Deshmukh, 2007; Thakur et al., 2007; Yang et al., 2008). Fluorescence microscopy revealed that relative to culture medium alone (Fig. 4A), a larger number of p75NTR+/+ neurons treated with Aβ exhibited p-c-Jun-positive nuclei (Fig. 4B). In contrast, this effect appeared to be absent in p75NTR−/− cultures treated with CM or Aβ (Fig. 4, C and D, respectively). As shown in Figure 4E, quantitation revealed that in p75NTR+/+ cultures, Aβ induced an ∼2.5-fold increase in the percentage of p-c-Jun-positive nuclei, whereas Aβ-induced c-Jun activation was lost entirely in p75NTR−/− cultures.
Figure 4.
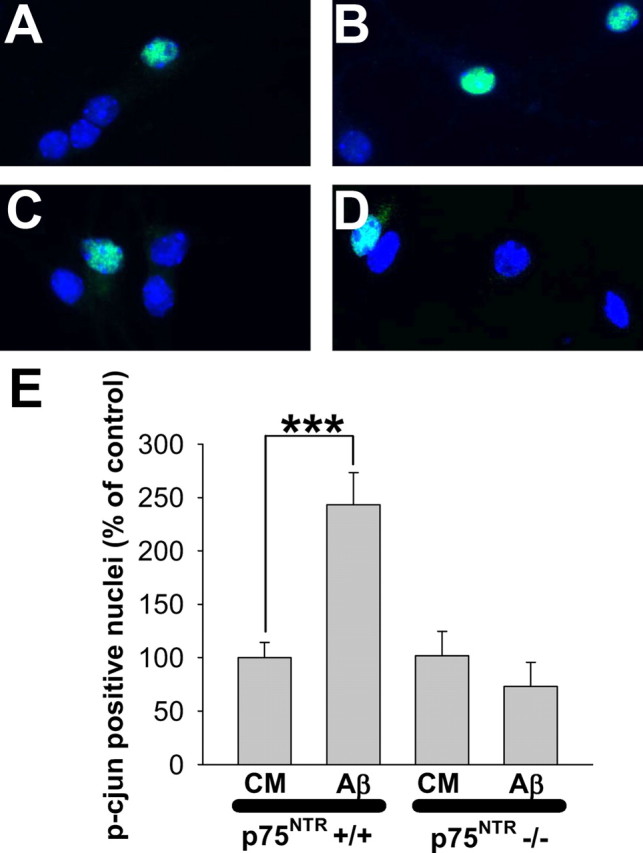
p75NTR mediates Aβ-induced c-Jun activation. A–D, p75NTR+/+ or p75NTR−/− hippocampal neurons, 6–7 DIV, were treated with CM or CM containing 5 μm Aβ for 10–12 h, then fixed in fresh paraformaldehyde and immunostained for phospho-c-Jun and DAPI. Relative to CM alone (A), Aβ-treatment of p75NTR+/+ cells resulted in a higher frequency of p-c-Jun-positive nuclei (B). In contrast, cultures of p75NTR−/− neurons treated with CM (C) or Aβ (D) appeared similar. E, Quantitative analysis revealed that Aβ induced a significant ∼2.5-fold increase in p-c-Jun-positive nuclei of p75NTR+/+ neurons, whereas this effect was entirely absent in p75NTR−/− neurons. Data represent the mean of n = 40–50 fields per experimental condition from three independent experiments. A total of 300–600 neurons were analyzed per condition; in the presence of CM alone, 5–10% of both p75NTR+/+ and p75NTR−/− neurons exhibited p-c-jun-positive nuclei.
Generation of a transgenic mouse model of AD lacking wild-type p75NTR
Although a role for p75NTR in contributing to Aβ-mediated toxicity has been demonstrated in vitro, its role in a chronic in vivo AD model is unknown. To address this question, p75NTR exon III−/− mice were crossed with Thy1-hAPPLond/Swe transgenic mice, which exhibit chronic excessive levels of Aβ in brain tissue, plaque formation, and neuritic dystrophy (Rockenstein et al., 2001). Thy1-hAPPLond/Swe mice possessing or lacking the transgene are referred to as APPLond/Swe and APPwt, respectively. Supplemental Table S1, available at www.jneurosci.org as supplemental material, summarizes mice used in this study, including the frequency with which each of the six possible genotypes was observed compared with the expected frequency. Exon III p75NTR−/− mice were present at weaning at ∼50% of the expected rate, regardless of whether they possessed the APPLond/Swe transgene. APPLond/Swe mice were noted to exhibit 70% survival within the first 4 months of age. We have routinely observed both of these effects in each of our p75NTR and Thy1-hAPPLond/Swe transgenic mouse colonies. APPLond/Swe mice expressing only mutant p75NTR (APPLond/Swe, p75NTR−/−) were present at weaning at ∼6% of the time (relative to the predicted 12.5%) and exhibited ∼60% survival before 4 months of age. Thus, it appears that decreased survival in these mice was no more than expected from the separate effects of mutant p75NTR and the APP transgene. APPLond/Swe, p75NTR−/− mice exhibited no gross abnormalities and were allowed to age until 5.5–7.5 months, a time at which plaques and associated neurodegeneration are present in multiple brain areas including cortex and hippocampus in APPLond/Swe mice (Rockenstein et al., 2001).
Hippocampal neuritic dystrophy but not amyloid levels are diminished in APPLond/Swe, p75NTR−/− mice
To determine whether p75NTR plays a role in chronic accumulation and deposition of Aβ, sections from APPLond/Swe, p75NTR+/+ or p75NTR−/− mice were colabeled with thioflavin-S and anti-APP 8E5 antibody to identify amyloid deposits and neuritic dystrophy, respectively. As described in Materials and Methods, 8E5 does not label Aβ in plaques, but is an established marker of dystrophic neurites (Cras et al., 1991; Games et al., 1995; Schenk et al., 1999). As shown in Figure 5, in APPLond/Swe, p75NTR+/+ mice, dystrophic neurites (upper left) and associated plaques (upper right) were prominent. Costaining with thioflavin-S revealed that many but not all dystrophic neurites were associated with amyloid deposits (data not shown). In APPLond/Swe, p75NTR−/− mice, neuritic dystrophy appeared diminished (Fig. 5, lower left), whereas plaques did not appear to be affected (lower right). Plaque area quantification in APPLond/Swe, p75NTR+/+ and p75NTR−/− mice revealed no significant differences in hippocampal or cortical plaque load (data not shown). APPwt mice, which exhibit a complete absence of visible amyloid deposits or neuritic dystrophy, were not included in the analysis. These morphological plaque findings were consistent with ELISA analysis, which revealed no significant differences in hippocampal or cortical levels of soluble Aβ(1-42). APPLond/Swe, p75NTR+/+ mice contained, in the hippocampus, 9.5 ± 0.5 ng of Aβ(1-42)/g of wet tissue and in the cortex, 13.4 ± 1.3 ng/g. APPLond/Swe, p75NTR−/− mice contained, in the hippocampus, 9.2 ± 0.5 ng/g and in the cortex, 12.28 ± 1.2 ng/g.
To quantitatively determine whether p75NTR modulates AD-like amyloid-induced neurodegeneration in vivo, hippocampal neuritic dystrophy, as detected by 8E5 anti-APP antibody, was measured in the stratum lacunosum-moleculare, molecular layer of the dentate gyrus, and stratum radiatum regions in APPLond/Swe, p75NTR−/− and APPLond/Swe, p75NTR+/+ mice. This region contains projection fibers of hippocampal pyramidal neurons and granule cells, as well as septal cholinergic and entorhinal cortical efferent fibers. The absence of APP-containing cell bodies, which are also labeled by 8E5 antibody, within these layers facilitates quantitation of dystrophic neurites. Many but not all of these fibers are expected to express p75NTR. Extensive 8E5 labeling of cell bodies in cortical tissue prevented accurate quantitation of neuritic dystrophy in the cortex. In APPLond/Swe, p75NTR−/− mice, neuritic dystrophy (as quantitated by percentage of hippocampal area immunostained by anti-APP 8E5) was decreased to 34.5 ± 11.1% (mean ± SEM, p < 0.01, n = 6 APPLond/Swe, p75NTR+/+ mice and 5 APPLond/Swe, p75NTR−/− mice) of that seen in APPLond/Swe, p75NTR+/+ mice. The finding of reduced hippocampal neuritic dystrophy in the setting of unchanged Aβ levels mirrors the in vitro observation that at a given dose of Aβ, neuritic dystrophy is reduced in p75NTR−/− cultures, and provides the first evidence that p75NTR signaling plays a major role in the development of AD-like pathology in a chronic in vivo model of AD. Since APP staining is not specific for p75NTR-expressing neurites, we may have underestimated the effect of removing p75NTR in this analysis.
p75NTR mediates amyloid-induced BFCN neuritic dystrophy inAPPLond/Swe mice
BFCNs comprise a population of neurons in the brain which projects to cortical and hippocampal targets, is critical for attention and cognition, and is particularly vulnerable in aging and AD (Davies and Maloney, 1976; Whitehouse et al., 1982). p75NTR is known to regulate the size and projection fibers of BFCNs (Yeo et al., 1997; Greferath et al., 2000). To determine whether p75NTR contributes to AD-like atrophy or loss of BFCNs in Thy1-hAPPLond/Swe mice, we performed unbiased stereological analysis to assess the number and cell body volume of BFCNs from APPwt and APPLond/Swe mice each containing either wild-type or mutant p75NTR. Consistent with previous work by our group and others, there was a trend toward increased number of BFCNs in mice lacking normal p75NTR, and BFCN volume was significantly increased in APPwt and APPLond/Swe p75NTR−/− mice. However, APPLond/Swe mice do not exhibit decreased BFCN absolute number or volume relative to APPwt (supplemental Table S2, available at www.jneurosci.org as supplemental material). Thus, shrinkage or frank loss of BFCN cell bodies may represent end-stage degeneration not detectable in APPLond/Swe mice between 5.5 and 7.5 months of age.
To determine whether earlier stage changes such as BFCN neuritic dystrophy are evident in APPLond/Swe mice, we assessed the structure of neurite trees proceeding from BFCNs of APPwt and APPLond/Swe mice in the presence or absence of wild-type p75NTR. Representative images of BFCN neurites are shown in Figure 6. Relative to APPwt, p75NTR+/+ and APPwt, p75NTR−/− mice (Fig. 6A,B), BFCN ChAT-positive neurites in APPLond/Swe mice expressing wild-type p75NTR (Fig. 6C) appeared shorter and thinner. These changes were not observed in APPLond/Swe, p75NTR−/− mice (Fig. 6D). Quantitative analysis demonstrated that relative to APPwt mice, APPLond/Swe mice expressing wild-type p75NTR exhibited significantly decreased average neurite length (∼15%) and volume (∼30%). In BFCN trees of APPLond/Swe mice expressing mutant p75NTR, these degenerative changes were entirely absent, with neurite morphology resembling that of APPwt mice (Fig. 6E,F).
To establish whether cholinergic neurite changes observed in the basal forebrain result in loss of projections in areas of target innervation, density of ChAT-positive fibers in the cingulate cortex was quantified. Figure 7, A to D, shows that relative to APPwt mice, cholinergic fibers in the cingulate cortex in APPLond/Swe, p75NTR+/+ mice appeared diminished in density, whereas this was not observed in APPLond/Swe, p75NTR−/− mice. Quantitation revealed an ∼50% decrease in cholinergic projections in the cortex of APPLond/Swe, p75NTR+/+ mice relative to APPwt mice. This decrease was mitigated entirely in APPLond/Swe, p75NTR−/− mice (Fig. 7E). In fact, relative to APPwt, p75NTR +/+ mice, APPLond/Swe, p75NTR−/− mice had substantially more dense cholinergic fibers (p < 0.05). This suggests that interference with p75NTR signaling prevents degeneration of basal forebrain cholinergic projections in an in vivo model of chronic Aβ-induced degeneration.
Figure 7.

A–D, Loss of cortical cholinergic projection fibers in Thy1-hAPPLond/Swe mice is mediated by p75NTR. Relative to APPwt, p75NTR+/+ (A) and APPwt, p75NTR−/− mice (B), ChAT-stained fibers in the cingulate cortex of APPLond/Swe, p75NTR+/+ mice (C) appeared diminished, whereas this effect was not apparent in APPLond/Swe, p75NTR−/− mice (D). Images were acquired at 100×. Scale bar, 20 μm. E, Compared with APPwt mice, cortical cholinergic fiber density was reduced by ∼50% in APPLond/Swe, p75NTR+/+ mice but not in APPLond/Swe, p75NTR−/− mice. Data represent the mean ± SEM percent area relative to wild-type mice, n = 5 APPwt, p75NTR+/+ mice, 5 APPwt, p75NTR−/− mice, 8 APPLond/Swe, p75NTR+/+ mice, and 5 APPLond/Swe, p75NTR−/− mice. Asterisks represent statistically significant comparisons relative to APPLond/Swe, p75NTR+/+ mice (see Materials and Methods for explanation).
Discussion
These studies demonstrate that oligomeric Aβ(1-42) associates with the extracellular domain of p75NTR, that the ability of oligomeric Aβ to induce neurite degeneration (in addition to neuronal death) requires the presence of intact, wild-type p75NTR, and that p75NTR exon III deletion significantly reduces neuritic dystrophy and loss of BFCN neurites in a chronic, transgenic model of Aβ overexpression. The findings that Aβ-induced toxicity is reduced in hippocampal and basal forebrain neuronal cultures lacking p75NTR are consistent with the studies of Sotthibundhu et al. (2008). However, the present study further demonstrates that at a later time point, in more mature cultures, Aβ-induced death is not entirely prevented in p75NTR−/− neurons.
Yaar et al. (1997, 2002) found that Aβ(1-40) aggregates bind to p75NTR, suggesting a potential role for p75NTR in mediating Aβ effects. To determine whether oligomeric forms of Aβ(1-42) interact with p75NTR, we performed FRET analysis using fluorescein-labeled Aβ(1-42), which forms oligomers documented by AFM imaging. Energy transfer occurring between fluorophores linked to Aβ oligomers and p75NTR extracellular domain indicated a molecular interaction between Aβ and p75NTR, consistent with the possibility that Aβ oligomers are ligands for p75NTR. However, under these experimental conditions, it is possible that monomeric forms of Aβ also interact with p75NTR. Future work will further characterize the forms of Aβ binding to p75NTR.
We found that removing p75NTR exon III significantly shifts Aβ oligomer toxicity dose–response curves in hippocampal and basal forebrain neurons, but p75NTR does not play an “all-or-none” role in mediating Aβ-induced neuron death as suggested by previous studies (Rabizadeh et al., 1994; Yaar et al., 1997, 2002; Kuner et al., 1998; Perini et al., 2002; Coulson, 2006; Sotthibundhu et al., 2008). Our findings are also consistent with previous studies indicating that Aβ likely induces degeneration through multiple mechanisms and targets; these might include p75NTR coreceptors such as LINGO or Nogo (Barker, 2004) or other non-p75 targets such as integrins or NMDA receptors (Dineley et al., 2001; Kayed et al., 2004; Verdier and Penke, 2004). Aβ oligomers could promote degeneration through p75NTR by a number of potential mechanisms. Aβ-induced promotion of extracellular cleavage and inhibition of γ-secretase cleavage of the p75NTR C-terminal domain has been reported, and may represent mechanisms by which Aβ signals through p75NTR (Sotthibundhu et al., 2008). However, p75NTR signaling might also contribute to Aβ-induced neurodegeneration independently of a physical interaction with Aβ.
Neuronal cytoskeletal perturbation, which is known to occur earlier in AD than cellular death, may impact function and be reversible (Grace et al., 2002; Lombardo et al., 2003; Brendza et al., 2005). In contrast to p75NTR+/+ matured hippocampal neurons treated with Aβ, the appearance of excessive tortuosity and decreased volume was almost entirely absent in Aβ-treated p75NTR−/− neurons.
The findings that p75NTR mediates or enables Aβ-induced neuron death and neuritic dystrophy in neuronal cultures led to the question of whether p75NTR plays any role in chronic, AD-like degeneration in vivo. Relative to APPLond/Swe, p75NTR+/+ mice, APPLond/Swe mice lacking full-length p75NTR demonstrated no change in brain amyloid or Aβ concentration, but a 65% decrease in hippocampal neuritic dystrophy was observed, indicating that p75NTR plays a substantial role in Aβ-associated neurodegeneration in vivo, a correlate of our observations in matured hippocampal cultures.
p75NTR is expressed by and regulates the trophic state of BFCNs (Yeo et al., 1997; Greferath et al., 2000), and BFCN degeneration has long been thought to play a major role in diminished cognitive function associated with AD and aging (Coyle et al., 1983; Salehi et al., 2003; Capsoni and Cattaneo, 2006). Direct, intraparenchymal infusion of synthetic Aβ into the hippocampus induces loss of basal forebrain cholinergic neurons in p75NTR+/+ but not p75NTR−/− mice (Sotthibundhu et al., 2008), consistent with our in vitro findings in p75NTR−/− cultures. These observations raise the possibility that mutant p75NTR might also protect against BFCN degeneration in a transgenic mouse model of AD. In Thy1-hAPPLond/Swe mice, as demonstrated here, and in most other transgenic AD models (McGowan et al., 2006), no significant loss of BFCNs occurs. In contrast, neuritic degeneration, including that associated with BFCNs, has been documented in mouse models of AD (Stokin et al., 2005) and in AD patients (Wong et al., 1999; German et al., 2003; Stokin et al., 2005). In APPLond/Swe, p75NTR+/+ mice, neurite trees of BFCNs exhibited decreased length and volume, an effect that was entirely prevented in APPLond/Swe mice lacking wild-type p75NTR. Furthermore, cholinergic cortical fiber density was reduced by ∼50% in APPLond/Swe, p75NTR+/+ mice but not in those lacking wild-type p75NTR. Thus, wild-type p75NTR is necessary for amyloid-associated BFCN neuritic dystrophy. One possible explanation for this result is a developmental difference in p75NTR−/− mice. However, there were no significant differences detected in the length or volume of BFCN neurite trees in APPwt p75NTR+/+ and p75NTR−/− mice, making this a less likely possibility. Future studies to assess p75NTR+/+ and p75NTR−/−, APPLond/Swe mice in end stages of pathology, and/or studies in which p75NTR could be functionally removed in later stages of degenerative change, might shed additional light on the role of this receptor in amyloid-associated BFCN degeneration.
Given the known range of Aβ targets and mechanisms, future treatment of AD will likely require the simultaneous application of multiple distinct strategies to decrease Aβ brain levels and counteract its deleterious effects (Longo and Massa, 2004a; Longo et al., 2007). This work demonstrates a significant contributory role of p75NTR in Aβ-induced degeneration, and implicates p75NTR as a major target in neuroprotective strategies for AD.
Footnotes
This project was supported by the Institute for the Study of Aging (F.M.L.), Alzheimer's Association (F.M.L.), the Eastern Chapter of the North Carolina Alzheimer's Association, the Richard M. Lucas, Jean Perkins, and Coyote Foundations (F.M.L.), Donald L. Lucas (F.M.L.), National Institute of Neurological Disorders and Stroke Grant F30 NA051971 (J.K.), and the Veterans Administration (S.M.M.). We thank Dr. Eliezer Masliah at University of California, San Diego for providing hAPP tg mice.
References
- Amendola J, Durand J. Morphological differences between wild-type and transgenic superoxide dismutase 1 lumbar motoneurons in postnatal mice. J Comp Neurol. 2008;511:329–341. doi: 10.1002/cne.21818. [DOI] [PubMed] [Google Scholar]
- Barker PA. p75NTR is positively promiscuous; novel partners and new insights. Neuron. 2004;42:529–533. doi: 10.1016/j.neuron.2004.04.001. [DOI] [PubMed] [Google Scholar]
- Bozyczko-Coyne D, O'Kane TM, Wu ZL, Dobrzanski P, Murthy S, Vaught JL, Scott RW. CEP-1347/KT-7515, an inhibitor of SAPK/JNK pathway activation, promotes survival and blocks multiple events associated with Abeta-induced cortical neuron apoptosis. J Neurochem. 2001;77:849–863. doi: 10.1046/j.1471-4159.2001.00294.x. [DOI] [PubMed] [Google Scholar]
- Braak H, Alafuzoff I, Arzberger T, Kretzschmar H, Del Tredici K. Staging of Alzheimer disease-associated neurofibrillary pathology using paraffin sections and immunocytochemistry. Acta Neuropathol. 2006;112:389–404. doi: 10.1007/s00401-006-0127-z. [DOI] [PMC free article] [PubMed] [Google Scholar]
- Brendza RP, Bacskai BJ, Cirrito JR, Simmons KA, Skoch JM, Klunk WE, Mathis CA, Bales KR, Paul SM, Hyman BT, Holtzman DM. Anti-Abeta antibody treatment promotes the rapid recovery of amyloid-associated neuritic dystrophy in PDAPP transgenic mice. J Clin Invest. 2005;115:428–433. doi: 10.1172/JCI23269. [DOI] [PMC free article] [PubMed] [Google Scholar]
- Capsoni S, Cattaneo A. On the molecular basis linking nerve growth factor (NGF) to Alzheimer's disease. Cell Mol Neurobiol. 2006;26:619–633. doi: 10.1007/s10571-006-9112-2. [DOI] [PMC free article] [PubMed] [Google Scholar]
- Coulson EJ. Does the p75 neurotrophin receptor mediate Abeta-induced toxicity in Alzheimer's disease? J Neurochem. 2006;98:654–660. doi: 10.1111/j.1471-4159.2006.03905.x. [DOI] [PubMed] [Google Scholar]
- Coyle JT, Price DL, DeLong MR. Alzheimer's disease: a disorder of cortical cholinergic innervation. Science. 1983;219:1184–1190. doi: 10.1126/science.6338589. [DOI] [PubMed] [Google Scholar]
- Cras P, Kawai M, Lowery D, Gonzalez-DeWhitt P, Greenberg B, Perry G. Senile plaque neurites in Alzheimer disease accumulate amyloid precursor protein. Proc Natl Acad Sci U S A. 1991;88:7552–7556. doi: 10.1073/pnas.88.17.7552. [DOI] [PMC free article] [PubMed] [Google Scholar]
- Dahlgren KN, Manelli AM, Stine WB, Jr, Baker LK, Krafft GA, LaDu MJ. Oligomeric and fibrillar species of amyloid-beta peptides differentially affect neuronal viability. J Biol Chem. 2002;277:32046–32053. doi: 10.1074/jbc.M201750200. [DOI] [PubMed] [Google Scholar]
- Davies P, Maloney AJ. Selective loss of central cholinergic neurons in Alzheimer's disease. Lancet. 1976;2:1403. doi: 10.1016/s0140-6736(76)91936-x. [DOI] [PubMed] [Google Scholar]
- Dechant G, Barde YA. The neurotrophin receptor p75(NTR): novel functions and implications for diseases of the nervous system. Nat Neurosci. 2002;5:1131–1136. doi: 10.1038/nn1102-1131. [DOI] [PubMed] [Google Scholar]
- Dineley KT, Westerman M, Bui D, Bell K, Ashe KH, Sweatt JD. β-Amyloid activates the mitogen-activated protein kinase cascade via hippocampal α7 nicotinic acetylcholine receptors: in vitro and in vivo mechanisms related to Alzheimer's disease. J Neurosci. 2001;21:4125–4133. doi: 10.1523/JNEUROSCI.21-12-04125.2001. [DOI] [PMC free article] [PubMed] [Google Scholar]
- Eichler ME, Dubinsky JM, Rich KM. Relationship of intracellular calcium to dependence on nerve growth factor in dorsal root ganglion neurons in cell culture. J Neurochem. 1992;58:263–269. doi: 10.1111/j.1471-4159.1992.tb09305.x. [DOI] [PubMed] [Google Scholar]
- Ferreira A, Lu Q, Orecchio L, Kosik KS. Selective phosphorylation of adult tau isoforms in mature hippocampal neurons exposed to fibrillar A beta. Mol Cell Neurosci. 1997;9:220–234. doi: 10.1006/mcne.1997.0615. [DOI] [PubMed] [Google Scholar]
- Fogarty MP, Downer EJ, Campbell V. A role for c-Jun N-terminal kinase 1 (JNK1), but not JNK2, in the beta-amyloid-mediated stabilization of protein p53 and induction of the apoptotic cascade in cultured cortical neurons. Biochem J. 2003;371:789–798. doi: 10.1042/BJ20021660. [DOI] [PMC free article] [PubMed] [Google Scholar]
- Games D, Adams D, Alessandrini R, Barbour R, Berthelette P, Blackwell C, Carr T, Clemens J, Donaldson T, Gillespie F, Guido T, Hagopian S, Johnson-Wood K, Khan K, Lee M, Leibowitz P, Lieberburg I, Little S, Masliah E, McConlogue L, et al. Alzheimer-type neuropathology in transgenic mice overexpressing V717F beta-amyloid precursor protein. Nature. 1995;373:523–527. doi: 10.1038/373523a0. [DOI] [PubMed] [Google Scholar]
- German DC, Yazdani U, Speciale SG, Pasbakhsh P, Games D, Liang CL. Cholinergic neuropathology in a mouse model of Alzheimer's disease. J Comp Neurol. 2003;462:371–381. doi: 10.1002/cne.10737. [DOI] [PubMed] [Google Scholar]
- Grace EA, Rabiner CA, Busciglio J. Characterization of neuronal dystrophy induced by fibrillar amyloid beta: implications for Alzheimer's disease. Neuroscience. 2002;114:265–273. doi: 10.1016/s0306-4522(02)00241-5. [DOI] [PubMed] [Google Scholar]
- Greferath U, Bennie A, Kourakis A, Bartlett PF, Murphy M, Barrett GL. Enlarged cholinergic forebrain neurons and improved spatial learning in p75 knockout mice. Eur J Neurosci. 2000;12:885–893. doi: 10.1046/j.1460-9568.2000.00976.x. [DOI] [PubMed] [Google Scholar]
- Hashimoto Y, Kaneko Y, Tsukamoto E, Frankowski H, Kouyama K, Kita Y, Niikura T, Aiso S, Bredesen DE, Matsuoka M, Nishimoto I. Molecular characterization of neurohybrid cell death induced by Alzheimer's amyloid-beta peptides via p75NTR/PLAIDD. J Neurochem. 2004;90:549–558. doi: 10.1111/j.1471-4159.2004.02513.x. [DOI] [PubMed] [Google Scholar]
- Heredia L, Helguera P, de Olmos S, Kedikian G, Solá Vigo F, LaFerla F, Staufenbiel M, de Olmos J, Busciglio J, Cáceres A, Lorenzo A. Phosphorylation of actin-depolymerizing factor/cofilin by LIM-kinase mediates amyloid β-induced degeneration: a potential mechanism of neuronal dystrophy in Alzheimer's disease. J Neurosci. 2006;26:6533–6542. doi: 10.1523/JNEUROSCI.5567-05.2006. [DOI] [PMC free article] [PubMed] [Google Scholar]
- Hu XY, Zhang HY, Qin S, Xu H, Swaab DF, Zhou JN. Increased p75(NTR) expression in hippocampal neurons containing hyperphosphorylated tau in Alzheimer patients. Exp Neurol. 2002;178:104–111. doi: 10.1006/exnr.2002.8018. [DOI] [PubMed] [Google Scholar]
- Huber LJ, Chao MV. Mesenchymal and neuronal cell expression of the p75 neurotrophin receptor gene occur by different mechanisms. Dev Biol. 1995;167:227–238. doi: 10.1006/dbio.1995.1019. [DOI] [PubMed] [Google Scholar]
- Jana A, Pahan K. Fibrillar amyloid-beta peptides kill human primary neurons via NADPH oxidase-mediated activation of neutral sphingomyelinase. Implications for Alzheimer's disease. J Biol Chem. 2004;279:51451–51459. doi: 10.1074/jbc.M404635200. [DOI] [PMC free article] [PubMed] [Google Scholar]
- Kayed R, Sokolov Y, Edmonds B, McIntire TM, Milton SC, Hall JE, Glabe CG. Permeabilization of lipid bilayers is a common conformation-dependent activity of soluble amyloid oligomers in protein misfolding diseases. J Biol Chem. 2004;279:46363–46366. doi: 10.1074/jbc.C400260200. [DOI] [PubMed] [Google Scholar]
- Khan AA, Mao XO, Banwait S, Jin K, Greenberg DA. Neuroglobin attenuates beta-amyloid neurotoxicity in vitro and transgenic Alzheimer phenotype in vivo. Proc Natl Acad Sci U S A. 2007;104:19114–19119. doi: 10.1073/pnas.0706167104. [DOI] [PMC free article] [PubMed] [Google Scholar]
- Knowles RB, Wyart C, Buldyrev SV, Cruz L, Urbanc B, Hasselmo ME, Stanley HE, Hyman BT. Plaque-induced neurite abnormalities: implications for disruption of neural networks in Alzheimer's disease. Proc Natl Acad Sci U S A. 1999;96:5274–5279. doi: 10.1073/pnas.96.9.5274. [DOI] [PMC free article] [PubMed] [Google Scholar]
- Kuner P, Schubenel R, Hertel C. Beta-amyloid binds to p57NTR and activates NFkappaB in human neuroblastoma cells. J Neurosci Res. 1998;54:798–804. doi: 10.1002/(SICI)1097-4547(19981215)54:6<798::AID-JNR7>3.0.CO;2-T. [DOI] [PubMed] [Google Scholar]
- Lakowicz JR, Malicka J, D'Auria S, Gryczynski I. Release of the self-quenching of fluorescence near silver metallic surfaces. Anal Biochem. 2003;320:13–20. doi: 10.1016/S0003-2697(03)00351-8. [DOI] [PMC free article] [PubMed] [Google Scholar]
- Lee KF, Li E, Huber LJ, Landis SC, Sharpe AH, Chao MV, Jaenisch R. Targeted mutation of the gene encoding the low affinity NGF receptor p75 leads to deficits in the peripheral sensory nervous system. Cell. 1992;69:737–749. doi: 10.1016/0092-8674(92)90286-l. [DOI] [PubMed] [Google Scholar]
- Lombardo JA, Stern EA, McLellan ME, Kajdasz ST, Hickey GA, Bacskai BJ, Hyman BT. Amyloid-β antibody treatment leads to rapid normalization of plaque-induced neuritic alterations. J Neurosci. 2003;23:10879–10883. doi: 10.1523/JNEUROSCI.23-34-10879.2003. [DOI] [PMC free article] [PubMed] [Google Scholar]
- Longo FM, Massa SM. Neuroprotective strategies in Alzheimer's disease. NeuroRx. 2004a;1:117–127. doi: 10.1602/neurorx.1.1.117. [DOI] [PMC free article] [PubMed] [Google Scholar]
- Longo FM, Massa SM. Neurotrophin-based strategies for neuroprotection. J Alzheimers Dis. 2004b;6:S13–17. doi: 10.3233/jad-2004-6s606. [DOI] [PubMed] [Google Scholar]
- Longo FM, Massa SM. Small molecule modulation of p75 neurotrophin receptor functions. CNS Neurol Disord Drug Targets. 2008;7:63–70. doi: 10.2174/187152708783885093. [DOI] [PubMed] [Google Scholar]
- Longo FM, Yang T, Knowles JK, Xie Y, Moore LA, Massa SM. Small molecule neurotrophin receptor ligands: novel strategies for targeting Alzheimer's disease mechanisms. Curr Alzheimer Res. 2007;4:503–506. doi: 10.2174/156720507783018316. [DOI] [PubMed] [Google Scholar]
- Maloney MT, Minamide LS, Kinley AW, Boyle JA, Bamburg JR. β-Secretase-cleaved amyloid precursor protein accumulates at actin inclusions induced in neurons by stress or amyloid beta: a feedforward mechanism for Alzheimer's disease. J Neurosci. 2005;25:11313–11321. doi: 10.1523/JNEUROSCI.3711-05.2005. [DOI] [PMC free article] [PubMed] [Google Scholar]
- McGowan E, Eriksen J, Hutton M. A decade of modeling Alzheimer's disease in transgenic mice. Trends Genet. 2006;22:281–289. doi: 10.1016/j.tig.2006.03.007. [DOI] [PubMed] [Google Scholar]
- Mi S, Lee X, Shao Z, Thill G, Ji B, Relton J, Levesque M, Allaire N, Perrin S, Sands B, Crowell T, Cate RL, McCoy JM, Pepinsky RB. LINGO-1 is a component of the Nogo-66 receptor/p75 signaling complex. Nat Neurosci. 2004;7:221–228. doi: 10.1038/nn1188. [DOI] [PubMed] [Google Scholar]
- Morishima Y, Gotoh Y, Zieg J, Barrett T, Takano H, Flavell R, Davis RJ, Shirasaki Y, Greenberg ME. β-Amyloid induces neuronal apoptosis via a mechanism that involves the c-Jun N-terminal kinase pathway and the induction of Fas ligand. J Neurosci. 2001;21:7551–7560. doi: 10.1523/JNEUROSCI.21-19-07551.2001. [DOI] [PMC free article] [PubMed] [Google Scholar]
- Mufson EJ, Kordower JH. Cortical neurons express nerve growth factor receptors in advanced age and Alzheimer disease. Proc Natl Acad Sci U S A. 1992;89:569–573. doi: 10.1073/pnas.89.2.569. [DOI] [PMC free article] [PubMed] [Google Scholar]
- Noda-Saita K, Terai K, Iwai A, Tsukamoto M, Shitaka Y, Kawabata S, Okada M, Yamaguchi T. Exclusive association and simultaneous appearance of congophilic plaques and AT8-positive dystrophic neurites in Tg2576 mice suggest a mechanism of senile plaque formation and progression of neuritic dystrophy in Alzheimer's disease. Acta Neuropathol. 2004;108:435–442. doi: 10.1007/s00401-004-0907-2. [DOI] [PubMed] [Google Scholar]
- Nykjaer A, Lee R, Teng KK, Jansen P, Madsen P, Nielsen MS, Jacobsen C, Kliemannel M, Schwarz E, Willnow TE, Hempstead BL, Petersen CM. Sortilin is essential for proNGF-induced neuronal cell death. Nature. 2004;427:843–848. doi: 10.1038/nature02319. [DOI] [PubMed] [Google Scholar]
- Perini G, Della-Bianca V, Politi V, Della Valle G, Dal-Pra I, Rossi F, Armato U. Role of p75 neurotrophin receptor in the neurotoxicity by beta-amyloid peptides and synergistic effect of inflammatory cytokines. J Exp Med. 2002;195:907–918. doi: 10.1084/jem.20011797. [DOI] [PMC free article] [PubMed] [Google Scholar]
- Rabizadeh S, Bitler CM, Butcher LL, Bredesen DE. Expression of the low-affinity nerve growth factor receptor enhances beta-amyloid peptide toxicity. Proc Natl Acad Sci U S A. 1994;91:10703–10706. doi: 10.1073/pnas.91.22.10703. [DOI] [PMC free article] [PubMed] [Google Scholar]
- Rockenstein E, Mallory M, Mante M, Sisk A, Masliaha E. Early formation of mature amyloid-beta protein deposits in a mutant APP transgenic model depends on levels of Abeta(1-42) J Neurosci Res. 2001;66:573–582. doi: 10.1002/jnr.1247. [DOI] [PubMed] [Google Scholar]
- Salehi A, Delcroix JD, Mobley WC. Traffic at the intersection of neurotrophic factor signaling and neurodegeneration. Trends Neurosci. 2003;26:73–80. doi: 10.1016/S0166-2236(02)00038-3. [DOI] [PubMed] [Google Scholar]
- Schenk D, Barbour R, Dunn W, Gordon G, Grajeda H, Guido T, Hu K, Huang J, Johnson-Wood K, Khan K, Kholodenko D, Lee M, Liao Z, Lieberburg I, Motter R, Mutter L, Soriano F, Shopp G, Vasquez N, Vandevert C, Walker S, Wogulis M, Yednock T, Games D, Seubert P. Immunization with amyloid-beta attenuates Alzheimer-disease-like pathology in the PDAPP mouse. Nature. 1999;400:173–177. doi: 10.1038/22124. [DOI] [PubMed] [Google Scholar]
- Smith MI, Deshmukh M. Endoplasmic reticulum stress-induced apoptosis requires bax for commitment and Apaf-1 for execution in primary neurons. Cell Death Differ. 2007;14:1011–1019. doi: 10.1038/sj.cdd.4402089. [DOI] [PubMed] [Google Scholar]
- Sotthibundhu A, Sykes AM, Fox B, Underwood CK, Thangnipon W, Coulson EJ. β-Amyloid1-42 induces neuronal death through the p75 neurotrophin receptor. J Neurosci. 2008;28:3941–3946. doi: 10.1523/JNEUROSCI.0350-08.2008. [DOI] [PMC free article] [PubMed] [Google Scholar]
- Stine WB, Jr, Dahlgren KN, Krafft GA, LaDu MJ. In vitro characterization of conditions for amyloid-beta peptide oligomerization and fibrillogenesis. J Biol Chem. 2003;278:11612–11622. doi: 10.1074/jbc.M210207200. [DOI] [PubMed] [Google Scholar]
- Stokin GB, Lillo C, Falzone TL, Brusch RG, Rockenstein E, Mount SL, Raman R, Davies P, Masliah E, Williams DS, Goldstein LS. Axonopathy and transport deficits early in the pathogenesis of Alzheimer's disease. Science. 2005;307:1282–1288. doi: 10.1126/science.1105681. [DOI] [PubMed] [Google Scholar]
- Susen K, Blöchl A. Low concentrations of aggregated beta-amyloid induce neurite formation via the neurotrophin receptor p75. J Mol Med. 2005;83:720–735. doi: 10.1007/s00109-005-0671-3. [DOI] [PubMed] [Google Scholar]
- Thakur A, Wang X, Siedlak SL, Perry G, Smith MA, Zhu X. c-Jun phosphorylation in Alzheimer disease. J Neurosci Res. 2007;85:1668–1673. doi: 10.1002/jnr.21298. [DOI] [PubMed] [Google Scholar]
- Tsai J, Grutzendler J, Duff K, Gan WB. Fibrillar amyloid deposition leads to local synaptic abnormalities and breakage of neuronal branches. Nat Neurosci. 2004;7:1181–1183. doi: 10.1038/nn1335. [DOI] [PubMed] [Google Scholar]
- Verdier Y, Penke B. Binding sites of amyloid beta-peptide in cell plasma membrane and implications for Alzheimer's disease. Curr Protein Pept Sci. 2004;5:19–31. doi: 10.2174/1389203043486937. [DOI] [PubMed] [Google Scholar]
- Vogel SS, Thaler C, Koushik SV. Fanciful FRET. Sci STKE. 2006 doi: 10.1126/stke.3312006re2. 2006:re2. [DOI] [PubMed] [Google Scholar]
- Wang KC, Kim JA, Sivasankaran R, Segal R, He Z. P75 interacts with the Nogo receptor as a co-receptor for Nogo, MAG and OMgp. Nature. 2002;420:74–78. doi: 10.1038/nature01176. [DOI] [PubMed] [Google Scholar]
- Whitby RJ, Dixon S, Maloney PR, Delerive P, Goodwin BJ, Parks DJ, Willson TM. Identification of small molecule agonists of the orphan nuclear receptors liver receptor homolog-1 and steroidogenic factor-1. J Med Chem. 2006;49:6652–6655. doi: 10.1021/jm060990k. [DOI] [PubMed] [Google Scholar]
- Whitehouse PJ, Price DL, Struble RG, Clark AW, Coyle JT, Delon MR. Alzheimer's disease and senile dementia: loss of neurons in the basal forebrain. Science. 1982;215:1237–1239. doi: 10.1126/science.7058341. [DOI] [PubMed] [Google Scholar]
- Wong TP, Debeir T, Duff K, Cuello AC. Reorganization of cholinergic terminals in the cerebral cortex and hippocampus in transgenic mice carrying mutated presenilin-1 and amyloid precursor protein transgenes. J Neurosci. 1999;19:2706–2716. doi: 10.1523/JNEUROSCI.19-07-02706.1999. [DOI] [PMC free article] [PubMed] [Google Scholar]
- Yaar M, Zhai S, Pilch PF, Doyle SM, Eisenhauer PB, Fine RE, Gilchrest BA. Binding of beta-amyloid to the p75 neurotrophin receptor induces apoptosis. A possible mechanism for Alzheimer's disease. J Clin Invest. 1997;100:2333–2340. doi: 10.1172/JCI119772. [DOI] [PMC free article] [PubMed] [Google Scholar]
- Yaar M, Zhai S, Fine RE, Eisenhauer PB, Arble BL, Stewart KB, Gilchrest BA. Amyloid beta binds trimers as well as monomers of the 75-kDa neurotrophin receptor and activates receptor signaling. J Biol Chem. 2002;277:7720–7725. doi: 10.1074/jbc.M110929200. [DOI] [PubMed] [Google Scholar]
- Yaar M, Zhai S, Panova I, Fine RE, Eisenhauer PB, Blusztajn JK, Lopez-Coviella I, Gilchrest BA. A cyclic peptide that binds p75(NTR) protects neurones from beta amyloid (1-40)-induced cell death. Neuropathol Appl Neurobiol. 2007;33:533–543. doi: 10.1111/j.1365-2990.2007.00844.x. [DOI] [PubMed] [Google Scholar]
- Yamamoto T, Chen HC, Guigard E, Kay CM, Ryan RO. Molecular studies of pH-dependent ligand interactions with the low-density lipoprotein receptor. Biochemistry. 2008;47:11647–11652. doi: 10.1021/bi801117t. [DOI] [PMC free article] [PubMed] [Google Scholar]
- Yang T, Knowles JK, Lu Q, Zhang H, Arancio O, Moore LA, Chang T, Wang Q, Andreasson K, Rajadas J, Fuller GG, Xie Y, Massa SM, Longo FM. Small molecule, non-peptide p75 ligands inhibit Aβ-induced neurodegeneration and synaptic impairment. PLoS ONE. 2008;3:e3604. doi: 10.1371/journal.pone.0003604. [DOI] [PMC free article] [PubMed] [Google Scholar]
- Yeo TT, Chua-Couzens J, Butcher LL, Bredesen DE, Cooper JD, Valletta JS, Mobley WC, Longo FM. Absence of p75NTR causes increased basal forebrain cholinergic neuron size, choline acetyltransferase activity, and target innervation. J Neurosci. 1997;17:7594–7605. doi: 10.1523/JNEUROSCI.17-20-07594.1997. [DOI] [PMC free article] [PubMed] [Google Scholar]