Abstract
Background
Forgotten or omitted insulin injections are an important contributing factor to poor glycemic control in people with type 1 diabetes. This study uses mathematical modeling and examines the impact on hemoglobin A1c (HbA1c) levels if insulin injections are forgotten. The simulation concerns people with type 1 diabetes on intensive insulin therapy.
Methods
Five sets of blood glucose profiles with and without a forgotten injection were obtained. The difference to HbA1c was calculated using an HbA1c estimator on the profiles and was multiplied by the frequency of forgotten events. A frequency of 2.1 forgotten injections per week was found in the literature.
Results
Calculations showed that forgetting 2.1 meal-related injections per week would lead to an increase in HbA1c of at least 0.3–0.4% points, and similarly 0.2–0.3% points related to forgotten injections of the long-acting insulin. In case of even more pronounced nonadherence (e.g., if 39% of all injections are forgotten) there is a possible increase of HbA1c of 1.8% points.
Conclusions
The magnitude of the possible improvement in HbA1c agrees well with other studies in the relation between adherence and HbA1c levels. The estimated numbers suggest that missing injections are an important reason for suboptimal treatment.
Keywords: adherence, compliance, HbA1c, self-treatment
Introduction
Results of the Diabetes Control and Complications Trial (DCCT) established the relationship between hemoglobin A1c (HbA1c) levels and risks for diabetic complications in people with type 1 diabetes.1 Other researchers found a significant correlation between adherence to insulin treatment and HbA1c for people with type 1,2,3 type 2,4 and a group of people with types 1 and 2 on insulin therapy.5,6 From these studies we cannot know how much the forgotten or omitted insulin injections contribute to HbA1c and how much come from other factors that may correlate with adherence, such as incorrect timing of injections and incorrect calculation of dose size, leading to a general high level of blood glucose. This article looks into the relationship between HbA1c levels and forgotten insulin injections by simulating the blood glucose profile with and without forgotten injections and calculating the difference in HbA1c.
Research Design, Material, and Methods
It is possible to calculate an estimate of the HbA1c from a blood glucose profile from a person with type 1 diabetes.7 This estimate may not be precise for individuals, but in average it holds, as the HbA1c estimator is based on the average of a large population of people with type 1 diabetes. In order to estimate how much forgotten injections matter to HbA1c, the procedure is to (1) obtain a blood glucose profile where an injection was forgotten and a profile where it was remembered, but where all other circumstances were equal, (2) calculate the difference to HbA1c using a HbA1c estimator, and (3) multiply by the frequency of forgotten events. The next three sections describe each step in detail.
Blood Glucose Profiles (Step 1)
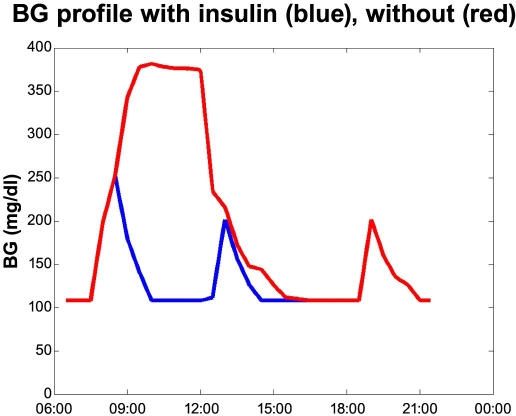
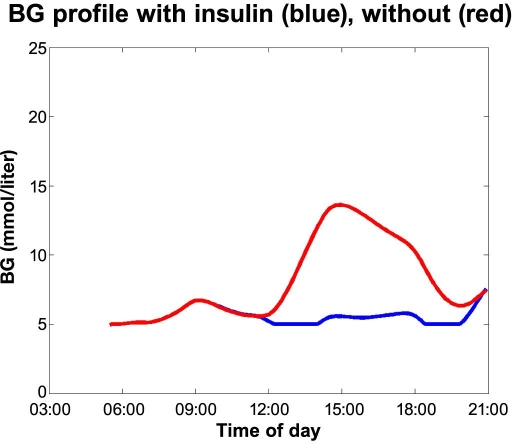
First we will look into the five sets of blood glucose profiles with and without a forgotten injection. The first case is displayed in Figure 1. The red curve shows the blood glucose where the breakfast bolus has been forgotten. The person (a male with type 1 diabetes using Velosulin® in a pump) discovers this around 11 a.m. and has fully corrected after lunch. The blue curve shows the scenario where the person remembers the insulin. The blood glucose profile is based on a number of measurements from several real events, as experienced by the person in the case. The maximum blood glucose of 396–414 mg/dl (22–23 mmol/liter) was verified.
Figure 1.
Forgetting breakfast bolus case.
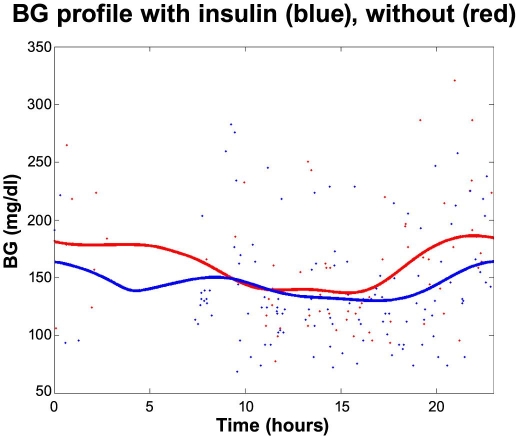
Figure 2 displays the second case: A male with type 1 diabetes who takes two injections of long-acting insulin (Insulatard®); the first at 1–2 a.m. at bedtime and the second at 1–2 p.m. He often forgets the long-acting insulin in the afternoon. He realizes this too late and tries to compensate by extra bolus injections during the evening and morning. The red dots in Figure 2 are finger stick measurements from 7 days where the long-acting insulin in the afternoon was not taken, and the blue dots are measurements from 12 days where the long-acting insulin was taken. In all other aspects the days were alike with no or little exercise. The red and blue curves are averages.
Figure 2.
Forgetting long-acting insulin in the early afternoon.
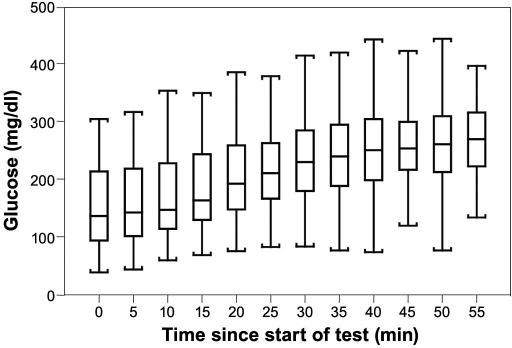
The Diabetes Research in Children Network (DirecNet) group has studied how well continuous glucose monitoring (CGM) (MiniMed and GlucoWatch) follows rapidly changing glucose levels.8 In the study, 82 people with type 1 diabetes were given a standard liquid simple carbohydrate meal (1.75 g/kg, maximum 75 grams), and venous blood glucose measurements were obtained from baseline and every 5 minutes for up to 60 minutes. Subjects using multiple daily injections delayed their bolus insulin injection, and pump users continued basal insulin delivery but delayed their bolus insulin until the meal test was completed. Blood glucose increased from a mean baseline of 148 ± 65 to 283 ± 78 mg/dl. The average of the profiles is also given (see Figure 3).
Figure 3.
Blood glucose distribution at each 5-minute interval during meal-induced hyperglycemia test in a DirecNet study where the bolus was intentionally delayed for 1 hour. Reprinted with permission from Weinzimer.8
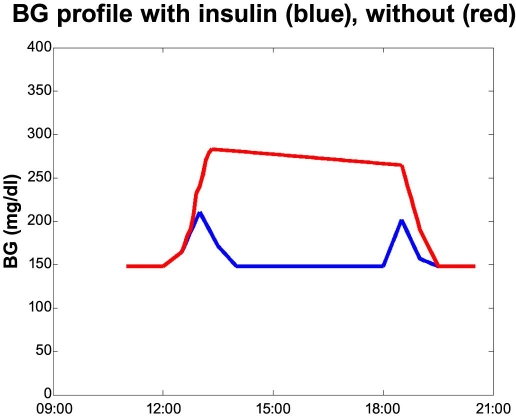
We consider the average of the measurements to constitute a realistic average profile—the red curve in Figure 4. There may not be any single individual that has a similar profile, but that has no effect on the result. We estimated the average effect to HbA1c on individual profiles, that is, average[HbA1c(profiles)], which mathematically is that same as HbA1c[average(profiles)], as the HbA1c-estimator function is a linear function.
Figure 4.
Omitting a meal bolus. The red curve is based on data from the DirecNet study.8
The sloping line after peak blood glucose has been reached is, among other things, because of renal elimination. The high blood glucose is assumed discovered and corrected around the next meal. Any over- or undershoot would cancel out in the averaging. This profile may underestimate the effect on the blood glucose level as the registered rise is low for a 1.75-g/kg carbohydrate challenge. It is likely that the rise was not complete when the measurement ended, as no final plateau appears in the graph in the DirecNet study (Figure 3).
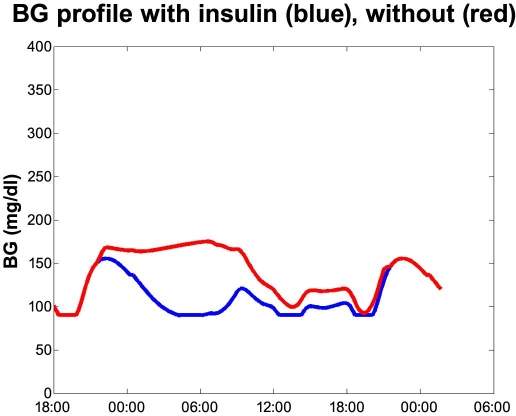
AIDA is a physiological simulator by Lehmann and Deutsch.9,10 It is intended for simulating the effects on the blood glucose profile from changes in insulin and diet for a typical person with type 1 diabetes.3 With a root mean square error of just 34 mg/dl (1.9 mmol/liter), the simulator is, to our knowledge, the most accurate model that is fully published. To obtain more profiles to work on we simulated two profiles within the function area of AIDA: A fit 90-kg male type 1 eating three meals—breakfast 6:30 a.m., 40 grams of carbohydrates; lunch 11:30 a.m., 50 grams; and supper at 6:00 p.m., 50 grams. He used Actrapid® for meal bolus: 6 units at 6:00 a.m., 10 units at 11:00 a.m., and 9 units at 5:00 p.m. The long-acting insulin used was UltraLente®: 4 units at 6:00 a.m. and 13 units at 9:30 p.m. Kidney function, renal function, insulin sensitivity, and peripheral were all set to normal. What happens if the person forgets his lunch insulin and discovers so at the next measurement—at the time of the supper bolus—and corrects by taking an additional 3 units (see Figure 5)?
Figure 5.
Forgetting lunch insulin. Simulated profiles from AIDA.
What happens if the person forgets his bedtime long-acting insulin and discovers so at the next blood glucose measurement—at the time of the breakfast bolus (see Figure 6)?
Figure 6.
Forgetting bedtime long-acting insulin. Simulated profiles from AIDA.
HbA1c Estimation (Step 2)
In the normal 120-day life span of the red blood cell, glucose molecules join hemoglobin, forming glycated hemoglobin. A buildup of glycated hemoglobin reflects the average level of glucose to which the cell has been exposed during its life cycle. The HbA1c is the percentage of glycated hemoglobin molecules. Therefore, the number is influenced more by recent events in the blood glucose level than an event around 120 days ago, from which almost no hemoglobin molecules are left. In the present study, the events can be assumed to happen uniformly in time, and therefore the effect of the decay of the hemoglobin molecules disappears when averaging over all events.
The algorithm for converting the estimated blood glucose to HbA1c is based on articles by Rohlfing et al.,7 Salardi et al.,11 Hillman et al.,12 and Kilpatrick et al.13 Rohlfing and colleagues7 found that
where BG is the mean finger stick blood glucose. This formula is based on data from seven-point blood glucose profiles from 1439 people in the DCCT data set covering 26,056 HbA1c values. Rohlfing's calculations are based on mean plasma glucose (MPG) converted from finger stick blood glucose by adding 11%. Our calculations are based on finger stick measurement, so the 11% has been left out in the aforementioned formula.
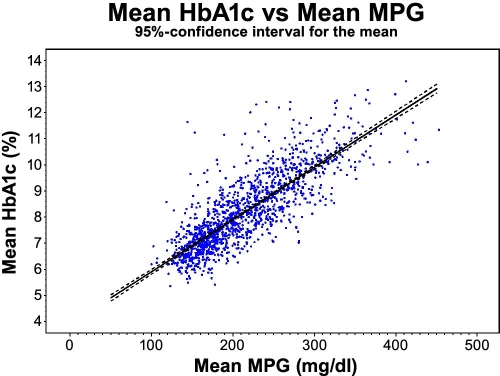
We have calculated the reverse (weighted) regression, i.e., prediction of mean HbA1c from mean MPG based on Rohlfing's method, and the same data show that the 95% confidence interval corresponds to ±3.53% for the slope of the regression line (see Figure 7). The confidence interval expresses the confidence level on the mean value. The relation may not be true for some people, but it holds for a hypothetical average person, as it is based on the average of a large population of people with type 1 diabetes.
Figure 7.
The relation between plasma glucose and HbA1c based on DCCT covering 26,056 HbA1c values with a 95% confidence interval for the mean for all patients. R2 = 0.68.
American Diabetes Association's Standards of Medical Care for Patients With Diabetes Mellitus14 cite Rohlfing's formula in table form labeled “Correlation between A1C level and mean plasma glucose levels”—we take this as a sign of the formula being generally accepted.
Kilpatrick et al.13 have shown that in the DCCT study, intensively treated patients had consistently lower blood glucose concentrations than conventionally treated patients at any given HbA1c value. The new calculation also showed that the slope of increase in HbA1c is higher for intensively treated patients. Kilpatrick found the following relation for intensively treated patients:
Again the calculation was based on mean plasma glucose converted from finger stick blood glucose by adding 11%, so again the 11% has been left out in the formula.
The difference between Rohlfing's and Kilpatrick's relations means that if we base our calculations on the relation for studying intensively treated patients only, rather than Rohlfing's relation that covers all patients, the result will be a higher ΔHbA1c. In the following we use both Rohlfing's and Kilpatrick's relations.
The connection between blood glucose and HbA1c value is likely not quite linear. Based on CGM profiles, Salardi and colleagues11 found that the only glucose threshold below which there seems to be no correlation with HbA1c is 90 mg/dl (5 mmol/liter). This is not relevant for our calculation, as we have no low blood glucose values. Because we do not have very high blood glucose values (>414 mg/dl, >23 mmol/liter), any nonlinearity in the high end is not relevant. Findings by Hillman et al.5 and Rohlfing et al.7 showed that if there is any dependency of time of day in the relation between blood glucose concentration and HbA1c, it is yet unclear. Based on this we have used Rohlfing's and Kilpatrick's conversion formula with no dependency of time of day.
Few have studied the effect of peaks on HbA1c. In 1980 Goldstein15 studied changes in HbA1c during glucose and saline incubation of erythrocytes (red blood cells). Teague and colleagues16 studied rats fed only once per day and found that even though the area under the blood glucose curve was less than the controls, the amount of glycated hemoglobin was larger. Both of these studies suggest that peaks increase the effect on HbA1c more than explained by the area under the blood glucose curve. If that is the case, the results in this article are underestimates.
Frequency of Forgetting Injections (Step 3)
Finally we need a number for how often people tend to forget injections. Burdick et al.2 examined correlations between HbA1c levels and the number of missed mealtime boluses per week for youths using insulin pumps. The pump users reported 1.3 missed mealtime boluses per week, while the mean number of physician-estimated missed mealtime boluses per week was 2.1 based on pump data downloads from the 4 weeks before the clinic visit. For pump users, 2.1 omissions per week correspond to remembering 90% if they use 3 boluses per day.
A study by Cramer and colleagues4 of 6222 adults on insulin therapy showed that the mean rate of insulin usage was 77.44 ± 17.1% (median 80.35%) of doses prescribed, including wastage, based on the number of units and doses prescribed. Taking wastage into account, Cramer et al.4 calculated the number to be 58–65% of insulin taken as prescribed.
A study of people with type 2 diabetes using insulin showed 63% of doses taken as prescribed.17
Given that the 2.1 omissions per week come from pump users with type 1, which we assume to be among the most adherent segment of people with diabetes, we take 2.1 as the better end on the scale of remembering and 61.5% (mean of Cramer's interval) of three daily short-acting injections and two long-acting injections as the other end of the scale.
Calculating ΔHbA1c
We now have all the information for the three steps mentioned in the procedure, and the calculation of the difference to HbA1c is now simple:
The duration is the amount of time covered by the two different profiles (with and without insulin). For example, Figure 1 covers 15 hours equal to 0.0893 weeks.
Results
Using the 2.1 omissions per week, we calculated an estimate of how much the omissions matter to HbA1c as just described.
Numbers in parentheses are the 95% confidence interval for the mean of the people with type 1 diabetes. As can be seen, the uncertainty on the HbA1c estimators is small compared to the difference between the estimators—the difference between Rohlfing's relation (for all patients) and Kilpatrick's relation (for intensively treated patients).
Lacking numbers for omissions of long-acting insulin, we used the 2.1 omissions per week as an estimate for the low end of the scale.
Cramer's4 numbers do not tell us what sort of injections (long or short acting) are omitted. If we assume that they are forgotten in approximately equal amounts: 38.5% (=100%-61.5%) of three daily short-acting injections and 38.5% of two long-acting injections as the high end of the scale, a contribution to HbA1c of 1.18% points comes from omitted boluses and 0.64% points from omitted basals (using Rohlfing's relation). The total impact on HbA1c is 1.8% points. We realize that this number may be an overestimate, as the 38.5% of insulin not taken may be because of other reasons than forgetting. For instance, some of the people may have more insulin prescribed than they need.
Discussion
Calculations show that forgetting 2.1 meal-related injections per week may cause an increase in HbA1c of 0.3–0.4% points depending on the shape of the blood glucose profile. Further, forgetting a long-acting insulin 2.1 times per week in our calculations caused an increase in HbA1c of 0.2–0.3% points. These numbers are based on Rohlfing's relation between HbA1c and blood glucose. With Kilpatrick's relation for intensively treated people with type 1 diabetes, calculations show an increase in HbA1c of 0.4–0.6% points for fast-acting insulin and an increase in HbA1c of 0.3–0.5% points for long-acting insulin.
These numbers agree well with other studies1,2,5 in the relation between adherence and HbA1c levels. Most notable is the study of pump users by Burdick et al.,2 who found significant correlations between HbA1c levels and the number of missed boluses. Two missed bolus injections per week are reported to increase HbA1c by 0.5%. The study concluded that missed mealtime insulin boluses seem to be the major cause of suboptimal glycemic control for youths receiving pump therapy. The most frequently reported reason for missing boluses was “forgetting” (67%).
A study on self-reported adherence by Anderson and colleagues5 of 170 insulin users (both type 1 and 2 diabetes) showed that 53% forgot to take injections, 33% skipped injections on purpose, and 40% skipped injections because they forgot insulin supplies. People who reported full compliance (34%) had significantly lower HbA1c values than people who admitted skipping injections (HbA1c = 7.93 versus 8.54, p < 0.05).
A study by Morris et al.3 of 89 adolescents with type 1 diabetes showed a significant inverse association between HbA1c and an adherence index. For each person, the adherence index is days of maximum possible insulin coverage per year calculated from the medically recommended insulin dose and cumulative volume of insulin dispensed from all community pharmacies. Possible waste was ignored. Furthermore, the adherence index was inversely related to hospital admissions for diabetic ketoacidosis.
There are several ways to further that doses are taken. In a study by Lee et al.18 it was demonstrated that converting from administration of insulin therapy by a vial/syringe to a prefilled modern insulin pen device (FlexPen®) improved medication adherence significantly. Furthermore, the number of hypoglycemic events was reduced significantly. The study covered 1156 people with type 2 diabetes. From the study by Lee and colleagues18 it appears that an improvement of convenience can improve adherence and that devices convenient to use are of importance to the treatment.
This calculation study concerned people with type 1 diabetes, as the blood glucose profiles used were from people with type 1. To apply the method to people with type 2 diabetes, blood glucose profiles from people and an HbA1c estimator for people with type 2 need to be obtained.
Conclusions
Simulations indicate that an increase in HbA1c of at least 0.3–0.4% points may be the consequence in the case where a rate of 2.1 missed bolus injections per week is forgotten; and likewise of at least 0.2–0.3% points for long-acting insulin injections. The numbers increased if a higher rate of missed injections was used in the calculation (e.g., a missed injection rate of 38.5% could lead to an increase in Hba1c of 1.8% points). These numbers are based on Rohlfing's relation between HbA1c and blood glucose. With Kilpatrick's relation for intensively treated people with type 1 diabetes, calculations show an increase in HbA1c of 0.4–0.6% points for fast-acting insulin and an increase in HbA1c of 0.3–0.5% points for long-acting insulin. The numbers indicate that missing injections could be an important reason for suboptimal treatment. The numbers agree well with the literature on the relation between therapy adherence and HbA1c levels. However, clinical studies focusing especially on this issue are needed to document these findings.
Acknowledgments
We thank Dr. Weinzimer for his kind permission to reprint. The 95% confidence analysis was done by Niels Væver Hartvig from Statistics, Novo Nordisk. Thanks to André Larsen, Jørgen Smedegaard, Jonas Kildegaard, and Morten Donsmark for discussion and reading drafts.
Abbreviations
- BG
blood glucose
- CGM
continuous glucose monitoring
- DCCT
Diabetes Control and Complications Trial
- DirecNet
Diabetes Research in Children Network
- HbA1c
hemoglobin A1c
- MPG
mean plasma glucose
References
- 1.DCCT Research Group. The effect of intensive treatment of diabetes on the development and progression of long-term complications in insulin-dependent diabetes mellitus. N Engl J Med. 1993;329:977–986. doi: 10.1056/NEJM199309303291401. [DOI] [PubMed] [Google Scholar]
- 2.Burdick J, Chase HP, Slover RH, Knievel K, Scrimgeour L, Maniatis AK, Klingensmith GJ. Missed insulin meal boluses and elevated hemoglobin A1c levels in children receiving insulin pump therapy. Pediatrics. 2004 Mar;113(3 Pt 1):e221–224. doi: 10.1542/peds.113.3.e221. [DOI] [PubMed] [Google Scholar]
- 3.Morris AD, Boyle DI, McMahon AD, Greene SA, MacDonald TM, Newton RW. Adherence to insulin treatment, glycaemic control, and ketoacidosis in insulin-dependent diabetes mellitus. The DARTS/MEMO Collaboration. Diabetes Audit and Research in Tayside Scotland. Medicines Monitoring Unit. Lancet. 1997;350(9090):1505–1510. doi: 10.1016/s0140-6736(97)06234-x. [DOI] [PubMed] [Google Scholar]
- 4.Cramer JA. A systematic review of adherence with medications for diabetes. Diabetes Care. 2004;27(5):1218–1224. doi: 10.2337/diacare.27.5.1218. [DOI] [PubMed] [Google Scholar]
- 5.Anderson RT, Marrero D, Skovlund SE, Cramer J, Schwartz S. Self-reported compliance with insulin injection therapy in subjects with type 1 and 2 diabetes. 18th Congress of the International Diabetes Federation; Diabetologia. 2003. p. A 275. [Google Scholar]
- 6.Cramer JA, Pugh MJ. The influence of insulin use on glycemic control: How well do adults follow prescriptions for insulin? Diabetes Care. 2005;28(1):78–83. doi: 10.2337/diacare.28.1.78. [DOI] [PubMed] [Google Scholar]
- 7.Rohlfing CL, Wiedmeyer HM, Little RR, England JD, Tennill A, Goldstein DE. Defining the relationship between plasma glucose and HbA(1c): analysis of glucose profiles and HbA(1c) in the Diabetes Control and Complications Trial. Diabetes Care. 2002;25(2):275–278. doi: 10.2337/diacare.25.2.275. [DOI] [PubMed] [Google Scholar]
- 8.Weinzimer S, Roy Beck R, Ruedy K, Booth A, Boland E, The Diabetes Research in Children Network (DirecNet) Study Group Mealtime glycemic excursions in pediatric subjects with type 1 diabetes mellitus (T1DM): the DirecNetexperience Pediatr Res. 2003;53(4 Pt 2):1A–669A. http://public.direc.net/slides/mealtestposter4-30-03final.ppt. [Google Scholar]
- 9.Lehmann ED, Deutsch T. Compartmental models for glycaemic prediction and decision-support in clinical diabetes care: promise and reality. Comput Methods Progr Biomed. 1998;56(2):193–204. doi: 10.1016/s0169-2607(98)00025-x. The AIDA simulator is available online: http://www.2aida.net/aida/index.shtml. [DOI] [PubMed] [Google Scholar]
- 10. AIDA online [cited 2007 Oct 31]. Available fromml: http://www.2aida.net.
- 11.Salardi S, Zucchini S, Santoni R, Ragni L, Gualandi S, Cicognani A, Cacciari E. The glucose area under the profiles obtained with continuous glucose monitoring system relationships with HbA(lc) in pediatric type 1 diabetic patients. Diabetes Care. 2002;25(10):1840–1844. doi: 10.2337/diacare.25.10.1840. [DOI] [PubMed] [Google Scholar]
- 12.Hillman N, Herranz L, Grande C, Vaquero PM, Pallardo LF. What is the relative contribution of blood glucose levels at different time points of the day to HbA1c in type 1 diabetes? Diabet Med. 2004;21(5):468–470. doi: 10.1111/j.1464-5491.2004.01184.x. [DOI] [PubMed] [Google Scholar]
- 13.Kilpatrick ES, Rigby AS, Atkin SL. Variability in the relationship between mean plasma glucose and HbA1c: implications for the assessment of glycemic control. Clin Chem. 2007 May;53(5):897–901. doi: 10.1373/clinchem.2006.079756. [DOI] [PubMed] [Google Scholar]
- 14.American Diabetes Association. Standards of medical care for patients with diabetes mellitus. Diabetes Care. 2007;30(1):S4. doi: 10.2337/diacare.17.6.616. [DOI] [PubMed] [Google Scholar]
- 15.Goldstein DE, Peth SB, England JD, Hess RL, Da Costa J. Effects of acute changes in blood glucose on HbA1c. Diabetes. 1980;29(8):623–628. doi: 10.2337/diab.29.8.623. [DOI] [PubMed] [Google Scholar]
- 16.Teague , et al. Influence of blood glucose profile upon glycated haemoglobin in meal fed Zucker rats. Diabet Med. 2005;22(Suppl 2):30. [Google Scholar]
- 17.Rajagopalan R, Joyce A, Ollendorf D, Murray FT. Medication compliance in type 2 diabetes subjects: retrospective data analysis. Value Health. 2003;6:328. [Google Scholar]
- 18.Lee WC, Balu S, Cobden D, Joshi AV, Pashos CL. Medication adherence and the associated health-economic impact among patients with type 2 diabetes mellitus converting to insulin pen therapy: an analysis of third-party managed care claims data. Clin Ther. 2006;28(10):1712–1725. doi: 10.1016/j.clinthera.2006.10.004. [DOI] [PubMed] [Google Scholar]


