

Abstract
Background
In the development of noninvasive glucose monitoring technology, it is highly desirable to derive a calibration that relies on neither person-dependent calibration information nor supplementary calibration points furnished by an existing invasive measurement technique (universal calibration).
Method
By appropriate experimental design and associated analytical methods, we establish the sufficiency of multiple factors required to permit such a calibration. Factors considered are the discrimination of the measurement technique, stabilization of the experimental apparatus, physics–physiology-based measurement techniques for normalization, the sufficiency of the size of the data set, and appropriate exit criteria to establish the predictive value of the algorithm.
Results
For noninvasive glucose measurements, using Raman spectroscopy, the sufficiency of the scale of data was demonstrated by adding new data into an existing calibration algorithm and requiring that (a) the prediction error should be preserved or improved without significant re-optimization, (b) the complexity of the model for optimum estimation not rise with the addition of subjects, and (c) the estimation for persons whose data were removed entirely from the training set should be no worse than the estimates on the remainder of the population. Using these criteria, we established guidelines empirically for the number of subjects (30) and skin sites (387) for a preliminary universal calibration. We obtained a median absolute relative difference for our entire data set of 30 mg/dl, with 92% of the data in the Clarke A and B ranges.
Conclusions
Because Raman spectroscopy has high discrimination for glucose, a data set of practical dimensions appears to be sufficient for universal calibration. Improvements based on reducing the variance of blood perfusion are expected to reduce the prediction errors substantially, and the inclusion of supplementary calibration points for the wearable device under development will be permissible and beneficial.
Keywords: calibration, glucose, noninvasive, Raman, universal
Background
Given the resources and time invested in the development of noninvasive glucose measurement technology, there is ample motivation to investigate whether the difficulties are generic and whether the obstacles are avoidable. Some of these difficulties arise from aspects of the problem that are qualitatively independent of the method of measurement employed but that can be either quantitatively mitigated or exacerbated depending on the mechanism of measurement that is invoked. Glucose is less than 0.1% of human tissue by weight. It follows that variations of skin properties will produce changes in signal much greater than the changes due to glucose variations. Because the glucose signal is much smaller than the total measured signal, changes imposed on the whole signal by extraneous sources have the potential of confounding the extraction of the glucose signal; consequently, variances due to thermal, mechanical, optical, or other instabilities must be identified and suppressed.
A more subtle consequence of the dominance of the signal by interfering substances is that the model required for prediction of the glucose will be complex, containing many independent variables. This can be understood by observing that the variance of each substance whose measurement signature has significant overlap with glucose must be extracted to predict glucose and that, given the relatively small glucose concentration, there may be many such substances. The quantity of reference glucose measurements to build the model must then be correspondingly large, or the model will over fit the data. The required size of the data set, however, cannot be determined a priori, because the complexity of the model is not ascertained until a preliminary calibration has already been generated. In addition, the size of the required data set must be estimated on the basis of how many uncorrelated data points are required, but it is known that the time series of varying glucose measurements are correlated over time frames of 30–60 min.1 Hence for a time series, the number of independent data may be much less than the number of measurements. For all these reasons, there has been no guideline for designing an appropriate experimental program, and the required scale of the data is easily underestimated.
Another problem, of great subtlety, is the establishment of appropriate exit criteria that prove that the algorithm developed will predict new data properly. For this purpose, it is necessary to have recourse to the process of cross validation, whereby some portion of the data (training set) is extracted from the data set to compute the calibration model, whereas the remaining data (test set) are predicted by applying the resultant calibration to the data of the test set. Those predictions are then compared with the known blood glucose reference values to establish the quality of the estimates. It is likely, however, that initially obtained cross-validated predictions will require improvement. The algorithm may then be modified using the criteria for validating changes that the cross-validated predictions improve. Unfortunately, the validity of the cross-validation may now be substantially impaired, because information about the reference glucose values of the test set has been explicitly used by the analyst to improve the algorithm. In the absence of a valid cross validation, there are no remaining means to establish the predictivity of the calibration. Suitable protocols are required to avoid this pitfall.
Another general consideration is that it is unlikely that the same quantity of glucose in two skin samples will present the same amount of signal to the apparatus; hence a fundamental problem of normalization arises. Further, it is known that the glucose measured in skin will come from a mix of blood and interstitial fluid (ISF). The proportions may be site dependent. The equilibrium glucose concentrations, in general, differ between the fluids, and for rapidly varying glucose, the difference in glucose concentrations will be time dependent. If the noninvasive measurement data are to be relied upon for an estimate of the normalization or of the time-dependent concentration of glucose in the two fluids, the required algorithm for glucose prediction is nonlinear. The complexity of nonlinear models can clearly be far higher than that of linear models. For example, if there are N independent variables in a linear model, there would be N(N-1)/2 independent variables in a general quadratic model based on these N variables. Added complexity could impose a need for correspondingly larger data sets to be predicted in order to avoid over fitting. It is therefore preferable to base models for normalization and delay between fluids on the physics and physiology of the system, such that minimal additional complexity is required of the model.
A key factor that determines relative complexity of models is the discrimination of the measurement method. To the extent that the form of the signature of an interfering substance is similar to that of the signature of glucose, terms that are proportional to the interfering substance will have significant weight in the model. If, on the other hand, the signature of glucose is completely orthogonal to that of every interfering substance, the model would devolve to a single term. Also, to the extent that glucose and signals from interferers are similar, we would expect that the portion of the glucose signal available for calibration as a proportion of the total signal will shrink. That is because the net analyte spectrum (NAS)2 (signature) of glucose will be the glucose spectrum (signature) with all the spectra (signatures) of the interferers projected out; therefore, methods producing highly distinctive glucose signatures are preferred.
Vibrational spectroscopies elicit well-defined, relatively unique, sharply articulated spectra, because the vibrational modes of the molecule are specific to the structure and composition of the molecule. In Raman spectroscopy, a photon having a frequency of the difference between the exciting frequency and the frequency of the symmetric vibrational mode is generated (Stokes wave). Therefore, although the fundamental vibrational frequencies are in the mid-infrared, it is possible to use sources and detectors that operate at optimum wavelengths in terms of availability and desirable optoelectronic properties. Other efforts to measure glucose noninvasively in human subjects by Raman spectroscopy have been undertaken at Syracuse University3 and the Massachusetts Institute of Technology.4 The work described here is distinguished from previous efforts, because it focuses on the experimental and analytic measures required to achieve a universal calibration. Such a calibration employs no a priori information on persons, nor any supplementary calibration points from an invasive measurement. It also excludes no data. In that context, universality does not imply that the calibration presented is completely comprehensive, adequately comprising all possible subjects. Rather we use the term “universal” in the sense that the population interrogated forms a self-consistent universe of subjects that is self-calibrating without over fitting. Finally, counter measures for the obstacles that were defined in the foregoing discussion are addressed explicitly.
Methods
Measurement
A block diagram of the Raman measurement apparatus is presented in Figure 1. Three optical sources are employed, which are accessed through an optical switch. A laser that excites the sample sequentially at 829 and 827 nm is used to obtain the primary Raman spectra of the skin. The input power is 220 mW delivered in a 1 mm diameter spot. Excitation at two different wavelengths enables a straightforward extraction of the fluorescence by subtraction, as the fluorescence spectrum is nominally invariant with small changes in excitation wavelength, whereas the Raman spectral features will shift.5 A skin spectrum and the spectrum of glucose in vitro are presented in Figure 2. It is apparent that the glucose spectrum has a very distinctive signature compared to the skin spectrum, the latter spectrum consisting almost entirely of interfering substances.
Figure 1.
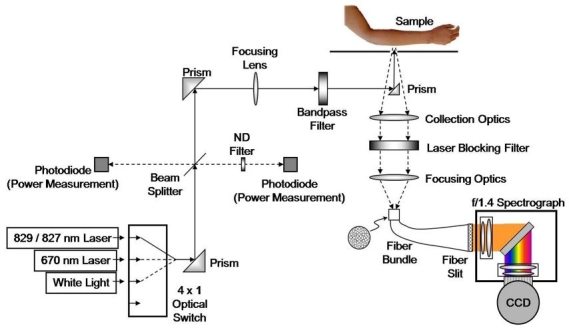
Raman spectroscopic apparatus for noninvasive glucose measurement. ND, neutral density; CCD, charge-coupled device.
Figure 2.
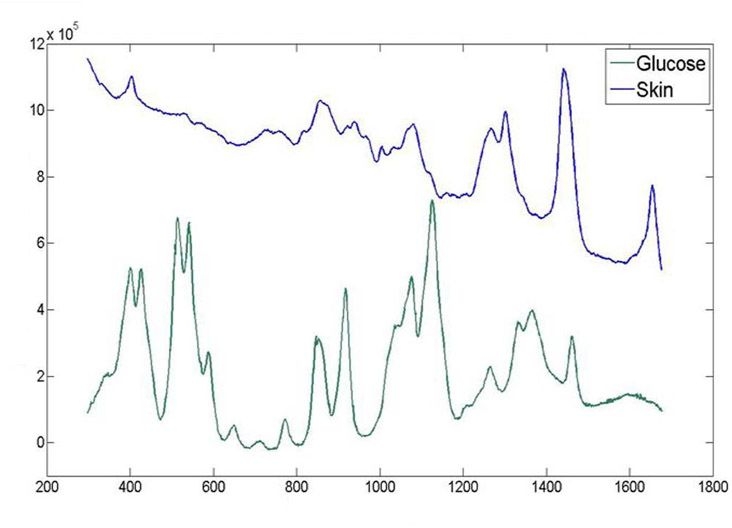
Typical skin spectrum from the volar forearm and glucose spectrum in vitro using an 827 nm excitation source.
A 670 nm laser source is employed to elicit the Raman spectrum of the OH stretching mode of water. The large Raman shift of this mode (3400 cm-1) necessitates shorter wavelength excitation for its spectrum to be within the band of our spectrometer. It is reasonable to suppose that an estimate of water can act as an appropriate normalization as the glucose is dissolved in water, and we would expect our measured glucose signal to scale with water.
We also employ a white light source for measuring diffuse reflectance from the sample. The putative purpose is to allow a possible extraction of the different optical transfer characteristics of the samples.6,7 Subsequent analysis, however, has shown that water is preferred to white light for normalization.
An essential aspect of a successful technique is thermal stabilization. The temperature rise associated with the 830 nm laser excitation is excessive if no additional heat sinking is supplied to the site.8 To remove the heat, we place the skin in contact with a magnesium fluoride window, which was chosen primarily for its lack of Raman activity. While this suffices to reduce the temperature rise to small levels, substances evolving from the skin will change the optical characteristics of the interface to the window over time. We introduce a fluid layer to inhibit this process. In Figures 3A and 3B, we present data from experiments with and without our stabilization methods. In both cases, a single site on the volar forearm was illuminated under conditions where no deliberate changes were induced. We monitored three quantities: the white light diffuse reflectance amplitude, the amount of water as calculated from the OH stretching mode, and the magnitude of the 1441 cm-1 line of the skin (CH2 scissoring mode). We see significant transients in all three measures for the case without stabilization, whereas with stabilization, the signals are nominally all constant.
Figure 3.
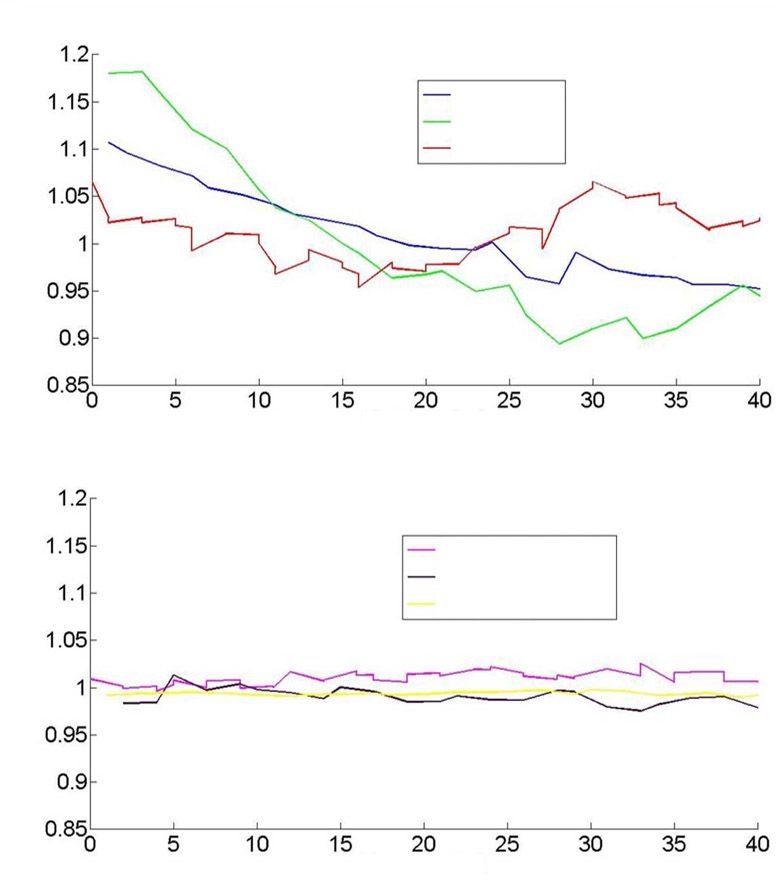
(A) White light diffuse reflectance, water, and integrated 1441 cm-1 line intensity as a function of time prior to stabilization. (B) As in (A), subsequent to stabilization.
We also make an estimate of blood volume in the site from Raman spectra. The spectrum of blood in vitro is presented in Figure 4. We found that the 757 cm-1 line of blood is in a spectral region with relatively little interference from major skin constituents, and that it is well correlated with other blood signatures in the 1600 cm-1 region. Accordingly, we use this line to estimate the blood volume, and the estimate is then used for normalization.
Figure 4.
Raman spectrum of fresh human blood with 827 nm excitation.
Analytical Methods
A spectral data set consists of a series of spectra that may be taken at different times, at different skin sites, and on different persons. The measured signal can be decomposed in the form of
| (1) |
where X(λ,t) is the spectral data, P are basis spectra, and T are basis time series. For example, P could be the spectra of substances and T their time-dependent concentrations. It is possible to make the regression
| (2) |
where y(t) is the reference blood glucose measurement, Ci are the regression coefficients, and C0 is a constant. The entropy, S, of such a model is a measure of its complexity and would be given approximately by
| (3) |
where N is the number of terms, and B is the number of bits of resolution with which the terms are known. Similarly, the entropy of the blood glucose reference values y(t) being predicted would be given by Equation (3), where N is now the number of independent data, and B is the number of bits of resolution with which the glucose was measured. To avoid over fitting, the entropy of the data must be much greater than the entropy of the model, which is a quantitative formulation of Occam's razor.
We can also formulate the NAS from
| (4) |
where, if Pi are an orthonormal set, we can now get from Equations (1) and (2)
| (5) |
To introduce the normalization, we make a three-compartment model as shown in Table 1.
Table 1.
Definition of Variables for Three Compartment Model
| Quantity | Blood | ISF | Intracellular |
|---|---|---|---|
| Ratio of glucose concentration in compartment to reference blood glucose concentration | A1 | A2 | A3 |
| Fraction of site volume attributed to each compartment | V1 | V2 | V3 |
| Fraction of glucose in compartment | A1V1 | A2V2 | A3V3 |
The quantity A1 may differ from unity on the basis that the blood in the volar forearm skin site may have a different glucose concentration from the blood obtained in the reference measurement.9 The quantity A3 is known to be small based on rapid metabolism of glucose by the cells.10 The blood volume will also be substantially less than the ISF volume or intracellular volume.11
The glucose measured spectroscopically, ys(t), can be related to the reference blood glucose by
| (6) |
Replacing y(t) with ys (t) in Equation (4) and using Equation (5) for the NAS, we get
| (7) |
The water signal we measure comes from all three compartments. If V3/(V1 + V2) is relatively fixed for the skin sites, we can write Equation (7) as
| (8) |
where Bl(t) and W(t) are our blood and water measurements, respectively, and kb,w are constants of proportionality and are, in practice, found to minimize the error of the glucose predictions. The quantity Bl(t) is proportional to V1 and, as V3 is proportional to V1 + V2, W(t) is proportional to V1 + V2. Note that the analysis is relatively insensitive to the earlier volume fraction assumption, as the net root mean square variance contributed by the normalization is approximately 10%.
In addition to normalization, a single-pole delay model is used to describe the time-varying difference between the glucose concentrations in the blood and the ISF. This model was found to be a suitable approximate solution to the differential equations presented in Table 1 of Reference 10. The exponential decay time constant is written in terms of a linear combination of T:
| (9) |
where D0 is a constant.
The target glucose values, y(t), for the regression in Equation (8) are modified on the basis of the delay model, and the coefficients Ci and Di are found simultaneously so as to minimize the error in predicting the modified y(t), the required regression now being nonlinear in T.
In order to make a prediction of blood glucose, the delay that is found in Equation (9) needs to be removed by inversion. A path integral formalism is employed to accomplish this, where the integral is carried out over a large sample of possible time trajectories for glucose concentrations, which meets realistic physiological constraints.
Results
Protocol
A summary of the protocol for a single trial on a single person is presented in Table 2.
Table 2.
Breakdown of Clinical Tests by Day for a Single Trial
| Snapshot prior to clamp | Clamp | Additional snapshot(s) | |
|---|---|---|---|
| Day 1 | 1 | 1 | 1 |
| Day 2 | N/A | N/A | 3 |
Clamp studies were strongly preferred over oral glucose tolerance tests, as it is possible to elicit a multiplicity of different time dependences. Our protocols guaranteed such variety, because the choice of an initial negative or positive excursion depended on the subject's initial glucose levels. We are thereby able to rule out a calibration based on an accidental correlation between an extraneous source of variance and a consistent glucose time profile, as can occur with oral glucose tolerance tests. The rate of change of glucose during clamps was as high as 10 mg/dl/min, which is beyond physiological limits. All the data, regardless of the rate of change, were included in the predictions we presented. The measurement categories are further specified in Table 3.
Table 3.
Detail of Snapshot and Clamp Testing
| Duration (min) | Site change | Frequency of reference blood glucose measurement | |
|---|---|---|---|
| Snapshots | 20 | Yes | 1 before, 1 after |
| Clamps | Up to 200 | Multiple site changes allowed | 1 per 5 min |
The spectral measurement sequence is specified in Table 4.
Table 4.
Sequence of Spectral Data Collection
| Duration (s) | Number of exposures in one sequence | Total exposures (s) | |
|---|---|---|---|
| 829 nm exposure | 10 | 2 | 20 |
| 827 nm exposure | 10 | 2 | 20 |
| 670 nm exposure | 1 | 1 | 1 |
| White light exposure | 0.1 | 1 | 0.1 |
The time between full sequences was 75 s.
Blood glucose reference measurements were all made using the YSI blood analyzer. During day 1, blood was obtained intravenously. On day 2, blood was extracted from the fingertip.
A description of the trial population is presented in Table 5.
Table 5.
Trial Subject Population
| Number of persons | Number of skin sites | Fitzpatrick skin types | Diabetes status | Number of trials per person (2 day protocol) | Total duration of study (years) |
|---|---|---|---|---|---|
| 30 | 387 | 1–6 | All type 1 | 1–3 | 1.15 |
For purposes of cross validation, the data were divided into subsets (test sets), each of which consisted of one trial for one person. When each test set was to be predicted, all the remaining data (training set) were used to calculate the calibration. This was done in a permuted fashion until all the data was predicted. Because all of a trial for a single person was removed from the training data, there were no data from the same day for that person in both the training and the test sets. This eliminated any possibility of time correlation between the glucose values in the two sets, which, if allowed, could yield an unduly optimistic prediction. Further, as ten of the persons had just one trial, none of those persons' data were in the training set when those persons' glucose was predicted. This helped establish whether the calibration was universal.
Glucose Predictions
The cross-validated predictions versus the reference glucose are presented in Figure 5 on the standard Clarke grid. The mean and median absolute relative differences are 38 and 30 mg/dl, respectively. The percentage of points in the A zone and in the A + B zones are 53% and 92%, respectively.
Figure 5.
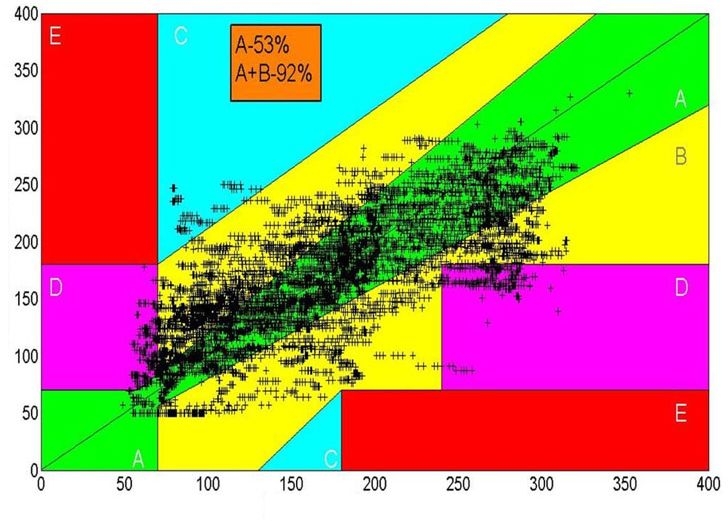
Clarke error grid for noninvasive glucose measurements. Data from 30 subjects, comprising 58 clamp studies, 272 snapshots, and a total of 387 different skin sites on the volar forearm.
In Figure 6, we present a typical time series to demonstrate the level of tracking achieved to date with glucose values that vary rapidly. The data represent several clamp studies on a single individual.
Figure 6.
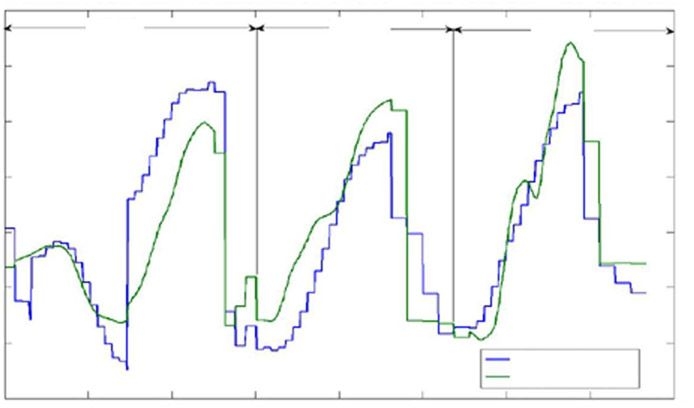
Tracking of glucose predictions from a single person. Note that data are not continuous in time and have been taken in more than one trial, however, the time axis does not reflect these discontinuities.
Discussion
To establish that the scale of the data is approaching sufficiency for universal calibration, we examined three criteria.
Did the addition of substantial additional data to an existing algorithm affect the quality of the predictions for the previous data? In practice, the uncertainty in the estimation of the error is not readily quantified. To satisfy this criterion, we require that the error not degrade by more than a small fraction of its original value, and in practice, the differences are of the order of or less than 3 mg/dl.
Did the complexity of the model for optimum predictions cease to increase with the addition of data?
Was the error of prediction for those persons with only one trial similar to the remainder of the population? Since those persons' data would be predicted from a calibration based on a training set containing none of their data, we may deduce that the calibration is universal if their data are as well predicted.
The additional data were defined as that of the last ten persons measured, each of whom had only one trial. The choice of the last data taken is not arbitrary, as for any other choice of data, it is possible that the existing algorithm had already been optimized to the extent that the data are over fit. We did not find any statistically significant change in the errors for the first 20 persons when the last 10 were added. The number of terms for optimum prediction actually fell with the added data, clearly indicating that the first 20 persons' data largely captured the relevant variances of the bigger population. The error of estimation of the last 10 persons was actually slightly less than that of the first 20 (the difference not being statistically significant), hence all three criteria that we have identified were satisfied, and the data set appears to be approaching the scale whereby it adequately comprises the variances within it. The use of supplementary calibration points, as is done with current invasive continuous monitors, can result in significant improvements in predictions, and for the wearable device that is currently under development, it will be permissible to include them. For this work, however, our purpose was to establish unambiguously that the data were approaching sufficient scale for universal calibration, and such a demonstration is inconsistent with employing supplementary calibration.
Calculations of the entropy of the data with respect to the entropy of the model indicate that the ratio of the entropies is approximately 20. In counting our data, we include the effects of time correlation. In Figure 7, we present the glucose profile for a typical clamp study, and we fit a polynomial of degree six to the measurements. Observing that the fit is very good, we conclude that each clamp has only approximately 7 independent data (the number of terms in the polynomial), whereas 50 data points were collected on the basis of 1 measurement every 5 min. We conclude that it is sufficient to have approximately 20 times more independent data than there are independent variables in the model and that the appropriate scale of the data is of the order of that in Table 5.
Figure 7.
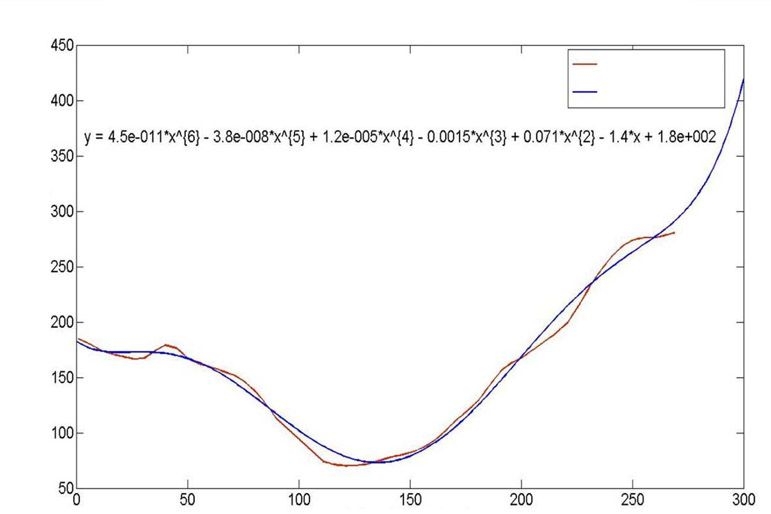
Glucose profile for a single clamp study and a single person. The profile is fit to a polynomial of degree 6, where time is the independent variable x, the equation for which is presented.
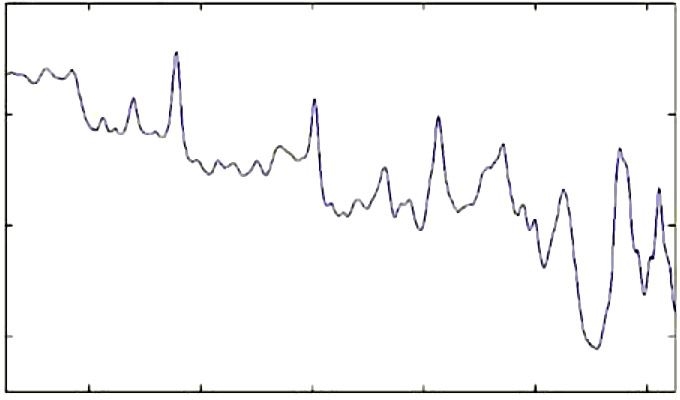
Having obtained a calibration, it is possible to demonstrate, a fortiori, that the method of measurement has high discrimination for glucose. In Figure 8, we present the NAS and the glucose spectrum. We do not expect these spectra to be identical, as the NAS is the glucose spectrum with all the interfering spectra projected out. The normalized overlap of the glucose and net analyte spectra indicates how much of the glucose signal is preserved and was calculated to be 0.48. Given the large number of interferers that are present at higher or similar concentration to glucose, this outcome is a robust indication of high discrimination.
Figure 8.
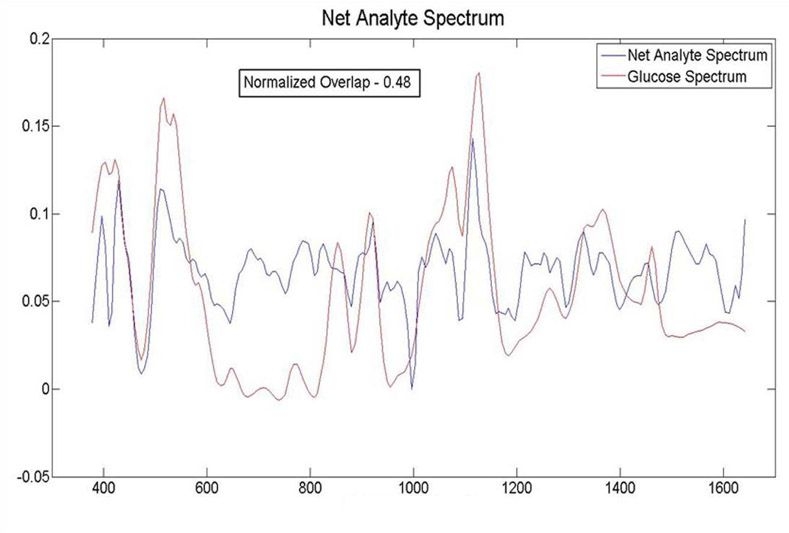
The NAS and the glucose spectrum. The normalized overlap of the two signals is 0.48, indicating good discrimination.
The primary source of random noise is the variance in the fluorescence, based on standard photon-counting statistics. It is possible to add noise to the data and estimate the contribution of the random noise from the increased error. That contribution is calculated to be 11 mg/dl, hence the net error in the current calibration has very little contribution from random noise. We infer, therefore, that the primary remaining error arises from the model not capturing some relevant variance. The nature of that variance can be inferred from examining Figure 6, where we see that our prediction tracks rapid glucose excursions with varying lags and that there can be an overall vertical offset that is site dependent. These observations suggest that this behavior arises from variations and deficiencies in blood perfusion in the various sites, as has been demonstrated for invasive techniques applied to the forearm.12 That conclusion is further supported by our observation of delays [Equation (9)] similar to those reported in Reference 12. Methods that strongly mitigate this effect are currently being implemented, and we believe this will suffice to complete an unambiguous demonstration of universal calibration to appropriate clinical standards.
Conclusions
On the basis of carefully chosen mathematical criteria, we believe that we have demonstrated that a universal calibration for noninvasive glucose measurement is possible using Raman spectroscopy. We find that a data set that is approximately 20 times larger than the number of terms used in the predictive model and that includes 30 persons with > 300 separate skin sites is roughly sufficient. It is difficult to ascertain the minimum required scale, because as the data are reduced, the self-sufficiency of the set depends on which data have been omitted. Very roughly, data on the scale approximately one half of that specified did not meet our current criteria, which may suggest a lower bound. It is also clear that additional data can still be helpful in better modeling outliers that appear to be associated with circulatory impairments.
The accuracy of the current measurement is approaching the level of clinical usefulness. We find that the remaining errors do not arise predominantly from random noise and that straightforward mitigation of the variances and deficiencies in blood perfusion offers good prospects for achieving substantial improvements. In addition, in future work on wearable devices, supplementary calibration points will be permissible, and that will complement the anticipated improved precision arising from blood perfusion variance mitigation.
Abbreviations
- ISF
interstitial fluid
- NAS
net analyte spectrum
References
- 1.Kovatchev BP, Clarke WL, Breton M, Brayman K, McCall A. Quantifying temporal glucose variability in diabetes via continuous glucose monitoring: mathematical methods and clinical application. Diabetes Technol Ther. 2005;7(6):849–862. doi: 10.1089/dia.2005.7.849. [DOI] [PubMed] [Google Scholar]
- 2.Olesberg JT, Liu L, Van Zee V, Arnold MA. In vivo near-infrared spectroscopy of rat skin tissue with varying blood glucose levels. Anal Chem. 2006;78(1):215–223. doi: 10.1021/ac051036i. [DOI] [PubMed] [Google Scholar]
- 3.Chaiken J, Finney W, Knudson PE, Weinstock RS, Khan M, Bussjager RJ, Hagrman D, Hagrman P, Zhao Y, Peterson CM, Peterson K. Effect of hemoglobin concentration variation on the accuracy and precision of glucose analysis using tissue modulated, noninvasive, in vivo Raman spectroscopy of human blood: a small clinical study. J Biomed Opt. 2005;10(3):031111. doi: 10.1117/1.1922147. [DOI] [PubMed] [Google Scholar]
- 4.Enejder AM, Scecina TG, Oh J, Hunter M, Shih WC, Sasic S, Horowitz GL, Feld MS. Raman spectroscopy for noninvasive glucose measurements. J Biomed Opt. 2005;10(3):031114. doi: 10.1117/1.1920212. [DOI] [PubMed] [Google Scholar]
- 5.Zhao J, Carrabba MM, Allen FS. Automated fluorescence rejection using shifted excitation Raman difference spectroscopy. Appl Spectrosc. 2002;56(7):834–845. [Google Scholar]
- 6.Shih WC, Bechtel KL, Feld MS. Intrinsic Raman spectroscopy for quantitative biological spectroscopy part I: theory and simulations. Opt Express. 2008;16(17):12726–12736. doi: 10.1364/oe.16.012726. [DOI] [PMC free article] [PubMed] [Google Scholar]
- 7.Bechtel KL, Shih WC, Feld MS. Intrinsic Raman spectroscopy for quantitative biological spectroscopy part II: experimental applications. Opt Express. 2008;16(17):12737–12745. doi: 10.1364/oe.16.012737. [DOI] [PMC free article] [PubMed] [Google Scholar]
- 8.Müller G, Roggan A, editors. Bellingham: SPIE Press; 1995. Laser-induced interstitial thermotherapy; p. 111. [Google Scholar]
- 9.Karon BS, Gandhi GY, Nuttall GA, Bryant SC, Schaff HV, McMahon MM, Santrach PJ. Accuracy of Roche Accu-Chek Inform whole blood capillary, arterial, and venous glucose values in patients receiving intensive intravenous insulin therapy after cardiac surgery. Am J Clin Pathol. 2007;127(6):919–926. doi: 10.1309/6RFQCKAAJGKWB8M4. [DOI] [PubMed] [Google Scholar]
- 10.Groenendaal W, Schmidt KA, von Basum G, van Riel NA, Hilbers PA. Modeling glucose and water dynamics in human skin. Diabetes Technol Ther. 2008;10(4):283–293. doi: 10.1089/dia.2007.0290. [DOI] [PubMed] [Google Scholar]
- 11.Braverman IM. The cutaneous microcirculation. J Investig Dermatol Symp Proc. 2000;5(1):3–9. doi: 10.1046/j.1087-0024.2000.00010.x. [DOI] [PubMed] [Google Scholar]
- 12.Stout PJ, Racchini JR, Hilgers ME. A novel approach to mitigating the physiological lag between blood and interstitial fluid glucose measurements. Diabetes Technol Ther. 2004;6(5):635–644. doi: 10.1089/dia.2004.6.635. [DOI] [PubMed] [Google Scholar]