

Abstract
Recent advances in genotyping technology make it possible to utilize large-scale association analysis for disease-gene mapping. Powerful and robust family-based association methods are crucial for successful gene mapping. We propose a family-based association method, the generalized disequilibrium test (GDT), in which the genotype differences of all discordant relative pairs are utilized in assessing association within a family. The improvement of the GDT over existing methods is threefold: (1) information beyond first-degree relatives is incorporated efficiently, yielding substantial gains in power in comparison to existing tests; (2) the GDT statistic is implemented via a robust technique that does not rely on large sample theory, resulting in further power gains, especially at high levels of significance; and (3) covariates and weights based on family size are incorporated. Advantages of the GDT over existing methods are demonstrated by extensive computer simulations and by application to recently published large-scale genome-wide linkage data from the Type 1 Diabetes Genetics Consortium (T1DGC). In our simulations, the GDT consistently outperforms other tests for a common disease and frequently outperforms other tests for a rare disease; the power improvement is > 13% in 6 out of 8 extended pedigree scenarios. All of the six strongest associations identified by the GDT have been reported by other studies, whereas only three or four of these associations can be identified by existing methods. For the T1D association at gene UBASH3A, the GDT resulted in a genome-wide significance (p = 4.3 × 10⁻⁶), much stronger than the published significance (p = 10−4).
Introduction
Recent advances in genotyping technology make it possible to utilize large-scale association analysis for disease-gene mapping. In comparison to commonly used case-control genome-wide association (GWA) studies, the genome-wide family-based design is also attractive for its convenience in making use of existing family-based phenotype data that were previously collected for linkage scans or other purposes. When family information is properly incorporated in analysis of family-based association data, the resulting inference is robust to population stratification.1,2
Powerful and robust family-based association methods are crucial for successful gene mapping. One of the influential association methods is the transmission/disequilibrium test (TDT).3 This method examines the allele transmission disparity from heterozygote parents to their affected offspring. Excess transmission of an allele suggests association between that allele and the disease. The TDT was originally proposed as a test of linkage in the presence of association. It was later viewed as the standard of association tests4 in which the null hypothesis is “no linkage and no association.” Properties of the TDT and its extensions have been studied previously.2,5,6
The TDT has been extended to accommodate various family-ascertainment schemes in nuclear families. One extension is the inclusion of missing parental data. Because the TDT can suffer from inflated type I errors under direct use of one-parent family data7 or a naive imputation of missing parental data,8 only families with complete parental data can be included in the TDT analysis. The 1-TDT9 was proposed to address one-parent family data. The S-TDT10 and equivalent tests11,12 were developed for no-parent sibship data, and the power in this scenario can be further improved by imputing missing parental data.13,14 Another extension to the TDT is the incorporation of general nuclear family data, for which there are two widely used methods: the pedigree disequilibrium test (PDT)15,16 and the family-based association test (FBAT).14,17–19 The PDT combines parent-child transmission-disequilibrium information with discordant sibling pair association information, whereas the FBAT presents a general class of family-based association tests. Special features such as haplotype analysis20 have also been developed in the context of the TDT. Simulation studies were performed for comparing the performance of various family-based association tests in nuclear families, and none of the methods was found to be uniformly the most powerful.2
In contrast to TDT extensions that test association within a family, some recent method developments involve examining both within- and between-family associations. The MQLS (“more-powerful” or “modified” quasi-likelihood score) method21 considers linear regression of genotypes on affection status while taking into account genotype correlations among family members through kinship coefficients. This method outperforms the standard generalized estimating equations (GEE) model22 with an independent working covariance matrix when the population prevalence of a disease is used in the mean model of the MQLS. Here, we focus mainly on family-based association tests that examine within-family association.
Although many association methods for dichotomous traits have been applied to large, well-powered, family-based studies, none of the existing methods has taken advantage of pedigree structural information, as with quantitative trait association methods.23 Extended pedigrees are typically treated as multiple nuclear families and, consequently, information is not utilized fully. Another weakness of some previously proposed test statistics is the dependence on large-sample approximations due to the robust estimator built into the test statistic. In such cases, p values can be quite unreliable if they are much smaller than 0.05.24
In this report, we propose the generalized disequilibrium test (GDT) for generalization of TDT-like family-based association methods. This method assesses the genotype difference of all discordant relative pairs in a family and makes use of information beyond first-degree relative pairs. In doing so, we extend the transmission-based TDT statistic used for examination of parent-offspring pairs to a comparison-based statistic more broadly applicable to different types of relative pairs. Covariates and missing parental information are incorporated. Unlike many other test statistics that rely on large samples for their asymptotic distributions, a robust technique involving the kinship coefficients has been implemented in the GDT, so the test remains valid even with a relatively small number of families of unequal size. We examine the performance of our method by comparing it with several other association tests through extensive computer simulations. We also apply our method to a recently published genome-wide linkage scan data set25 consisting of 5212 genotyped cases with type 1 diabetes (T1D [MIM 222100]) and 4998 genotyped nondiabetic relatives in 2496 families.
Material and Methods
Suppose we have a set of general pedigrees. Each individual j in family i has a binary trait, covariates in vectors Zij, and genotypes at a series of loci. For a locus with two alleles, A and a, we define a genotype score Xij, for the jth individual in the ith family, by the number of A alleles. When there are more than two alleles, the allele under test is labeled as A and other alleles are labeled as a. Without loss of generality, we assume that in the ith family with Ni genotyped individuals in total, the first genotyped individuals are affected and the other genotyped individuals are unaffected. We consider the following score for the ith family:
| (Equation 1) |
in which Cijk is 1/Ni if no covariates are modeled and
| (Equation 2) |
when covariates are available. Parameters in vector α are log odds ratios for association between the covariates and the trait, and they can be estimated from a standard logistic regression model with only phenotypes and covariates. The specific form (Equation 2) for covariate modeling is derived from the quasi-likelihood22 for a conditional logistic regression model.26 Appendix A shows that, without covariates, the score (Equation 1) can be derived from a conditional logistic regression model.
The test statistic of GDT has the following form:
| (Equation 3) |
The statistic (Equation 3) follows a standard normal distribution approximately under the null hypothesis of no association.
The score (Equation 1) is essentially a summation of genotype differences between all phenotypically discordant relative pairs. Under the null hypothesis of no association between allele A and the trait, the affected and unaffected individuals should have the same genotype score expectations; i.e., E[Xij-Xik] = 0 in Equation 1. If no covariates are modeled, or covariates are modeled independent of the genetic effect, the score (Equation 1) is expected to be zero under the null hypothesis.
The GDT can be viewed as a generalization of the TDT, 1-TDT, and PDT. We can see this relationship by comparing their scores (i.e., numerator of the test statistic), because all four tests are score tests. The score of the TDT,27 or the difference of the total number of alleles transmitted versus not transmitted from heterozygote parents to affected offspring, can be rewritten as , in which and are the genotype scores for the jth affected offspring and the kth parent, respectively, in the ith family. This TDT score is a summation of genotype differences between all discordant relative pairs in nuclear families in which both parents are unaffected and all offspring are affected, which is exactly the definition of the GDT score in the absence of a covariate term (Equation 2). The 1-TDT examines all heterozygote parent-homozygote offspring pairs and homozygote parent-heterozygote offspring pairs, the same as that which the GDT does in nuclear families in which available parents are unaffected and all offspring are affected. The PDT combines the TDT score with the discordant sibling pair score, which is essentially examining all discordant relative pairs in nuclear families in which parents are unaffected.
One standard way to estimate the variance of the score is to use an empirical moment estimator:
| (Equation 4) |
This variance estimator is a consistent estimator under the null hypothesis of no association, and has been used in a number of association tests.9,15,16 Although straightforward, the accuracy of the estimator depends on a large number of families of comparable sizes and similarly distributed affection status.
Here, we present a more precise way to estimate the score variance without relying on the use of large-sample theory. Under the null hypothesis of no association, each genotype score in a family has the same mean and variance, regardless of the affection status. Suppose μi is the mean of genotype scores in the ith family and is the variance of Xij - μi, or the within-family variance. Let denote the proportion of alleles shared identically by descent (IBD) and the kinship coefficient between the jth and kth individual of the ith family. The π values can usually be estimated from a multipoint IBD computation28 in genome scans with a dense SNP panel. In Appendix B, we show the within-family genotype covariance is equal to or , depending on whether the IBD information is known. This leads to and to
This suggests that within-family variance can be estimated by a moment estimator,
| (Equation 5) |
and that the variance of the score (Equation 1) is
| (Equation 6) |
Because in many cases it is not trivial to compute the IBD sharing because of the large number of markers and/or the large size of pedigrees, such as in a GWA scan, we consider the use of the kinship coefficients as the default option in the GDT method. The GDT statistic can be written as
| (Equation 7) |
The GDT statistic (Equation 7) applies to both noninbred and inbred families and to both autosomal and X-linked genes (with the use of X chromosome-specific kinship coefficients29,30).
In the presence of strong linkage, the IBD sharing is expected to be larger than twice the kinship coefficient among affected relative pairs and unaffected relative pairs, and smaller among discordant relative pairs. Therefore, the variance (Equation 6) with the kinship coefficients used as a default is expected to be smaller than the variance with IBD estimates modeled, and thus linkage contributes to the inflation of the test statistic. For a GWA scan, this potential inflation due to strong linkage is beneficial for gene mapping. For candidate gene or fine mapping studies in which strong linkage exists and estimating IBD is more feasible, the GDT with IBD estimates modeled should be used.
The GDT test statistic is robust in the sense that its statistical distribution under the null hypothesis does not depend on the genetic model of the disease. In a conditional logistic regression model from which the GDT statistic is derived, no polygenic effect is assumed. The GDT method remains valid in the presence of polygenes because the variance of the score in Equation 3 under the null hypothesis involves only genotype data at a single locus. Because the variance of the score is computed within families, the GDT method is also robust to confounding factors that exist between families, such as population stratification.
Simulation
We evaluate the performance of our method in a variety of simulated scenarios. We consider two types of pedigrees: nuclear families and cousin families. Each nuclear family consists of four siblings and one or two parents. Each cousin family has three generations, with two children in each of the three nuclear families. In total, we consider 12 scenarios with different combinations of affection status, missing data pattern, and pedigree types, as shown in Figure 1. We consider a common disease with a prevalence of 0.3 and a rare disease with a prevalence of 0.01. The disease allele frequency is set at 0.3. A multiplicative genetic model with genotypic relative risk of 1.5 is assumed, which corresponds to penetrances 0.51, 0.34, and 0.227 for the common disease and penetrances 0.017, 0.0113, and 0.0076 for the rare disease.
Figure 1.
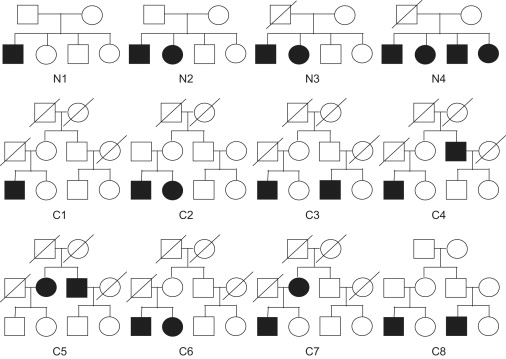
Pedigrees Used in 12 Simulation Scenarios
We investigate six family-based association methods: the GDT, FBAT (using the default setting14,17), PDT, GDT-PO (a variation of GDT that considers only discordant parent-offspring pairs), 1-TDT, and TDT. We investigate performance of the FBAT with the offset18 and empirical variance options19 in analysis of the T1DGC data. (We considered the pedigree-based association test (PBAT)31 method, but we do not include it in our extensive simulations. Although this method was identical to the FBAT method in nuclear families, it was consistently less powerful than the FBAT in extended pedigrees. Comparisons of these two software implementations are shown in Supplemental Data, available online.) All methods are applied to the same simulated data sets, composed of either 200 nuclear families or 100 cousin pedigrees (each simulated 10,000 times). We developed an algorithm to simulate genotypes of ascertained pedigrees efficiently conditional on a particular set of known phenotypic values, such as those shown in Figure 1. We first simulated all founders' genotypes at the disease SNP according to conditional probabilities given all levels of affection status. We then simulated inheritance vectors at the disease SNP according to conditional probabilities given all levels of affection status and founders' genotypes. Finally, we simulated two marker SNPs for all individuals: one SNP that was completely linked but in linkage equilibrium to the disease and a second SNP that was not linked. Both SNPs have an allele frequency of 0.5. The simulation algorithm has been newly implemented in our computer program, Linkage Explorer.32 More rigorous details are shown in Appendix C.
In order to examine behaviors of GDT in the presence of population stratification across families or population admixture within families, we performed 10,000 simulation replicates of 200 nuclear families with four offspring, each of which has at least one affected offspring. We compare the validity of the GDT with the MQLS, which was not designed to be robust to population heterogeneity. Disease penetrances of 0.2, 0.3, and 0.45 are due to a disease SNP that is independent of a marker SNP. To examine the effect of population stratification across families, we simulated 100 families with an MAF = 0.1 for both disease and marker SNPs and another 100 families with an MAF = 0.5 for both SNPs. To examine the effect of population admixture within families, for each of the 200 simulated families, one parent has an MAF = 0.1 for both SNPs and the other parent has an MAF = 0.5 for both SNPs. This simulation was implemented in the R package.
T1DGC Data
We applied our methods to a recently published T1D data set from the Type 1 Diabetes Genetic Consortium (T1DGC).25 A total of 10,394 individuals from 2496 families were genotyped by the Center for the Inheritance of Disease Research (CIDR) with their Illumina 6K linkage panel (∼6K SNPs). The affected sibling pair (ASP) families consisted of 5212 affected and 4998 unaffected subjects. The samples, all of European descent, were recruited from nine geographic regions. A template informed consent was provided for adaptation in each country. The ethics committees of each study site approved the study protocol, and all participants or their surrogates gave written informed consent and assent.
Concannon et al.33 identified a previously unreported association with T1D in the UBASH3A gene (MIM 605736); this finding was replicated in two other case-control populations. Although this study was designed for ASP linkage analysis, these data also provided 3737 discordant sibling pairs, 9391 discordant parent-offspring pairs, and hundreds of other discordant relative pairs. Among the 2657 ASPs in total, both parents were available for 69.6% of the ASPs, 18.9% of the ASPs had only a single parent, and 11.6% had neither parent available.
We applied the GDT, GDT-PO, FBAT (two implementations: default14,17 and with the use of an offset18), PDT (both PDT-SUM16 and PDT-AVG15), 1-TDT,9 and TDT to 5638 SNPs on the 22 autosomes. Although the tests PDT-SUM and PDT-AVG are identical in our simulated data sets in which all families are of the same structure, these two tests differ in the T1DGC data as a result of the distinct weights assigned to each of the families, as denoted by C in the score (Equation 1). C is 1 in the PDT-SUM and the inverse of the total number of trios and discordant sibling pairs in the PDT-AVG. We calculated the estimated genomic control (GC)34 for each scan in order to assess the inflation of type I errors for each of the methods.
Results
Simulation Studies
Figure 2 shows type I error rates for five association tests at significance levels 0.01 and 0.001, under the null hypothesis of no linkage and no association. Note that the standard errors for estimates of type I error rates in 10,000 simulations are 0.001 and 0.00032, respectively. At the 0.01 significance level in all 12 simulation scenarios, the GDT has type I error rates ≤ 0.011 and all other tests have type I error rates ≤ 0.0123. At a significance level of 0.001, the GDT, FBAT, and PDT have type I error rates ≤ 0.0011, whereas the GDT-PO and 1-TDT each have one out of 12 type I error rates larger than 0.0013 (the inflation is still less than two standard errors). These results show that all tests have proper type I error rates. Figure S1 shows that all tests also have proper type I error rates under the null hypothesis of no association in the presence of linkage.
Figure 2.
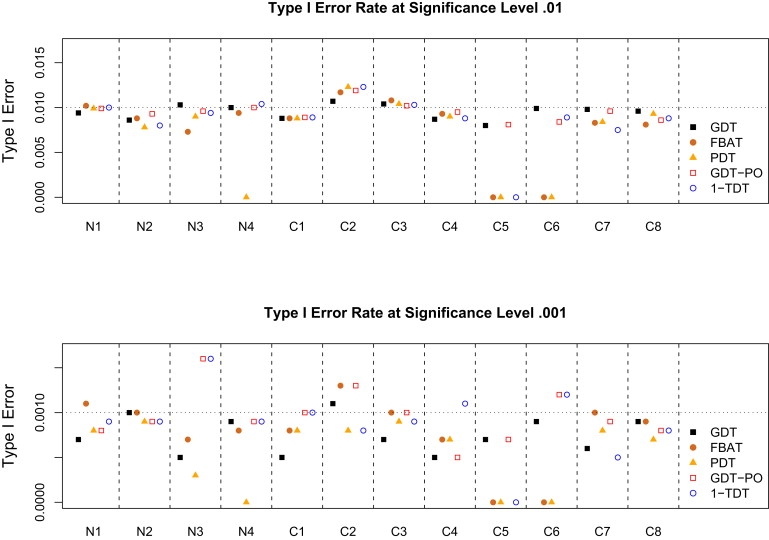
Type I Error Rates for Five Association Tests
The prevalence of the disease is set at 0.3. The SNP under test is not linked to the disease. Either 200 nuclear families or 100 cousin families were simulated 10,000 times.
Figure 3 and Figure 4 show the power comparison of five association tests for a common disease with a prevalence of 0.3 and a rare disease with a prevalence of 0.01. In our simulations, the power of the TDT is the same as that of the FBAT when parents or founders are available in scenarios N1, N2, C2, and C8 and is 0 otherwise, so the TDT results are not included in the figure. In all simulation scenarios, we observed the following for both a common and a rare disease:
-
(1)
The GDT has the highest power, except in scenarios N1, N2, and C8 (with complete parental data), in which either the GDT or the GDT-PO has the highest power; the GDT is > 13% more powerful than non-GDT methods in scenarios C2, C4, C5, C6, and C7.
-
(2)
The GDT consistently outperforms the PDT: although the GDT and the PDT differ only in the variance estimator (i.e., denominator of the statistic) in scenario N2, the GDT outperforms the PDT by > 3.1% at a level of 0.001 and < 1.4% at a level of 0.01.
-
(3)
The GDT-PO is consistently as or more powerful than the 1-TDT and TDT: although the GDT-PO and 1-the TDT differ only in the variance estimator in all scenarios except C4, C5, and C7, the power improvement of the GDT-PO over the 1-TDT can be > 5.7% at a level of 0.001 and < 4% at a level of 0.01 in scenario C2.
-
(4)
When both parents are available (scenarios N1, N2, C2, and C8), the FBAT has a power very similar to that of the GDT-PO and the TDT; the 1-TDT is slightly less powerful than the three other tests.
-
(5)
The FBAT's performance is similar to that of the PDT for six scenarios; in all such cases, there are two siblings per sibship with one parent missing.
-
(6)
In contrast to the GDT, the FBAT and the PDT do not apply to some simulation scenarios, including C5 and C6, in which affected sibling pair families have incomplete parental data; the GDT handles one-parent families better than the FBAT and the PDT.
Figure 3.
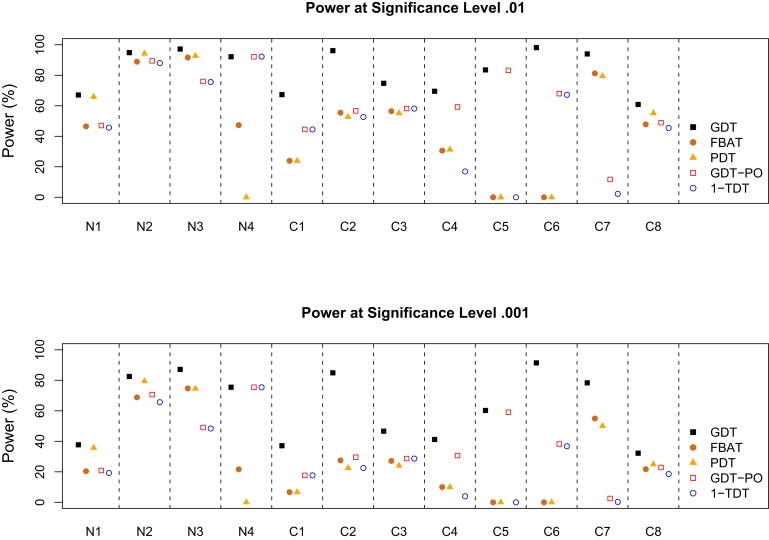
Power to Map a Common Disease with a Prevalence of 0.3
The power of the TDT is the same as that of the FBAT under scenarios N1, N2, C2, and C8 and is 0 otherwise.
Figure 4.
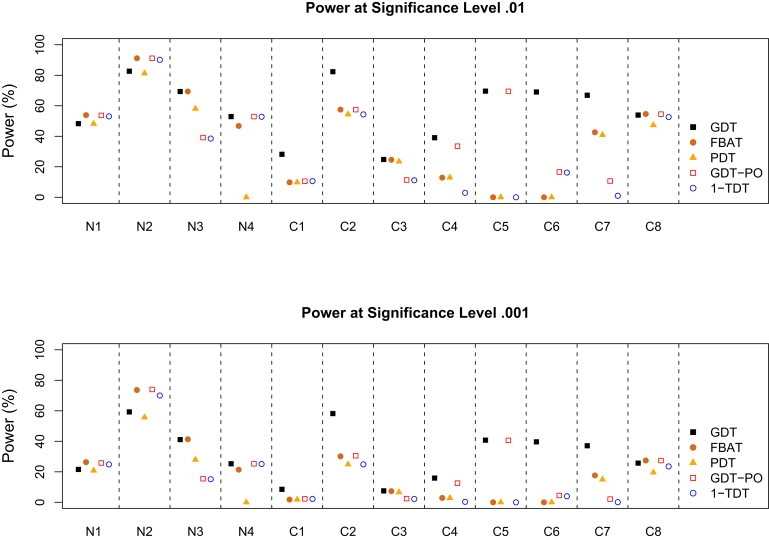
Power to Map a Rare Disease with a Prevalence of 0.01
The power of the TDT is up to 0.3% lower than that of the FBAT under scenarios N1, N2, C2, and C8 and is 0 otherwise.
For a common disease, the GDT performs uniformly best among all six tests; in addition to the five scenarios in which the GDT consistently outperforms non-GDT methods (by > 13% in simulations), the GDT is also > 19% more powerful than non-GDT methods in scenarios C1 and C3 and is > 45% more powerful than the FBAT and the PDT in scenario N4. For a rare disease, the GDT still frequently outperforms other tests, except in nuclear families with complete parental data, in which the TDT and its equivalent tests, such as the FBAT and the GDT-PO, are slightly more powerful.
Our simulations show that the GDT statistic is robust to population stratification across families but is somewhat inflated in the presence of population admixture within families. In the presence of population stratification, the type I error rates of the GDT are maintained at 5.0% and 0.9%, respectively, for significance levels of 0.05 and 0.01, whereas the type I error rates of the MQLS method are 18.1% and 6.6%, respectively. In the presence of population admixture, the type I error rates of the GDT are 8.9% and 2.1%, respectively at significance levels of 0.05 and 0.01, which are comparable to the type I error rates of 7.2% and 1.8% for the MQLS method.
T1DGC Data
Table 1 lists all significant associations in the T1DGC linkage data with p ≤ 10−4 with the use of seven association tests. Although the use of the p ≤ 10−4 threshold is somewhat arbitrary, it may be sufficient to permit comparison of the different methods. A Bonferroni correction based upon 5638 SNPs requires a genome-wide significance threshold of p ≤ 8.9 × 10⁻⁶ and a marginal genome-wide significance level of p ≤ 1.8 × 10⁻⁵.
Table 1.
Comparison of Top Association Hits in the T1DGC Data with the Use of Seven Family-Based Association Tests
| Chr | SNP | MAF | Gene | Position (bp) | GDT: 1.008 GC | GDT-PO: 1.002 GC | FBAT: 1.053 GC | PDT-SUM: 1.075 GC | PDT-AVG: 1.025 GC | TDT: 1.030 GC | 1-TDT: 1.014 GC |
|---|---|---|---|---|---|---|---|---|---|---|---|
| 11 | rs1004446 | 0.310 | INS | 2126719 | 3.6 × 10⁻¹⁰ | 1.2 × 10⁻¹¹ | 1.3 × 10⁻¹¹ | 1.4 × 10⁻⁸ | 2.5 × 10⁻⁹ | 1.8 × 10⁻¹¹ | 6.0 × 10⁻¹¹ |
| 21 | rs876498 | 0.453 | UBASH3A | 42714896 | 5.9 × 10⁻⁶ | 3.3 × 10⁻⁵ | 1.0 × 10⁻⁵ | 1.0 × 10⁻⁴ | |||
| 12 | rs737280 | 0.265 | SH2B3 | 110679359 | 1.6 × 10⁻⁵ | 9.9 × 10⁻⁶ | 1.1 × 10⁻⁵ | ||||
| 16 | rs887864 | 0.327 | CLEC16A | 11066386 | 7.9 × 10⁻⁵ | 2.9 × 10⁻⁵ | 4.8 × 10⁻⁵ | 7.1 × 10⁻⁵ | 1.0 × 10⁻⁴ | ||
| 22 | rs714027 | 0.441 | (multiple) | 28902325 | 7.5 × 10⁻⁵ | 8.0 × 10⁻⁵ | 2.2 × 10⁻⁵ | ||||
| 6 | rs1011094 | 0.475 | HLA | 28883961 | 5.0 × 10⁻⁵ | 4.3 × 10⁻⁵ | 4.1 × 10⁻⁵ | 8.7 × 10⁻⁵ | |||
| 2 | rs1990760 | 0.365 | IFIH1 | 162949558 | 9.7 × 10⁻⁵ | 4.1 × 10⁻⁵ | 9.3 × 10⁻⁵ | ||||
| 6 | rs169679 | 0.453 | HLA | 28964551 | 2.4 × 10⁻⁵ | 3.7 × 10⁻⁵ | 9.1 × 10⁻⁵ | ||||
| 6 | rs11908 | 0.405 | HLA | 33052724 | 6.7 × 10⁻⁵ | 9.9 × 10⁻⁵ | |||||
| 6 | rs1003979 | 0.477 | HLA | 33222149 | 7.1 × 10⁻⁵ | ||||||
| 7 | rs1543851 | 0.374 | 64250422 | 8.4 × 10⁻⁵ |
Only associations with a p value ≤ 0.0001 are listed, and associations that have been reported by other studies are indicated in bold. Genomic control (GC) numbers are indicated below each test, and there is no adjustment for GC inflation in the presented association results. The FBAT method is used under the default setting.
The FBAT and PDT-SUM tests have a somewhat inflated GC (1.053 and 1.075, respectively). Because GC inflation is not adjusted in association findings in Table 1, the reported association results obtained with the use of these two methods are inflated. In contrast, the GDT and GDT-PO have a much lower GC (< 1.01). Although the FBAT, with an “optimal” offset used,18 has a GC similar to the default FBAT, none of the p values obtained with the use of this method achieved our cutoff of 10−4. For this reason, we focus the remainder of our discussion on FBAT results obtained with the use of the default setting.
The strongest SNP associated with T1D is in the Insulin gene (INS [MIM 176730]) on chromosome 11p,35 reported consistently across all methods, with p = 1.4 × 10⁻⁸ to p = 1.2 × 10⁻¹¹. The second most significant association identified by the GDT, GDT-PO, and PDT methods is with a SNP in UBASH3A on chromosome 21.33 In comparison to the published p value of 10−4, the reanalysis of this SNP with the use of the GDT resulted in a stronger association result, with p = 5.9 × 10⁻⁶, a value that reaches genome-wide significance. This association was not identified by the FBAT, TDT, or 1-TDT. The third most associated SNP is in SH2B3 (MIM 605093) on chromosome 12.36 This association was identified by the GDT, GDT-PO and 1-TDT, with significance ranging from p = 1.6 × 10⁻⁵ to p = 9.9 × 10⁻⁶ (all marginally significant). Two other consistent association results were observed at CLEC16A (KIAA0350 [MIM 611303]) on chromosome 16,35,36 with a GDT p = 7.9 × 10⁻⁵, and at SNP rs714027, with a GDT p = 7.5 × 10⁻⁵ on chromosome 2237. The sixth most associated SNP from the GDT analysis is at rs169679 in the HLA (MIM 142800) region,38 with p = 1.2 × 10⁻⁴. This association is surprisingly weak, considering that the HLA is the most well-known genetic factor contributing to T1D. Overall, all of the top six T1D-associated SNPs from the GDT analysis (as well as from the GDT-PO analysis) have been reported previously,37 with p < 2 × 10⁻⁹. However, only 3, 2, 3, 3, and 4 of these previously reported associations were identified by the FBAT, PDT-SUM, PDT-AVG, TDT, and 1-TDT methods, respectively. We also tested two methods that examined the presence of population-level association beyond within-family associations. The MQLS method21 incorporating the population prevalence of T1D (0.005) was able to identify INS, SH2B3, rs714027, and HLA at p ≤ 10−4, consistent with the six top SNPs from the GDT analysis, whereas the GEE method22 identified INS, UBASH3A, rs714027, and an unknown variant on chromosome 4. We conclude that the GDT and GDT-PO are more powerful than several other tests for the identification of variants responsible for T1D.
Chromosome 6 has a ∼100 cM region in linkage with T1D, and the HLA region has a high LOD score of 213.2 for linkage.25 This strong linkage could potentially contribute to the inflation of an association test. The GC from the analysis of chromosome 6 for the GDT, FBAT, PDT-SUM, PDT-AVG, TDT, GDT-PO, and 1-TDT are 1.15, 1.33, 1.18, 1.05, 1.38, 1.42, and 1.11, respectively. This indicates that the statistics of most tests are very inflated. Given that linkage disequilibrium exists only throughout the HLA complex but in only a small portion of chromosome 6p, inflation of the test statistics at a majority of loci may be due to linkage. When IBD information is modeled in the GDT instead of the default of kinship coefficients being used, the GC reduces to 1.00 from 1.15, and the significance of the strongest association at rs169679 with the use of the GDT is reduced from p = 1.2 × 10⁻⁴ to p = 9.1 × 10⁻⁴. When an empirical variance is used for the FBAT in testing association in the presence of linkage,19 the GC reduces from 1.33 to 1.18 and the strongest association on chromosome 6 has a p > 5 × 10⁻⁴. Both of these methods are developed for testing association in the presence of linkage, and neither detected notable association on chromosome 6. The substantial inflation of the GC on chromosome 6 for the FBAT method with an empirical variance suggests that the GDT with IBD modeled is a more robust association test in the presence of linkage.
Inclusion of Covariates
The flexibility of modeling in the GDT for the accommodation of environmental and genetic factors is shown in Table 2. Four models are considered: (1) no covariates, modeled as in Table 1; (2) sex as a covariate; 3) both sex and INS SNP rs1004446 as covariates; and (4) sex and the INS SNP as covariates, with IBD information incorporated as in Equation 6. With more covariates modeled, associations become stronger at known genes. Although in theory the modeling of IBD leads to a more precise test statistic, the association results do not significantly change, partially due to weak linkage in these regions. These results demonstrate that it is sufficient to use kinship coefficients to approximate IBD estimates in the GDT statistic.
Table 2.
Modeling in the GDT with Environmental and Genetic Factors
| Adjusted |
|||||||||
|---|---|---|---|---|---|---|---|---|---|
| Chr | SNP | MAF | Position (bp) | Gene | Ref | None: 1.008 GC | Sex: 1.010 GC | Sex, INS: 1.002 GC | Sex, INS, IBD: 0.987 GC |
| 11 | rs1004446 | 0.310 | 2126719 | INS | 35 | 3.6 × 10⁻¹⁰ | 3.1 × 10⁻¹⁰ | N/A | N/A |
| 21 | rs876498 | 0.453 | 42714896 | UBASH3A | 33 | 5.9 × 10⁻⁶ | 5.3 × 10⁻⁶ | 5.2 × 10⁻⁶ | 4.3 × 10⁻⁶ |
| 12 | rs737280 | 0.265 | 110679359 | SH2B3 | 36 | 1.6 × 10⁻⁵ | 1.5 × 10⁻⁵ | 1.1 × 10⁻⁵ | 1.1 × 10⁻⁵ |
| 22 | rs714027 | 0.441 | 28902325 | (multiple) | 37 | 7.5 × 10⁻⁵ | 7.9 × 10⁻⁵ | 7.5 × 10⁻⁵ | 7.1 × 10⁻⁵ |
| 16 | rs887864 | 0.327 | 11066386 | CLEC16A | 35 | 7.9 × 10⁻⁵ | 1.1 × 10⁻⁴ | 5.7 × 10⁻⁵ | 5.4 × 10⁻⁵ |
| 6 | rs169679 | 0.453 | 28964551 | HLA | 38 | 1.2 × 10⁻⁴ | 1.1 × 10⁻⁴ | ||
| 7 | rs1543851 | 0.374 | 64250422 | 1.3 × 10⁻⁴ | 1.5 × 10⁻⁴ | 1.1 × 10⁻⁴ | 1.2 × 10⁻⁴ | ||
| 10 | rs942434 | 0.368 | 7277013 | 1.7 × 10⁻⁴ | |||||
| 6 | rs11908 | 0.405 | 33052724 | HLA | 38 | 2.0 × 10⁻⁴ | |||
Only associations with a p value ≤ 0.0002 are listed, and associations that have been reported by other studies are indicated in bold. Genomic control numbers are indicated below each model. Abbreviations are as follows: Chr, chromosome; MAF, major allele frequency; Ref, reference; GC, genomic control; IBD, identity by descent.
One interesting observation from our sequential modeling analysis is that significance of the association of CLEC16A (KIAA0350) with T1D is weakened from p = 7.9 × 10⁻⁵ to p = 1.1 × 10⁻⁴ when sex is included as a covariate. However, the significance is p = 5.7 × 10⁻⁵ when the INS gene is added to sex as a covariate in the model. CLEC16A also exhibits evidence for paternal imprinting on T1D risk. When only mother-offspring pairs are examined in the GDT-PO, p = 6.9 × 10⁻⁵. However, when father-offspring pairs are examined, p = 0.35 and the association is no longer significant. The analysis by 1-TDT shows similar results (p = 1.2 × 10⁻⁴ for mother only versus p = 0.71 for father only). To our knowledge, this is the first report of a potential paternal imprinting effect at CLEAC16A. We also carried out an association scan for the X chromosome, using both the GDT and GDT-PO methods, and no association stronger than p = 2 × 10⁻⁴ was identified.
Implementation
All methods are computationally efficient for analysis of this data set. Two software packages with implementations of the GDT and FBAT were compared, and we found that the GDT offered a computational advantage. It took the FBAT 22 MB of computer memory and 11 min on our Linux system, whereas it took the GDT 13 MB of computer memory and 2 min to analyze the same data set on the same system.
Discussion
We propose a general association method that makes use of extended pedigree structure, accommodates covariates including known associated SNPs, appropriately handles missing parental data, and protects from population stratification between families. The method, GDT, utilizes the genotype differences of all discordant relative pairs to assess association within a family. The GDT consistently outperforms all other association tests in our simulations for a common disease, and it outperforms other association tests in many scenarios for a rare disease. Extensive computer simulations and the analysis of a large-scale genome scan data set demonstrate advantages of our method over existing family-based association methods.
The improvement of the GDT in comparison to existing methods is threefold: (1) information beyond first-degree relatives is incorporated efficiently, yielding substantial gains in power in comparison to existing tests; (2) the GDT statistic has been implemented with the use of a robust technique that does not rely on large-sample theory, resulting in further power gains, especially at high levels of significance in data sets consisting of a modest number of families; and (3) covariates and weights based on family size are incorporated directly.
The GDT statistic can be presented as a robust score test that is derived from a conditional logistic regression model. When the assumption of no polygenic effect does not hold, the GDT remains valid as a robust score test, and when the model assumption holds approximately, the GDT enjoys superior power as a maximum-likelihood-based test. The conditional logistic regression model suggests a single weight in the test statistic for each family. Although the PDT is a special case of the GDT in certain nuclear families, inflated GC numbers for the PDT-SUM and PDT-AVG and the large differences in p values reported by these two PDT tests in the T1DGC data analysis may reflect poor assignment of weights for each family in the PDT statistic. The PDT-SUM gives too much weight to larger families, and the PDT-AVG gives too little weight to larger families. The weight used by the GDT is the inverse of the total number of informative (genotyped and phenotyped) individuals, and its value is between the weights used by the two PDT methods. The presented analysis of the T1DGC data demonstrates the advantage of this weight.
The ability of the GDT to incorporate covariates makes it a powerful tool for the analysis of complex traits. Markers with significant association can be adjusted as covariates, facilitating the search for additional variants. This feature is particularly important for diseases, such as T1D, with known susceptibility loci (such as HLA and INS), which should be accounted for in all T1D GWA analyses. Although the PDT does not take covariates in its current form, this feature can be adapted into the PDT via the same approach that we have used for the GDT. The FBAT method incorporates covariates by analyzing a quantitative trait defined by residuals from a logistic regression model fit, similar to the incorporation of offsets.18 Given that the FBAT method fails to detect any of the T1DGC association signals with the offset option used, the FBAT covariate adjustment for a similar data set may not help the association scan.
Although in theory, a robust association method that is based on a full likelihood model can be more powerful than the GDT, which is based on a conditional logistic regression model, such a uniformly powerful method has yet to be developed. Extensive simulations and a real data analysis demonstrate that our method has better overall performance than several existing methods. The GDT outperforms the PDT in all simulations and in the T1DGC data analysis. The GDT also outperforms the FBAT in the case of a common disease, in extended pedigrees, and in the case of missing parental data. For mapping genetic variants associated with a rare disease, a TDT-type method that discards unaffected sibling data remains useful. To address this scenario, we proposed a GDT variation, GDT-PO, effectively extending the TDT to handle missing parental data. The GDT-PO outperforms the 1-TDT and TDT in all of our simulations and in the T1DGC data analysis.
Our method, GDT, examines within-family association and thus is robust to population stratification across families. Although population admixture within families may lead to modest inflation of type I error rates, any inflation of GDT statistics can be detected via standard techniques, such as genomic control.34 Our simulations (unpublished data) suggest that methods that include between-family associations (such as the MQLS) can offer higher power than methods that examine only within-family associations (such as the GDT). However, this power advantage may not be substantial in data sets with identical pedigree structures and affection status across families (as seen in the analysis of affected sibling pairs), because the small variation of phenotypes across families contributes little to estimation of between-family association. Furthermore, the locus heterogeneity of polygenes that tends to occur between families could decrease the power more substantially for methods that include between-family association. This may explain why the GDT method was able to identify more variants than both the MQLS and GEE methods for the T1DGC data set.
We have developed a robust technique that ensures proper type I error rates and power. This robust estimator for the score variance involves precise calculation of the covariance of genotype scores among family members with the use of kinship coefficients or IBD estimates. In comparison to an asymptotic robust estimator, such as that being implemented in the PDT and 1-TDT, our robust estimator relies less on large numbers of families or similar family structures. Our simulations show that a test constructed with the use of our precise variance estimator consistently outperforms existing tests that use asymptotic variance estimators, especially at a lower level of significance. A similar robust technique has been successfully applied to robust quantitative trait linkage analysis.32,39,40 It is straightforward to extend our robust technique to family-based quantitative trait association tests. We have implemented such a robust test for a quantitative trait association analysis (see details in Appendix D) that improved a previously reported association test,30 and preliminary simulations (unpublished data) show that our robust test can maintain proper type I error rates and power even when individuals do not have identical phenotypic distributions. We also implemented an extension of the GDT method that allows testing association of haplotypes, in which case a haplotype is coded in the same way as an allele for a marker with multiple alleles. Although our robust technique in its current form does not apply to imputed genotypes that carry uncertainty,30 a standard robust technique that uses the asymptotic variance estimator (Equation 4) allows imputed genotypes and may provide substantial gains in power when applied to family-based association analysis.
The GDT and variations such as GDT-PO have been implemented in a user-friendly software package called the GDT. This software shares many nice features, as well as C++ source code, with the widely used software package Merlin.28 The GDT is similar to Merlin in many aspects, such as the capacity to handle large and complex pedigrees. In addition, each allele is coded with 4 bits (i.e., a half byte) in the GDT package, so that thousands of individuals genotyped at hundreds of thousands of SNPs from a GWAS can be analyzed rapidly on a standard workstation with 2 GB of computer memory, and gene mapping that uses genetic markers with up to 15 alleles can still be carried out. This software package runs on multiple platforms, including Linux, UNIX, and Windows operating systems, and is freely available at the authors' website to facilitate its use in analysis of current and future GWAS.
Appendix A: GDT as a Robust Score Test of a Conditional Logistic Regression Model
We show that the score (Equation 1) is the score for the likelihood of a conditional logistic regression model under the null hypothesis of no association.
To simplify presentation, we focus on the likelihood of a single family without covariates. Suppose that in this family there are N individuals in total, among which the first A individuals are affected and the remaining U individuals are unaffected. Let Yi denote an indicator of whether the ith individual is affected and Xi denote the count of a certain allele at the marker under test for the ith individual. A logistic regression model is
in which β is the odds ratio for association between the allele and the disease. Throughout this appendix, we assume that disease statuses of family members are uncorrelated, conditional on genotypes at the marker being tested; i.e., we assume no polygenic effect. The likelihood that the first A individuals are affected, conditional upon the fact that there are N affected individuals in total, is
in which elements of a set Sk index affected individuals in the kth possible scenario that A out of N individuals are affected. The log-likelihood is
and the score of the likelihood is
Under the null hypothesis of no association, the likelihood score is
The summation of the above statistics over all families yields exact expression, as in Equation 1.
Note that the validity of the score test (Equation 7) depends only on the variance estimator of the score. Even if the assumption of the conditional logistic regression model does not hold, our score test (Equation 7) remains valid. When the conditional logistic regression model holds approximately, our score test statistic (Equation 7) enjoys many “optimal” properties as a maximum-likelihood-based test.
Appendix B: Within-Family Genotype Covariance between a Pair of Relatives
The genotype score Xij is coded as the allele counts for the jth individual in the ith family. Each Xij in the ith family has the same mean μi, and each Xij - μi has the same variance . Because the genotype score Xij can be represented as the sum of two allelic effects, and , we have:
Thus, the within-family covariance between genotype scores from a pair of relatives is:
When IBD information is known or can be estimated, we have the following covariance at autosomal genes in noninbred families:
Because the kinship coefficient is the probability that two identical alleles will be sampled from a pair of individuals when we select one allele at random from each when IBD information is unknown, we have , for both noninbred and inbred families and for both autosomal and X-linked genes.
Appendix C: An Algorithm for Simulating Genotypes for a Given Pedigree
For a given pedigree with known affection status, genotypes can be simulated with the following algorithm. Suppose a family consists of N genotyped individuals, among which the first F individuals are founders. Let Xi and Di denote the genotype score and affection status for the ith individual of the family, and V denote the inheritance vector of the pedigree. Suppose penetrances of the disease and the frequency of the disease allele are specified prior to the simulation.
The probability of phenotype data conditional on founders' genotypes is
in which genotypes of nonfounders Xnf are uniquely determined by founders' genotypes and the inheritance vector. The probability of each inheritance vector is the inverse of 2 to the 2 × (N-F)th power. On the basis of this conditional probability and the Hardy-Weinberg equilibrium assumption, it is straightforward to obtain the probability of the complete phenotype data, .
We first simulate genotypes of founders at the disease locus according to a conditional probability distribution given all levels of affection status:
We then simulate genotypes of nonfounders according to the conditional probability distribution of inheritance vectors, given the already simulated founder genotypes as well as the complete phenotype data:
The simulation of markers follows immediately on the basis of simulated genotypes at the disease locus and specification of recombination fraction and linkage disequilibrium parameters. This algorithm has been implemented in a computer program, the TDT Power Calculator,5 for the empirical power calculation of the TDT method in nuclear families.
Appendix D: A Robust Quantitative Trait Association Test
We propose a robust score statistic for family-based quantitative trait association analysis. Following the same notation used in Chen and Abecasis,30 let yi and gi denote vectors of the observed traits and genotypes at a marker, respectively, for individuals in family i. The variance-covariance matrix for family i is Ωi. When a polygenic model is fitted to the phenotype data (without the use of the genotype data), a vector of fitted trait values is denoted as E(yi)(base), and the estimate of the variance-covariance matrix is denoted as Ωi(base). We define the following score statistic:
in which the matrix Cov(gi) consists of elements . Estimation of the within-family genotype variance is described in Appendix B and Equation 5, and the total genotype variance (the sum of and ) can be estimated as 2p(1-p), in which p is the frequency estimate of the tested allele. This statistic is approximately distributed as χ2 with one degree of freedom, and the score test can be shown to be robust to nonnormality of the phenotypes (unpublished data).
Supplemental Data
Supplemental Data inclue one figure and one table and can be found with this article online at http://www.ajhg.org/.
Supplemental Data
Web Resources
The URLs for data presented herein are as follows:
Software implementation of the GDT, http://people.virginia.edu/∼wc9c/GDT
Simulation of pedigree data, http://people.virginia.edu/∼wc9c/LE
Online Mendelian Inheritance in Man (OMIM), http://www.ncbi.nlm.nih.gov/omim/
Acknowledgments
This research was supported by research grants DK062418 (to S.S.R) and DC003166. We thank Gonçalo Abecasis for sharing C++ source code for the GDT implementation, Josyf Mychaleckyj for several thoughtful suggestions, and two anonymous reviewers for valuable input that improved the manuscript. This research utilizes resources provided by the Type 1 Diabetes Genetics Consortium, a collaborative clinical study sponsored by the National Institute of Diabetes and Digestive and Kidney Diseases (NIDDK), National Institute of Allergy and Infectious Diseases (NIAID), National Human Genome Research Institute (NHGRI), National Institute of Child Health and Human Development (NICHD), and Juvenile Diabetes Research Foundation International (JDRF) and supported by U01 DK062418.
References
- 1.Ewens W.J., Spielman R.S. The transmission/disequilibrium test: history, subdivision, and admixture. Am. J. Hum. Genet. 1995;57:455–464. [PMC free article] [PubMed] [Google Scholar]
- 2.Nicodemus K.K., Luna A., Shugart Y.Y. An evaluation of power and type I error of single-nucleotide polymorphism transmission/disequilibrium-based statistical methods under different family structures, missing parental data, and population stratification. Am. J. Hum. Genet. 2007;80:178–185. doi: 10.1086/510498. [DOI] [PMC free article] [PubMed] [Google Scholar]
- 3.Spielman R.S., McGinnis R.E., Ewens W.J. Transmission test for linkage disequilibrium: the insulin gene region and insulin-dependent diabetes mellitus (IDDM) Am. J. Hum. Genet. 1993;52:506–516. [PMC free article] [PubMed] [Google Scholar]
- 4.Risch N., Merikangas K. The future of genetic studies of complex human diseases. Science. 1996;273:1516–1517. doi: 10.1126/science.273.5281.1516. [DOI] [PubMed] [Google Scholar]
- 5.Chen W.M., Deng H.W. A general and accurate approach for computing the statistical power of the transmission disequilibrium test for complex disease genes. Genet. Epidemiol. 2001;21:53–67. doi: 10.1002/gepi.1018. [DOI] [PubMed] [Google Scholar]
- 6.Lange C., Laird N.M. On a general class of conditional tests for family-based association studies in genetics: the asymptotic distribution, the conditional power, and optimality considerations. Genet. Epidemiol. 2002;23:165–180. doi: 10.1002/gepi.209. [DOI] [PubMed] [Google Scholar]
- 7.Curtis D., Sham P.C. A note on the application of the transmission disequilibrium test when a parent is missing. Am. J. Hum. Genet. 1995;56:811–812. [PMC free article] [PubMed] [Google Scholar]
- 8.Curtis D. Use of siblings as controls in case-control association studies. Ann. Hum. Genet. 1997;61:319–333. doi: 10.1046/j.1469-1809.1998.6210089.x. [DOI] [PubMed] [Google Scholar]
- 9.Sun F., Flanders W.D., Yang Q., Khoury M.J. Transmission disequilibrium test (TDT) when only one parent is available: the 1-TDT. Am. J. Epidemiol. 1999;150:97–104. doi: 10.1093/oxfordjournals.aje.a009923. [DOI] [PubMed] [Google Scholar]
- 10.Spielman R.S., Ewens W.J. A sibship test for linkage in the presence of association: the sib transmission/disequilibrium test. Am. J. Hum. Genet. 1998;62:450–458. doi: 10.1086/301714. [DOI] [PMC free article] [PubMed] [Google Scholar]
- 11.Siegmund K.D., Langholz B., Kraft P., Thomas D.C. Testing linkage disequilibrium in sibships. Am. J. Hum. Genet. 2000;67:244–248. doi: 10.1086/302973. [DOI] [PMC free article] [PubMed] [Google Scholar]
- 12.Schaid D.J., Rowland C. Use of parents, sibs, and unrelated controls for detection of associations between genetic markers and disease. Am. J. Hum. Genet. 1998;63:1492–1506. doi: 10.1086/302094. [DOI] [PMC free article] [PubMed] [Google Scholar]
- 13.Knapp M. The transmission/disequilibrium test and parental-genotype reconstruction: the reconstruction-combined transmission/ disequilibrium test. Am. J. Hum. Genet. 1999;64:861–870. doi: 10.1086/302285. [DOI] [PMC free article] [PubMed] [Google Scholar]
- 14.Horvath S., Xu X., Laird N.M. The family based association test method: strategies for studying general genotype–phenotype associations. Eur. J. Hum. Genet. 2001;9:301–306. doi: 10.1038/sj.ejhg.5200625. [DOI] [PubMed] [Google Scholar]
- 15.Martin E.R., Bass M.P., Kaplan N.L. Correcting for a potential bias in the pedigree disequilibrium test. Am. J. Hum. Genet. 2001;68:1065–1067. doi: 10.1086/319525. [DOI] [PMC free article] [PubMed] [Google Scholar]
- 16.Martin E.R., Monks S.A., Warren L.L., Kaplan N.L. A test for linkage and association in general pedigrees: the pedigree disequilibrium test. Am. J. Hum. Genet. 2000;67:146–154. doi: 10.1086/302957. [DOI] [PMC free article] [PubMed] [Google Scholar]
- 17.Laird N.M., Horvath S., Xu X. Implementing a unified approach to family-based tests of association. Genet. Epidemiol. 2000;19(Suppl 1):S36–S42. doi: 10.1002/1098-2272(2000)19:1+<::AID-GEPI6>3.0.CO;2-M. [DOI] [PubMed] [Google Scholar]
- 18.Lunetta K.L., Faraone S.V., Biederman J., Laird N.M. Family-based tests of association and linkage that use unaffected sibs, covariates, and interactions. Am. J. Hum. Genet. 2000;66:605–614. doi: 10.1086/302782. [DOI] [PMC free article] [PubMed] [Google Scholar]
- 19.Lake S.L., Blacker D., Laird N.M. Family-based tests of association in the presence of linkage. Am. J. Hum. Genet. 2000;67:1515–1525. doi: 10.1086/316895. [DOI] [PMC free article] [PubMed] [Google Scholar]
- 20.Clayton D. A generalization of the transmission/disequilibrium test for uncertain-haplotype transmission. Am. J. Hum. Genet. 1999;65:1170–1177. doi: 10.1086/302577. [DOI] [PMC free article] [PubMed] [Google Scholar]
- 21.Thornton T., McPeek M.S. Case-control association testing with related individuals: a more powerful quasi-likelihood score test. Am. J. Hum. Genet. 2007;81:321–337. doi: 10.1086/519497. [DOI] [PMC free article] [PubMed] [Google Scholar]
- 22.Liang K.Y., Zeger S.L. Longitudinal data analysis using generalized linear models. Biometrika. 1986;73:13–22. [Google Scholar]
- 23.Abecasis G.R., Cookson W.O., Cardon L.R. Pedigree tests of transmission disequilibrium. Eur. J. Hum. Genet. 2000;8:545–551. doi: 10.1038/sj.ejhg.5200494. [DOI] [PubMed] [Google Scholar]
- 24.Knapp M. Using exact P values to compare the power between the reconstruction-combined transmission/disequilibrium test and the sib transmission/disequilibrium test. Am. J. Hum. Genet. 1999;65:1208–1210. doi: 10.1086/302591. [DOI] [PMC free article] [PubMed] [Google Scholar]
- 25.Concannon P., Chen W.M., Julier C., Morahan G., Akolkar B., Erlich H.A., Hilner J.E., Nerup J., Nierras C., Pociot F. Genome-wide scan for linkage to type 1 diabetes in 2,496 multiplex families from the Type 1 Diabetes Genetics Consortium. Diabetes. 2009;58:1018–1022. doi: 10.2337/db08-1551. [DOI] [PMC free article] [PubMed] [Google Scholar]
- 26.Liang K.Y., Pulver A.E. Analysis of case-control/family sampling design. Genet. Epidemiol. 1996;13:253–270. doi: 10.1002/(SICI)1098-2272(1996)13:3<253::AID-GEPI3>3.0.CO;2-7. [DOI] [PubMed] [Google Scholar]
- 27.Schaid D.J. General score tests for associations of genetic markers with disease using cases and their parents. Genet. Epidemiol. 1996;13:423–449. doi: 10.1002/(SICI)1098-2272(1996)13:5<423::AID-GEPI1>3.0.CO;2-3. [DOI] [PubMed] [Google Scholar]
- 28.Abecasis G.R., Cherny S.S., Cookson W.O., Cardon L.R. Merlin–rapid analysis of dense genetic maps using sparse gene flow trees. Nat. Genet. 2002;30:97–101. doi: 10.1038/ng786. [DOI] [PubMed] [Google Scholar]
- 29.Pilia G., Chen W.M., Scuteri A., Orru M., Albai G., Dei M., Lai S., Usala G., Lai M., Loi P. Heritability of cardiovascular and personality traits in 6,148 Sardinians. PLoS Genet. 2006;2:e132. doi: 10.1371/journal.pgen.0020132. [DOI] [PMC free article] [PubMed] [Google Scholar]
- 30.Chen W.M., Abecasis G.R. Family-based association tests for genomewide association scans. Am. J. Hum. Genet. 2007;81:913–926. doi: 10.1086/521580. [DOI] [PMC free article] [PubMed] [Google Scholar]
- 31.Lange C., DeMeo D., Silverman E.K., Weiss S.T., Laird N.M. PBAT: tools for family-based association studies. Am. J. Hum. Genet. 2004;74:367–369. doi: 10.1086/381563. [DOI] [PMC free article] [PubMed] [Google Scholar]
- 32.Chen W.M., Broman K.W., Liang K.Y. Power and robustness of linkage tests for quantitative traits in general pedigrees. Genet. Epidemiol. 2005;28:11–23. doi: 10.1002/gepi.20034. [DOI] [PubMed] [Google Scholar]
- 33.Concannon P., Onengut-Gumuscu S., Todd J.A., Smyth D.J., Pociot F., Bergholdt R., Akolkar B., Erlich H.A., Hilner J.E., Julier C. A human type 1 diabetes susceptibility locus maps to chromosome 21q22.3. Diabetes. 2008;57:2858–2861. doi: 10.2337/db08-0753. [DOI] [PMC free article] [PubMed] [Google Scholar]
- 34.Devlin B., Roeder K. Genomic control for association studies. Biometrics. 1999;55:997–1004. doi: 10.1111/j.0006-341x.1999.00997.x. [DOI] [PubMed] [Google Scholar]
- 35.Hakonarson H., Grant S.F., Bradfield J.P., Marchand L., Kim C.E., Glessner J.T., Grabs R., Casalunovo T., Taback S.P., Frackelton E.C. A genome-wide association study identifies KIAA0350 as a type 1 diabetes gene. Nature. 2007;448:591–594. doi: 10.1038/nature06010. [DOI] [PubMed] [Google Scholar]
- 36.Todd J.A., Walker N.M., Cooper J.D., Smyth D.J., Downes K., Plagnol V., Bailey R., Nejentsev S., Field S.F., Payne F. Robust associations of four new chromosome regions from genome-wide analyses of type 1 diabetes. Nat. Genet. 2007;39:857–864. doi: 10.1038/ng2068. [DOI] [PMC free article] [PubMed] [Google Scholar]
- 37.Barrett J.C., Clayton D.G., Concannon P., Akolkar B., Cooper J.D., Erlich H.A., Julier C., Morahan G., Nerup J., Nierras C. Genome-wide association study and meta-analysis find that over 40 loci affect risk of type 1 diabetes. Nat. Genet. 2009 doi: 10.1038/ng.381. Published online May 10, 2009. [DOI] [PMC free article] [PubMed] [Google Scholar]
- 38.Nejentsev S., Howson J.M., Walker N.M., Szeszko J., Field S.F., Stevens H.E., Reynolds P., Hardy M., King E., Masters J. Localization of type 1 diabetes susceptibility to the MHC class I genes HLA-B and HLA-A. Nature. 2007;450:887–892. doi: 10.1038/nature06406. [DOI] [PMC free article] [PubMed] [Google Scholar]
- 39.Sham P.C., Purcell S., Cherny S.S., Abecasis G.R. Powerful regression-based quantitative-trait linkage analysis of general pedigrees. Am. J. Hum. Genet. 2002;71:238–253. doi: 10.1086/341560. [DOI] [PMC free article] [PubMed] [Google Scholar]
- 40.Bhattacharjee S., Kuo C.L., Mukhopadhyay N., Brock G.N., Weeks D.E., Feingold E. Robust score statistics for QTL linkage analysis. Am. J. Hum. Genet. 2008;82:567–582. doi: 10.1016/j.ajhg.2007.11.012. [DOI] [PMC free article] [PubMed] [Google Scholar]
Associated Data
This section collects any data citations, data availability statements, or supplementary materials included in this article.