Abstract
PURPOSE
To evaluate the clinical features associated with the RP10 form of autosomal-dominant retinitis pigmentosa in 11 affected members of various ages from one family with a defined IMPDH1 mutation (Asp226Asn).
DESIGN
Prospective, observational case series.
METHODS
Visual function assessment included visual acuity, color vision, visual field, dark adaptometry, full-field electroretinography (ffERG), and multifocal electroretinography (mfERG). Ophthalmologic examinations, fundus photography, and optical coherence tomographic scans were also performed. Blood samples were obtained to screen for basic immune function.
RESULTS
Visual acuity was slightly reduced in the teenage years and substantially reduced in association with cystoid macular edema (CME) at all ages. Color defects were observed in three patients (one teen, two adults). Dark-adapted thresholds were elevated. Visual fields were markedly constricted by age 40 (≤20 degrees). Rod and cone a-wave and b-wave ffERG responses were small or nondetectable by age 20, with greater rod than cone loss at all ages. The normal to significantly delayed ffERG cone b-wave implicit times in different patients were explained by their mfERG implicit times from the central retina. The amplification factors (log S) and recovery kinetics derived from the full-field rod a-waves were normal. Optical coherence tomography revealed subretinal fluid accumulation in the majority of eyes. Cystoid macular edema was diagnosed in four patients. No unusual immunologic findings were noted.
CONCLUSIONS
The Asp226Asn mutation is associated with a severe, early-onset form of retinal degeneration in members of this family.
Autosomal-dominant retinitis pigmentosa (adRP) is a clinically and genetically heterogenous group of degenerative retinal disorders. To date, 14 genes have been identified in individuals with adRP accounting for approximately 50% of all cases (http://www.sph.uth.tmc.edu/RetNet/). The RP10 form has been reported in individuals of American and European (Spanish, Scottish, Irish, and Polish) origin, maps to the long arm of human chromosome 7 (q32.1),1-8 and accounts for 2% to 5% of all adRP.9 Bowne and associates10 reduced the linkage interval to 3.4 Mb in two unrelated American families and identified a G-to-A transition at codon 226 of the IMPDH1 (inosine-5′-monophosphate dehydrogenase type 1) gene. The resulting Asp226Asn mutation is the most common in the IMPDH1 gene and occurs at a site that is evolutionarily highly conserved, consistent with a highly deleterious consequence of a missense mutation in this region.10
IMPDH is an enzyme which functions as a homotetramer. IMPDH catalyzes the conversion of inosine monophosphate to xanthine monophosphate, a rate-limiting step in the de novo synthesis of guanine and adenine nucleotides. Xanthine monophosphate is subsequently converted into guanosine di- and triphosphate. There are two vertebrate forms of the enzyme, IMPDH1 and IMPDH2. IMPDH1 expression is believed to be unchanged by cell proliferation or transformation, whereas IMPDH2 expression is decreased in response to cell differentiation. IMPDH1 is expressed at high levels in kidney, pancreas, colon, peripheral blood leukocytes, fetal heart, brain, and retina.11 Despite the role in nucleotide metabolism, it appears that mutant IMPDH1 only causes disease in the retina, where it is preferentially and strongly expressed within photoreceptor cells.11,12 It remains to be determined whether mutant IMPDH1 causes adRP by interfering with nucleotide metabolism in photoreceptors.
All disease-causing mutations identified in the IMPDH1 gene to date are missense mutations. Functional consequences of specific mutations are not well characterized. In the original description of the Asp226Asn mutation, Bowne and associates10 presented functional data from one patient suggesting severe night blindness in early childhood and severe retinal degeneration at age 29 years. Wada and associates (Wada Y, ARVO Meeting, 2003, Abstract) reported early onset of the disease and severe reduction in rod and cone electroretinographs (ERGs) in patients with the Asp226Asn mutation aged <20 years. The Arg224Pro mutation in the IMPDH1 gene was identified by Kennan and associates,7 and recently, a new mutation was described by Grover and associates8 at codon 231 with a substitution of proline for arginine (Arg231Pro). Functional data from affected members of the family with the Arg231Pro mutation also suggested a severe form of retinitis pigmentosa (RP) with night blindness in the first decade, reduced visual acuity, marked constriction of the visual field, and nondetectable ERGs at a young age.
Recently, we were able to conduct extensive visual function examinations on affected members at a variety of ages from one of the original RP10 pedigrees with an Asp226Asn mutation.10 All affected members in the family share the same mutation, which is identical by descent.
METHODS
Informed consent was obtained from 11 affected (six male subjects, five female subjects; age 30.18 ± 17.16 years; range 13 to 60 years) members of the UTAD045 family with a confirmed Asp226Asn mutation10 and two unaffected members without the mutation (two female members aged 16 and 24 years) (Figure 1) in this prospective, observational case series. The patients were selected to represent a broad age sample of family members. All the testing complied with the tenets of the Declaration of Helsinki. The protocol was approved by the Institutional Review Board of the University of Texas Southwestern Medical School, Dallas. The family was originally ascertained through the Foundation Fighting Blindness’s RP registry.
FIGURE 1.
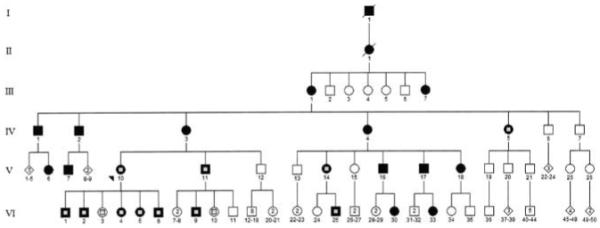
Pedigree of the UTAD045 family. Solid symbols represent affected individuals; open symbols represent unaffected individuals; symbols with a central gray square represent tested individuals.
All subjects received an ophthalmic examination by one of the authors (G.E.F.) and extensive visual testing. Best-corrected distance visual acuity was evaluated by the electronic Early Treatment of Diabetic Retinopathy Study testing protocol with an electronic visual acuity tester.13 Color vision was tested with the Farnsworth Munsell D-15 and Adams Desaturated D-15 tests. Visual fields were assessed by standard spot size 3 on a Humphrey Field Analyzer (Humphrey Instruments, San Leandro, California, USA), using program 30-2 in all patients and program 60-2 when appropriate. Total sensitivity (dB) was calculated, and equivalent visual field diameter was estimated in degrees. The equivalent visual field size was obtained by averaging the extension of the functioning visual field diagonally and horizontally through the center. At the conclusion of the visit, 60-degree fundus photographs were taken.
To assess dark adaptation, one eye of each patient was dilated with tropicamide 1.0% and phenylephrine 2.5% and fully dark adapted for 45 minutes before the tests described below were performed. Dark-adapted final thresholds and the kinetics of recovery after photobleaching were assessed on a Goldmann-Weekers adaptometer14 with an 11-degree achromatic stimulus (500-ms duration) at 7 degrees below fixation (method of limits). The time course of dark adaptation was measured after bleaching with a bright white light (4.7 log photopic troland seconds) for 3 minutes (60% bleach). Data were fit (Igor Pro; Wavemetrics, Lake Oswego, Oregon, USA) by a linear component model of rod-mediated dark adaptation.14,15
Full-field electroretinograms (ffERGs) were recorded according to ISCEV (International Society for Clinical Electrophysiology of Vision) standards from one eye with a bipolar GoldLens electrode (Doran Instruments/Diagnosys, Littleton, Massachusetts, USA). Before inserting the electrode, the pupil diameter was measured and the cornea anesthetized with proparacaine hydrochloride 0.5%. A ground electrode was positioned on the subject’s forehead. Signals were amplified (Tektronix AM502 differential amplifier; ×10,000; 3 dB down at 2 and 10,000 Hz), digitized (sampling rate = 1.25 to 5 kHz), and averaged on a personal computer. Two different flash stimulators were used. A Grass photostimulator provided short-wavelength 20-μs flashes (Wratten 47A; maximum = 470 nm, half-bandwidth = 55 nm) from -2 to 2 log scot td-s in approximately 0.3 log unit steps. A Novatron flash unit produced achromatic 1.3-ms flashes from 3.2 to 4.4 log scot td-s. Cone ERG responses were isolated by presenting stimuli on a rod-saturating (3.2 log phot td-s) background. The leading edge of the rod a-wave was fit by a computational model of the activation phase of phototransduction.16,17 The deactivation phase of the rod photoresponse was studied by the paired-flash paradigm.18,19
Multifocal electroretinograms (mfERGs) were recorded monocularly by the VERIS technique20 (EDI, San Mateo, California, USA). Subjects with dilated pupils were light-adapted to normal room lighting for 15 minutes before testing. A Burian-Allen bipolar contact lens electrode (Hansen Ophthalmic, Iowa City, Iowa, USA) was used to record responses, and a ground electrode was attached to the ipsilateral earlobe. During recording, patients fixated on a cross superimposed on top of the stimulus and extending to each corner of the screen. The subjects were corrected optically for the viewing distance. The total recording time for the 103 hexagons was 7.17 minutes. A template, obtained by averaging all 103 data points of normal subjects, was fitted to all 103 raw data points of each patient by MatLab (MathWorks, Natick, Massachusetts, USA).21 Local implicit time measurements were calculated by the software and the amount of delay was indicated for each hexagon by a grayscale display.
Optical coherence tomography (OCT) was performed. Cross-sectional 3-mm single scans at axis 30 degrees, 60 degrees, 90 degrees, 180 degrees, 300 degrees, and 330 degrees were obtained by Stratus OCT (Zeiss-Humphrey Instruments, San Leandro, California, USA) while subjects were fixing on an inner fixation target. Foveal thickness was measured as the mean height of the neurosensory retina at the center of the fovea in all sections.
Immune function was assessed. Peripheral blood samples of both affected and unaffected family members were analyzed for complete blood count with differential and platelets counts (LabCorp, Dallas, Texas, USA).
RESULTS
A summary of clinical data are shown in TABLE 1. Visual acuity was reduced at an early age up to 20/40, possibly in association with subretinal fluid accumulation. Visual acuity of 20/63 or worse was usually due to cystoid macular edema (CME), glaucoma, or amblyopia, regardless of age. CME was first diagnosed clinically and subsequently confirmed by OCT in four patients. The onset of night blindness was almost exclusively during the early childhood years. Color vision was normal in the majority of the patients. Two of the elder patients (IV/5, V/11) had considerable loss in the tritan axis, and one of the youngest family members (VI/25) exhibited nonspecific color deficiency, possibly in association with CME or glaucoma.22,23 Visual field total sensitivity of patients declined with age, as did visual field diameter. The mean equivalent circular field diameter in patients was 27.7 ± 18.8 degrees, and ranged from 60 degrees in patient VI/5 at age 16 to ≤20 degrees in patients older than 40.
TABLE 1.
Summary of Clinical Data of Patients With RP10 Autosomal-Dominant Retinitis Pigmentosa
| Subject | RFSW | Age, yr | Sex | VA OD | VA OS | Color Vision | Onset of Night Blindness | VF Total Sensitivity (dB) | VF Diameter (Degrees) |
DA Elevation (Log Units) | Additional Ophthalmologic Findings |
|---|---|---|---|---|---|---|---|---|---|---|---|
| IV/5 | 6890 | 60 | F | LP | 20/63 | Tritan | Late 20s | 0 | 0 | 3.34 | Glaucoma |
| V/11 | 6879 | 51 | M | 20/63 | 20/80 | Tritan | Childhood | 106 | 15 | 1.97 | CME OD |
| V/10 | 6885 | 49 | F | 20/25 | 20/25 | Normal | Early childhood | 39 | 10 | 3.14 | |
| V/14 | 6880 | 43 | F | 20/80 | 20/80 | Normal | Childhood | 148 | 20 | 1.65 | CME OU |
| VI/1 | 6889 | 26 | M | 20/32 | 20/32 | Normal | Childhood | 717 | 30 | 0.56 | |
| VI/2 | 6888 | 22 | M | 20/25 | 20/25 | Normal | Childhood | 1441 | 55 | 0.37 | |
| VI/9 | 6877 | 20 | M | 20/63 | 20/125 | Normal | Early childhood | 174 | 20 | 1.61 | CME OD, amblyopia |
| OS | |||||||||||
| VI/4 | 6883 | 19 | F | 20/32 | 20/32 | Normal | Early childhood | 398 | 30 | 1.24 | Coat disease |
| VI/5 | 6887 | 16 | F | 20/32 | 20/40 | Normal | Early childhood | 1429 | 60 | 0.41 | |
| VI/6 | 6886 | 13 | M | 20/32 | 20/32 | Normal | Early childhood | 589 | 20 | 2.66 | |
| VI/25 | 6881 | 13 | M | 20/100 | 20/100 | Nonspecific | Childhood | 1023 | 45 | 0.00 | CME OU |
| Unaffected | |||||||||||
| VI/3 | 6884 | 24 | F | 20/13 | 20/13 | Normal | NA | 2159 | >120 | 0.00 | |
| VI/10 | 6878 | 16 | F | 20/25 | 20/25 | Normal | NA | 2104 | >120 | 0.00 |
DA = dark-adapted threshold; LP = light perception; NA = not applicable; OD = right eye; OS = left eye; OU = both eyes; RFSW = Retina Foundation of the Southwest; VA = visual acuity; VF = visual field.
Final dark-adapted visual thresholds in the parafovea ranged from normal in one of the two youngest patients to >3 log units elevation in the eldest patient. The mean threshold elevation from normal (1.75 ± 0.24 log μapostilibs)19 was 1.1 log units in the teenage years, 0.85 log units in patients in their 20s, 2.4 log units in 40-year-olds, and 2.66 log units in patients older than 50. There was a normal time course of recovery after 60% bleach in three young patients (VI/2, VI/5, VI/25) with sufficient rod function for the measurement. The mean slope of the second component (-0.34 log unit/min), and the mean time to final threshold (22.27 minutes) were within the normal range.14,15
Table 2 lists median visual field data, median ERG values, and percentage of amplitude reduction compared with published norms for the tested age ranges.24 The median field diameter for patients differed from 37.5 degrees to less than 7.5 degrees, and the median total sensitivity differed from 806 dB to 53 dB in patients in their teens and in patients older than 50, respectively. All patients had reduced ERG responses compared with normative values. Rod ERGs were nondetectable in patients over 40. Median standard combined response amplitude values ranged from 17.9 μV in teens to 1.6μV in patients older than 50. Median 31 Hz flicker and single flash cone ERG amplitudes ranged from 3.3 μV to 0.6 μV and 11.2 to 1.4 μV, respectively.
TABLE 2.
Visual Field and ERG Values by Age Group in Patients With RP10 Autosomal-Dominant Retinitis Pigmentosa
| Age, yr | VF Diameter, Median (Degrees) | VF Total Sensitivity, Median (dB) | Patients With Extinguished Rod ERG, (Total n Tested) | Rod ERG Amplitude, % Reduction (μV)* | Standard Combined ERG Amplitude, % Reduction (μV)* | 31 Hz Flicker ERG Amplitude, % Reduction (μV)* | Single Flash Cone ERG Amplitude, % Reduction (μV)* |
|---|---|---|---|---|---|---|---|
| ≤19 (n = 4) | 37.5 | 806 | 2 (4) | 3.7 (97) | 17.9 (95) | 3.3 (95) | 11.2 (90) |
| 20-29 (n = 3) | 30 | 717 | 1 (3) | 2.9 (98) | 13.4 (96) | 5.1 (92) | 8.7 (92) |
| 40-49 (n = 2) | 15 | 93.5 | 2 (2)† | 0 (100) | 2.3 (99) | 0.8 (98) | 1.7 (98) |
| ≥50 (n = 2) | 7.5 | 53 | 2 (2)‡ | 0 (100) | 1.6 (99) | 0.6 (98) | 1.4 (98) |
| All (n = 11) | 20 | 398 | 7 (11) | 0 (100) | 4.6 (99) | 3.1 (95) | 5.2 (94) |
ERG = electroretinogram; VF = visual field.
Median values of all patients in age range. The percentages in parentheses indicate the average amplitude reduction in the affected family members compared with unaffected members.24
One of the two patients also had nonrecordable standard combined ERG.
All responses were extinguished for one of the patients.
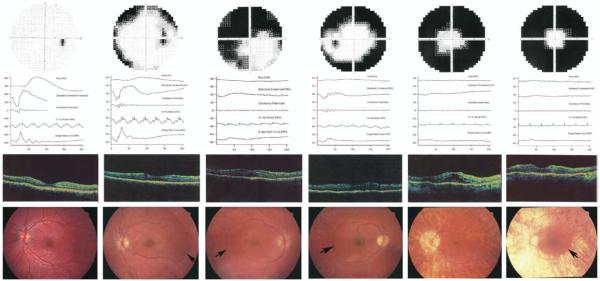
Figure 2 shows representative results of subjects at different ages. Two teenage patients of comparable age were selected to show different degrees of disease severity (Figure 2B,C). Patient VI/5 exhibited normal b-wave implicit time to 31 Hz flicker (Figure 2B), while patient VI/6 had delayed cone b-wave implicit time (Figure 2C). OCT exhibited increased foveal thickness in all patients as a result of subretinal fluid accumulation similar to that seen in association with central serous chorioretinopathy. One patient with clinical CME also exhibited intraretinal cysticlike spaces besides subretinal fluid retention, possibly as a result of development. Fundus abnormalities in all patients included optic disk pallor, attenuated vessels, peripheral choroidal atrophy, retinal pigment epithelial (retinal pigment epithelium) atrophy, and pigmentary changes that varied with age. Severe progression of the retinal dystrophy over the tested age ranges resulted in end-stage condition with extensive retinal and choroidal atrophy, and vessel attenuation.
FIGURE 2.
Representative phenotypic findings from each age group of patients with RP10 autosomal-dominant retinitis pigmentosa (adRP). (First column) Normal visual field, ERG responses (vertical spikes on 31 Hz flicker indicate flash timing), Optical coherence tomography (OCT) and fundus images from an unaffected family member (VI/10, aged 16 years). (Second column) A patient in her teenage years (VI/5, aged 16 years) shows concentric visual field loss. ERG responses are reduced, and b-wave implicit time is normal. The OCT image demonstrates mild thickening of the fovea and some subretinal fluid retention with retained foveal pit. The fundus findings include attenuated vessels, peripheral retinal pigment epithelium atrophy with almost no pigmentation and a sharp demarcation line (arrow) temporally between the healthy and affected retina. (Third column) A teenage patient (VI/6, aged 13 years) with severely constricted visual field. The rod response is extinguished, cone response reduction is substantial, and timing is delayed. The OCT shows increased retinal thickness at the fovea with subretinal fluid accumulation and absent foveal pit. The fundus abnormalities include narrow vessels, a sharp demarcation line (arrow), retinal pigment epithelium atrophy with little bone-spicule pigment formation, absent foveola reflex, and preretinal membrane. (Fourth column) An affected family member in his 20s (VI/1, aged 26 years). Visual field is constricted. ERG responses are further reduced and delayed. OCT reveals exhibits moderate thickening at the fovea, with subretinal fluid accumulation and shallow foveal pit. Fundus shows progressively attenuated vessels, widespread retinal pigment epithelium atrophy with more bone-spicule pigmentation, a sharp demarcation line (arrow), no foveola reflex, and slight cellophane-like appearance. (Fifth column) A patient in her 40s (V/14, aged 43 years). The visual field is less than 15 degrees. Rod ERG is nondetectable; other responses are severely reduced and delayed. The foveal thickness on the OCT image is markedly increased, with obvious subretinal fluid retention and possibly secondary formation of intraretinal cysticlike spaces indicating the presence of both central serous chorioretinopathy and CME. The functioning retina is confined to inside the arcades, as shown on the fundus image. The fundus characteristics include peripapillary atrophy, progressively widespread retinal pigment epithelium atrophy, little pigmentation, markedly attenuated vessels, and CME. (Sixth column) Clinical findings of a patient in his 50s (V/11, aged 51 years). The visual field is yet more constricted. Rod responses are extinguished. The cone responses are extremely reduced and delayed. The OCT image shows a moderate to severe neurosensory retinal thickness at the fovea originating from subretinal fluid retention with no evidence of typical CME and shallow depression. The fundus image shows extremely attenuated vessels, retinal pigment epithelium and choroidal atrophy, a sharp demarcation line (arrow), no foveola reflex, and slight preretinal membrane.
For all affected patients, there was a strong correlation (r2 = 0.92; P < .01) between the amplitude of the standard combined ERG response and total visual field sensitivity (Figure 3). This relationship is not unlike that in other genetic forms of RP, where the visual field parameters are statistically related to ERG amplitude.25,26
FIGURE 3.
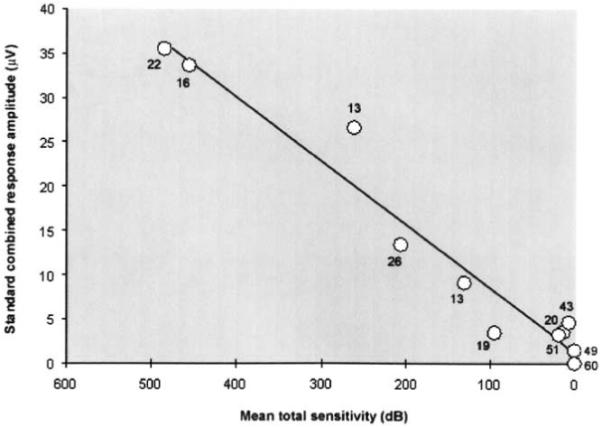
Correlation between full-field ERG and visual field in patients with RP10 adRP. The standard combined response amplitude is shown as a function of linear mean total sensitivity. The numbers next to the individual markers indicate the age of the patients. The diagonal line shows the best fit for the data points with a good correlation between the measured parameters (r2 = 0.92; P < .01). Younger patients in general had better response amplitude and higher mean sensitivity compared with older patients.
Rod-mediated and cone-mediated ERG amplitudes are compared in Figure 4. The diagonal line indicates comparable loss of rod and cone components. Patients at all ages exhibited greater loss of rod than cone amplitude.
FIGURE 4.
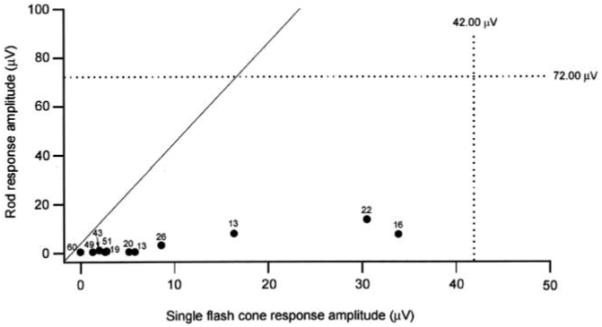
Full-field ERG amplitude of rod response as a function of single-flash cone response amplitude in patients with RP10 adRP. Black markers indicate amplitude values; dotted lines are the lower limit of normal.24 Numbers next to markers show the age of the patient. Diagonal line indicates equal rod and cone loss; rod function is more affected than cone function in all patients.
Rod and cone a-waves were recorded from four young patients with sufficient rod and cone ERG amplitudes and from the normal relatives. Transduction parameters are listed in Table 3. Unaffected subjects had values in the normal range.27 For patients, maximum amplitude (RmP3) of both rod and cone photoreceptors were significantly reduced. Although there was no reduction in the rod gain parameter (S), three of the four patients exhibited abnormally low values for the cone S parameter. The rod-to-cone ratio was calculated to determine whether, similar to the b-wave, rod-mediated function of the a-wave is more affected than cone-mediated function. The rod-to-cone ratio was lower in the patients (1.04 ± 0.52) than in the normal relatives (3.68 ± 0.29). The a-wave of the rod response was 95% reduced, whereas that of the cone response was 72% reduced compared with mean published norms.27 The deactivation phase of rod phototransduction was evaluated in two of the four young patients (VI/2, VI/5) with sufficient rod ERG amplitude. The critical time (Tc) parameter obtained from the recovery fits of both patients (mean 507.7 ms) was comparable to that obtained from normal subjects (mean 490.1 ± 111.2 ms).
TABLE 3.
Rod and Cone a-Wave Parameters in Patients With RP10 Autosomal-Dominant Retinitis Pigmentosa
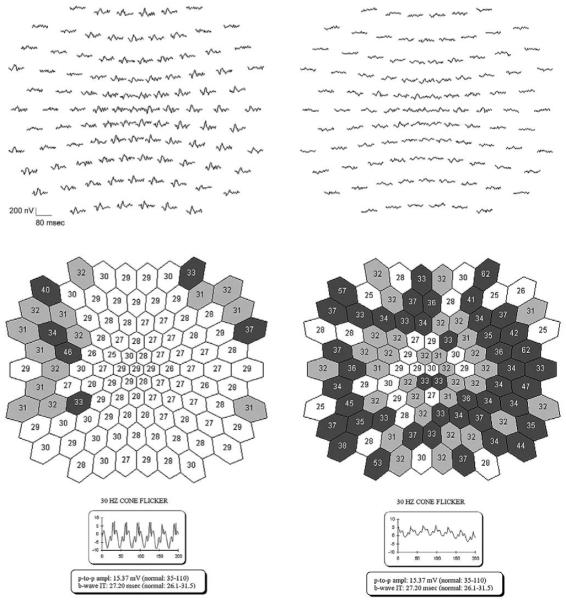
To investigate the variation in cone b-wave timing among patients, mfERGs were recorded from young patients with normal (VI/5) or delayed (VI/1) full-field 31 Hz cone responses (Figure 5). The patient with a normal 31 Hz flicker cone b-wave implicit time had some delayed responses in the periphery but responses with normal timing through much of the central retina. One patient (VI/1) with delayed 31 Hz cone responses exhibited delayed timing on the mfERG centrally with more substantial delay in the periphery.
FIGURE 5.
Timing of multifocal electroretinography (mfERG) responses in two patients with RP10 adRP. Representative raw mfERG responses are displayed at top left and right; the full-field responses are presented at the bottom. Middle left and right shows the best fitting values of the timing parameter for the mfERG responses.21 Lighter colors represent less delayed responses; darker colors, more delayed responses. (Left) Patient VI/5, with normal full-field 31 Hz cone response timing, had some delayed responses in the periphery and responses with normal timing in the center of the mfERG. (Right) Patient VI/1, with delayed 31 Hz cone responses, exhibited delayed timing both centrally and peripherally with more substantial delay in the periphery on the mfERG.
OCT scans of the right and left eye of normal relatives and patients were obtained, providing measures from four normal eyes and 22 affected eyes. Images representing a range of findings are shown in Figure 6. Foveal thickness measurements (as provided by the OCT instrument) for all patients and unaffected subjects are shown in Figure 7, with individual data points representing each eye of each subject. Foveal thickness was greatest in eyes with clinically apparent cystoid lesions (range 274 to 708 nm). Almost all patients exhibited elevated values (298 ± 133 μm; range 170 to 708 μm) due to subretinal fluid retention similar to that seen in central serous chorioretinopathy compared with unaffected eyes (183 ± 11 μm; range 170 to 193 μm) and published norms.28-30
FIGURE 6.
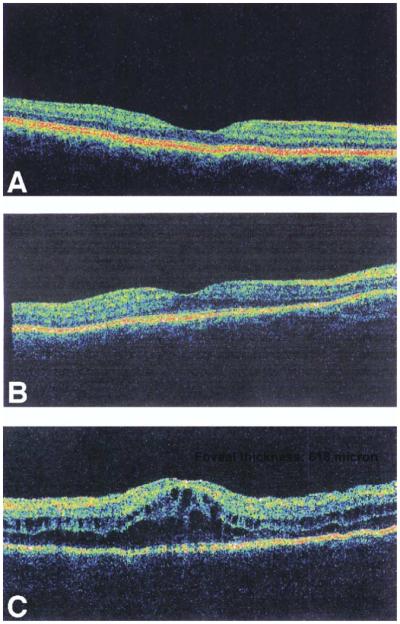
OCT image scans reflecting range of findings in patients with RP10 adRP. (A) Normal scan of one of the unaffected subjects (VI/10) (foveal thickness provided by OCT: 193 μm). (B) Representative patient with subretinal fluid accumulation but without clinical CME (Patient VI/4). The foveal area has increased thickness (foveal thickness: 251 μm) with reduced foveal depression. (C) Representative patient with clinically diagnosed CME (Patient VI/25) showing foveal thickening (foveal thickness: 618 μm) and absent foveal depression. Intraretinal round cyst formation is also present indicating CME possibly secondary to subretinal fluid retention similar to that seen in central serous chorioretinopathy. The actual foveal thickness values are depicted in the upper right hand-corner of each image.
FIGURE 7.
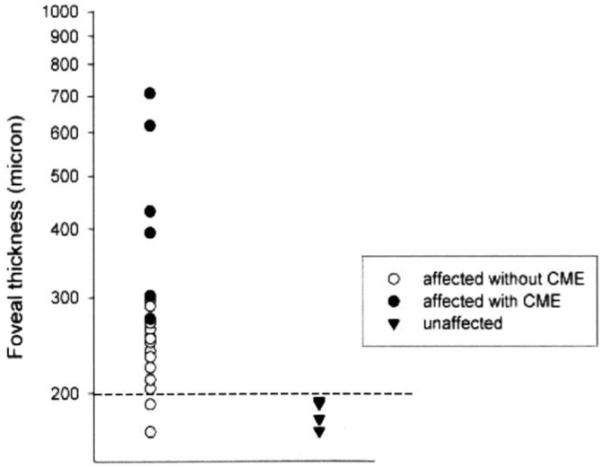
Foveal thickness measurements (as provided by the OCT instrument) of patients RP10 adRP and normal relatives. Values from each eye of patients are depicted as individual data points. Patients with clinical CME have the greatest foveal thickness. Almost all patients have thicker than normal foveal values. Dashed line indicates the upper limit of normal values.28-30 Eyes of patients with CME are represented by solid circles (order of appearance from top to bottom: VI/25—left eye, VI/25—right eye, V/14 —left eye, V/14 —right eye, V/11—right eye, VI/9 —right eye). Two of the patients had foveal thickness measurements within the normal range (VI/9 -left eye, IV/5-left eye, in order of appearance from top to bottom).
To investigate the possibility that mutant IMPDH1 might cause alterations in the immune function of RP patients, peripheral blood samples from affected and unaffected family members were tested with commercially available testing panels. Complete blood counts with differential platelet counts did not reveal any specific abnormalities, nor were there any noticeable differences in cell type counts between affected and unaffected family members.
DISCUSSION
The UTAD045 family harboring the ASP226ASN mutation exhibits a severe form of adRP with early onset of night blindness and severe visual field constriction. Progression with age of the ERG amplitude reduction seemed reasonably monotonic, although there were exceptions. ffERG rod responses were extinguished in the majority of patients and cone amplitudes were significantly reduced. The timing of the full-field cone responses was in good agreement with the timing of the mfERG responses. In general, patients younger than 40 had better-preserved visual function than patients older than 40. CME has been reported in patients with RP in approximately 15% of the cases in the literature31; however, the incidence of CME was unusually high in this family, especially in the young patients. In one patient, CME in both eyes was associated with, and possibly the result of, subretinal fluid similar to that seen in central serous chorioretinopathy. In the other three patients, the CME occurred in the absence of subretinal fluid. In six of the seven remaining patients, OCT scans revealed increased foveal thickness measurement (as provided by the OCT instrument) due to varying amounts of subretinal fluid accumulation.
Our findings are in good agreement with previous evidence for a severe phenotype in patients with the Asp226Asn mutation. Bowne and associates10 reported early onset of symptoms, constricted visual fields, and reduced ERG responses in a different pedigree with the same mutation. In one severely affected patient, aged 29 years, the rod response was still detectable, and the loss of rod and cone responses was comparable. In the family reported here, however, it is clear that rod responses are more severely affected than cone responses at all stages of the disease. Similarly, Wada and associates (Wada Y, ARVO Meeting, 2003, Abstract) reported more rod than cone involvement in the ERG of patients with the Asp226Asn mutation. In addition to posterior segment abnormalities, they also reported a significant number of cases that developed cataract. In our group of patients, no lens opacities were evident.
The only other RP10 family in which visual findings have been described in detail had an Arg231Pro mutation in IMPDH1.8 Visual findings were comparable in severity to those reported here, with night blindness in the first decade, reduced visual acuity, marked constriction of the visual field, and nondetectable ERGs at a young age.
The functional findings in RP10 patients can also be compared with those reported in other adRP patients with rhodopsin mutations,32 and RP1 mutations,33 or adRP as a group.34 Even though the mean age was the youngest in our group, the mean visual acuity, mean circular visual field diameter, and mean 31 Hz cone flicker response amplitude was the most reduced compared with the other groups. The comparison with other autosomal-dominant forms of RP supports the suggestion that the mutation in the RP10 gene causes an early-onset and severe form of the disease.
Previous studies of impdh1-/- null mice indicate decreased proliferation of lymphocytes upon stimulation by anti-CD3 plus anti-CD28, suggesting that a lack of IMPDH1 could cause problems with T-cell activation and hence alter immune function.35-38 It has also been shown that mRNA levels of both IMPDH1 and IMPDH2 increase with T-cell activation.36,39 These results raise the possibility that mutations in IMPDH1 might cause alterations in the immune function of RP patients. Preliminary analysis of peripheral blood samples from patients in this study did not find any alterations in lymphocyte cell counts. This testing did not analyze T-cell function, specifically if proliferation is induced by anti-CD3 and anti-CD28 stimulation. More specific studies aimed at addressing T-cell function are needed to thoroughly investigate possible effects of IMPDH1 mutations on immunity.
In the impdh1-/- null mice, the ERG amplitude is only moderately reduced, and disease expression is relatively mild.12 This suggests that the RP10 form of adRP is due to a dominant negative effect rather than haplo insufficiency. It is not known how mutations in IMPDH1 lead to photoreceptor degeneration. Our results suggest that the IMPDH1 mutation does not affect the visual cycle, because dark adaptation kinetics were normal. Our findings of normal rod a-wave activation kinetics and normal paired-flash rod recovery times imply that this mutation in IMPDH1 does not disrupt the activation or deactivation stages of rod phototransduction. Reduced gain parameters for cone activation are common in patients with RP,39 although the cause is not well understood. Expression studies of mutant IMPDH1 proteins in bacterial and mammalian cells, together with computational simulations, initially indicated that protein misfolding and aggregation, rather than reduced IMPDH1 enzyme activity, might be the cause of the severe phenotype experienced by humans.12 More recent evidence does not support protein instability (unpublished data) but instead suggests that alterations in nucleic acid binding might result from the mutation.40
Acknowledgments
Supported in part by NIH grants EY05235, EY09076, and EY014170 and by a center grant from the Foundation Fighting Blindness.
Biography
 Petra Kozma, MD, is a Postdoctoral Fellow in the Rose-Silverthorne Retinal Degerations Laboratory, Retina Foundation of the Southwest, Dallas, Texas. Her current research interests include phenotype to genotype relationships in patients with retinitis pigmentosa and electrophysiological studies of macular degeneration.
REFERENCES
- 1.Jordan SA, Farrar GJ, Kenna P, et al. Localization of an autosomal dominant retinitis pigmentosa gene to chromosome 7q. Nat Genet. 1993;41:54–58. doi: 10.1038/ng0593-54. [DOI] [PubMed] [Google Scholar]
- 2.Inglehearn CF, Carter SA, Keen TJ, et al. A new locus for autosomal dominant retinitis pigmentosa on chromosome 7p. Nat Genet. 1993;4:51–53. doi: 10.1038/ng0593-51. [DOI] [PubMed] [Google Scholar]
- 3.McGuire RE, Gannon AM, Sullivan LS, Rodriguez JA, Daiger SP. Evidence for a major gene (RP10) for autosomal dominant retinitis pigmentosa on chromosome 7q: linkage mapping in a second, unrelated family. Hum Genet. 1995;95:71–74. doi: 10.1007/BF00225078. [DOI] [PubMed] [Google Scholar]
- 4.McGuire RE, Jordan SA, Braden VV, et al. Mapping the RP10 locus for autosomal dominant retinitis pigmentosa on 7q: refined genetic positioning and localization within a well-defined YAC contig. Genome Res. 1996;6:255–266. doi: 10.1101/gr.6.4.255. [DOI] [PubMed] [Google Scholar]
- 5.Millan JM, Martinez F, Vilela C, Beneyto M, Prieto F, Najera C. An autosomal dominant retinitis pigmentosa family with close linkage to D7S480 on 7q. Hum Genet. 1995;96:216–218. doi: 10.1007/BF00207382. [DOI] [PubMed] [Google Scholar]
- 6.Mohamed Z, Bell C, Hammer HM, Converse CA, Esakowitz L, Haites NE. Linkage of a medium sized Scottish autosomal dominant retinitis pigmentosa family to chromosome 7q. J Med Genet. 1996;33:714–715. doi: 10.1136/jmg.33.8.714. [DOI] [PMC free article] [PubMed] [Google Scholar]
- 7.Kennan A, Aherne A, Palfi A, et al. Identification of an IMPDH1 mutation in autosomal dominant retinitis pigmentosa (RP10) revealed following comparative microarray analysis of transcripts derived from retinas of wild-type and Rho(-/-) mice. Hum Mol Genet. 2002;11:547–57. doi: 10.1093/hmg/11.5.547. [DOI] [PubMed] [Google Scholar]
- 8.Grover S, Fishman GA, Stone EM. A novel IMPDH1 mutation (Arg231Pro) in a family with a severe form of autosomal dominant retinitis pigmentosa. Ophthalmology. 2004;111:1910–1916. doi: 10.1016/j.ophtha.2004.03.039. [DOI] [PubMed] [Google Scholar]
- 9.Sohocki MM, Daiger SP, Bowne SJ, et al. Prevalence of mutations causing retinitis pigmentosa and other inherited retinopathies. Hum Mutat. 2001;17:42–51. doi: 10.1002/1098-1004(2001)17:1<42::AID-HUMU5>3.0.CO;2-K. [DOI] [PMC free article] [PubMed] [Google Scholar]
- 10.Bowne SJ, Sullivan LS, Blanton SH, et al. Mutations in the inosine monophosphate dehydrogenase 1 gene (IMPDH1) cause the RP10 form of autosomal dominant retinitis pigmentosa. Hum Mol Genet. 2002;11:559–568. doi: 10.1093/hmg/11.5.559. [DOI] [PMC free article] [PubMed] [Google Scholar]
- 11.Gu JJ, Spychala J, Mitchell BS. Regulation of the human inosine monophosphate dehydrogenase type I gene: utilization of alternative promoters. J Biol Chem. 1997;272:4458–4466. doi: 10.1074/jbc.272.7.4458. [DOI] [PubMed] [Google Scholar]
- 12.Aherne A, Kennan A, Kenna PF, et al. On the molecular pathology of neurodegeneration in IMPDH1-based retinitis pigmentosa. Hum Mol Genet. 2004;13:641–650. doi: 10.1093/hmg/ddh061. [DOI] [PubMed] [Google Scholar]
- 13.Wada Y, Sandberg MA, McGee TL, Stillberger MA, Berson EL, Dryja TP. Screen of the IMPDH1 gene among patients with dominant retinitis pigmentosa and clinical features associated with the most common mutation, Asp226Asn. Invest Ophthalmol Vis Sci. 2005;46:1735–1741. doi: 10.1167/iovs.04-1197. [DOI] [PubMed] [Google Scholar]
- 14.Birch DG, Peters AY, Locke KL, Spencer R, Megarity CF, Travis GH. Visual function in patients with cone-rod dystrophy (CRD) associated with mutations in the ABCA4(ABCR) gene. Exp Eye Res. 2001;73:877–886. doi: 10.1006/exer.2001.1093. [DOI] [PubMed] [Google Scholar]
- 15.Leibrock CS, Reuter T, Lamb TD. Molecular basis of dark adaptation in rod photoreceptors. Eye. 1998;12:511–520. doi: 10.1038/eye.1998.139. [DOI] [PubMed] [Google Scholar]
- 16.Hood DC, Birch DG. Light adaptation of human rod receptors: the leading edge of the human a-wave and models of rod receptor activity. Vision Res. 1993;33:1605–1618. doi: 10.1016/0042-6989(93)90027-t. [DOI] [PubMed] [Google Scholar]
- 17.Breton ME, Schueller AW, Lamb TD, Pugh EN., Jr. Analysis of ERG a-wave amplification and kinetics in terms of the G-protein cascade of phototransduction. Invest Ophthalmol Vis Sci. 1994;35:295–309. [PubMed] [Google Scholar]
- 18.Birch DG, Hood DC, Nusinowitz S, Pepperberg DR. Abnormal activation and inactivation mechanisms of rod transduction in patients with autosomal dominant retinitis pigmentosa and the pro-23-his mutation. Invest Ophthalmol Vis Sci. 1995;36:1603–1614. [PubMed] [Google Scholar]
- 19.Pepperberg DR, Birch DG, Hood DC. Photoresponses of human rods in vivo derived from paired-flash electroretinograms. Vis Neurosci. 1997;14:73–82. doi: 10.1017/s0952523800008774. [DOI] [PubMed] [Google Scholar]
- 20.Sutter EE, Tran D. The field topography of ERG components in man—I. The photopic luminance response. Vision Res. 1992;32:433–446. doi: 10.1016/0042-6989(92)90235-b. [DOI] [PubMed] [Google Scholar]
- 21.Hood DC, Li J. A technique for measuring individual multifocal ERG records. In: Yager D, editor. Non-invasive assessment of the visual system. Trends in optics and photonics. Vol. 11. Optical Society of America; Washington, DC: 1997. pp. 33–41. [Google Scholar]
- 22.Kelly JP, Fourman SM, Jindra LF. Foveal color and luminance sensitivity losses in glaucoma. Ophthalmic Surg Lasers. 1996;27:179–187. [PubMed] [Google Scholar]
- 23.Pinckers A, van Aarem A, Keunen JE. Colour vision in retinitis pigmentosa: influence of cystoid macular edema. Int Ophthalmol. 1993;17:143–146. doi: 10.1007/BF00942928. [DOI] [PubMed] [Google Scholar]
- 24.Birch DG, Anderson JL. Standardized full-field electroretinography: normal values and their variation with age. Arch Ophthalmol. 1992;110:1571–1576. doi: 10.1001/archopht.1992.01080230071024. [DOI] [PubMed] [Google Scholar]
- 25.Birch DG, Anderson JL. Rod visual fields in cone-rod degeneration: comparisons to retinitis pigmentosa. Invest Ophthalmol Vis Sci. 1990;31:2288–2299. [PubMed] [Google Scholar]
- 26.Sandberg MA, Weigel-DiFranco C, Rosner B, Berson EL. The relationship between visual field size and electroretinogram amplitude in retinitis pigmentosa. Invest Ophthalmol Vis Sci. 1996;37:1693–1698. [PubMed] [Google Scholar]
- 27.Birch DG, Hood DC, Locke KG, Hoffman DR, Tzekov RT. Quantitative electroretinogram measures of phototransduction in cone and rod photoreceptors: normal aging, progression with disease, and test-retest variability. Arch Ophthalmol. 2002;120:1045–1051. doi: 10.1001/archopht.120.8.1045. [DOI] [PubMed] [Google Scholar]
- 28.Goebel W, Kretzchmar-Gross T. Retinal thickness in diabetic retinopathy: a study using optical coherence tomography (OCT) Retina. 2002;22:759–767. doi: 10.1097/00006982-200212000-00012. [DOI] [PubMed] [Google Scholar]
- 29.Kondo M, Ito Y, Ueno S, Piao CH, Terasaki H, Miyake Y. Foveal thickness in occult macular dystrophy. Am J Ophthalmol. 2003;135:725–728. doi: 10.1016/s0002-9394(02)02158-x. [DOI] [PubMed] [Google Scholar]
- 30.Massin P, Erginay A, Haouchine B, Mehidi AB, Paques M, Gaudric A. Retinal thickness in healthy and diabetic subjects measured using optical coherence tomography mapping software. Eur J Ophthalmol. 2002;12:102–108. doi: 10.1177/112067210201200205. [DOI] [PubMed] [Google Scholar]
- 31.Fishman GA, Maggiano JM, Fishman M. Foveal lesions seen in retinitis pigmentosa. Arch Ophthalmol. 1977;95:1993–1996. doi: 10.1001/archopht.1977.04450110087008. [DOI] [PubMed] [Google Scholar]
- 32.Berson EL, Rosner B, Weigel-DiFranco C, Dryja TP, Sandberg MA. Disease progression in patients with dominant retinitis pigmentosa and rhodopsin mutations. Invest Ophthalmol Vis Sci. 2002;43:3027–3036. [PubMed] [Google Scholar]
- 33.Berson EL, Grimsby JL, Adams SM, et al. Clinical features and mutations in patients with dominant retinitis pigmentosa-1 (RP1) Invest Ophthalmol Vis Sci. 2001;42:2217–2224. [PubMed] [Google Scholar]
- 34.Birch DG, Anderson JL, Fish GE. Yearly rates of rod and cone functional loss in retinitis pigmentosa and cone-rod dystrophy. Ophthalmology. 1999;106:258–268. doi: 10.1016/S0161-6420(99)90064-7. [DOI] [PubMed] [Google Scholar]
- 35.Zimmermann AG, Gu JJ, Laliberte J, Mitchell BS. Inosine-5′-monophosphate dehydrogenase: regulation of expression and role in cellular proliferation and T lymphocyte activation. Prog Nucleic Acid Res Mol Biol. 1998;61:181–209. doi: 10.1016/s0079-6603(08)60827-2. [DOI] [PubMed] [Google Scholar]
- 36.Dayton JS, Lindsten T, Thompson CB, Mitchell BS. Effects of human T lymphocyte activation on inosine monophosphate dehydrogenase expression. J Immunol. 1994;152:984–991. [PubMed] [Google Scholar]
- 37.Dayton JS, Mitchell BS. Type I inosine monophosphate dehydrogenase: evidence for a single functional gene in mammalian species. Biochem Biophys Res Commun. 1993;195:897–901. doi: 10.1006/bbrc.1993.2129. [DOI] [PubMed] [Google Scholar]
- 38.Gu JJ, Tolin AK, Jain J, Huang H, Santiago L, Mitchell BS. Targeted disruption of the inosine 5′-monophosphate dehydrogenase type I gene in mice. Mol Cell Biol. 2003;23:6702–6712. doi: 10.1128/MCB.23.18.6702-6712.2003. [DOI] [PMC free article] [PubMed] [Google Scholar]
- 39.Tzekov RT, Locke KG, Hood DC, Birch DG. Cone and rod ERG phototransduction parameters in retinitis pigmentosa. Invest Ophthalmol Vis Sci. 2003;44:3993–4000. doi: 10.1167/iovs.02-1104. [DOI] [PubMed] [Google Scholar]
- 40.McLean JE, Hamaguchi N, Belenky P, Mortimer SE, Stanton M, Hedstrom L. Inosine 5′-monophosphate dehydrogenase binds nucleic acids in vitro and in vivo. J Biochem. 2004;379:243–251. doi: 10.1042/BJ20031585. [DOI] [PMC free article] [PubMed] [Google Scholar]


