Abstract
Purpose
To compare the regional diffusivity of water in the brains of normally aging elderly, patients with mild cognitive impairment (MCI), and probable Alzheimer’s Disease (AD).
Materials and Methods
We compared the apparent diffusion coefficients (ADC) and the anisotropy indexes (AI) obtained from frontal, parietal, temporal, occipital, anterior and posterior cingulate white matter (WM), thalamic and hippocampal regions of interest (ROI) in 21 probable AD, 19 MCI patients, and 55 normally aging elderly controls without evidence of cognitive impairment.
Results
The hippocampal ADC were higher in MCI and AD patients than in controls. ADC of the temporal stem, posterior cingulate, occipital and parietal WM were higher in AD patients than in controls. Except for lower occipital AI in MCI patients than in controls, there were no differences in the AI among the three clinical groups for any of the ROI.
Conclusion
Hippocampal ADC were significantly different between controls and MCI: many of whom likely have pre-clinical AD. Elevation in hippocampal ADC may reflect early ultrastructural changes in the progression of Alzheimer’s pathology.
Keywords: Dementia, Alzheimer Disease, MR diffusion study, Mild cognitive impairment
Introduction
Diffusion-weighted magnetic resonance imaging (DWI) is an imaging technique that is sensitive to microscopic random motion of water molecules in biologic tissue (1). It provides functional or physiologic information not present in conventional T1 and T2 weighted anatomic MRI (2). For example, DWI now plays an important role in detection of hyperacute cerebral ischemia due to the comparably lower sensitivity of T1 and T2 weighted MRI at identifying early ischemic changes (3).
The pathological changes in the cortical gray matter of the brain in Alzheimer’s disease (AD) is characterized by the accumulation of neurofibrillary tangles and senile plaques along with neuronal and synaptic loss which produce cerebral atrophy. The initial pathological involvement have been shown to occur in the medial temporal lobes, and MR guided volumetry has depicted the early atrophy of the hippocampi in patients with mild AD (4,5). Besides the cortical pathology, white matter (WM) rarefaction with axonal damage and gliosis has been reported in patients with AD (6). With DWI, it is possible to quantitate physiologic alterations in water diffusion resulting from microscopic structural changes that are not detectable with anatomical imaging.
The syndrome of mild cognitive impairment (MCI) resides within the cognitive continuum from normal aging to AD. MCI patients have a significantly higher rate of progression to AD (12 to 15 % per year) compared to cognitively normal elderly persons (1 to 2 % per year) (7). Clinical criteria for the diagnosis of MCI have been established and these patients are the primary study group in several national trials (7–9). DWI findings in the brains of AD patients have previously been studied (10–12). We are not aware however, of studies addressing the DWI findings in patients with MCI.
In this study, we hypothesized that the magnitude of water diffusion measured with apparent diffusion coefficients (ADC) and the directionality of diffusion measured with the anisotropy index (AI) may be altered by the early ultrastructural changes caused by the pathological process of AD. We aimed to characterize and compare the regional diffusivity of water in normally aging elderly, MCI, and probable AD patients who reside at different points along the cognitive continuum from normal aging to AD.
Methods
Recruitment and Characterization
Between September 1998 and April 2000, 21 AD, 19 MCI patients and 55 normally aging subjects were consecutively recruited from the Alzheimer’s Disease Research Center (ADRC) /Alzheimer’s Disease Patient Registry (ADPR) at the xxx, which are prospective longitudinal studies of aging and dementia, as approved by our institutional review board (13). Informed consent for participation was obtained from every subject and/or an appropriate surrogate. Individuals participating in ADRC/ADPR were evaluated by a behavioral neurologist and a neuropsychologist. Neurological examination and neuropsychological tests including the Mini Mental State Examination (MMSE) (14) were done, the education level of the subjects (in years) were recorded and all of the subjects underwent structural brain MRI and routine laboratory tests. At the completion of the evaluation, a consensus committee meeting was held involving the behavioral neurologists, neuropsychologists, nurses and the geriatrician who evaluated the subjects. Subjects with structural abnormalities that could produce dementia, such as cortical infarction, tumor, subdural hematoma, or who had treatments or concurrent illnesses interfering with cognitive function other than AD were excluded. Subjects were not excluded for the presence of leukoaraiosis.
The diagnosis of probable AD was made according to the Diagnostic and Statistical Manual for Mental Disorders 3rd edition – revised (DSM-III-R) (15) criteria for dementia, and the National Institute of Neurological and Communicative Disorders and Stroke / Alzheimer’s Disease and Related Disorder’s Association (NINCDS / ADRDA) (16) criteria for AD. The severity of dementia was rated with the Clinical Dementia Rating (CDR) score (17). ApoE genotyping was performed on all subjects. Subjects with genotypes known to confer increased risk of AD (∈3/4 and ∈4/4) were grouped as ∈4 carriers, and those with ∈2/3 and ∈3/3 genotype were grouped as ∈4 non-carriers. Subjects with ∈2/4 genotype were not included in ApoE analyses.
Patients with MCI met the following criteria: 1) memory complaint, 2) normal general cognition, 3) normal activities of daily living, and 4) not demented (7). These patients had a CDR of 0.5 with isolated memory impairment without deficits in other cognitive domains. This diagnosis of MCI represents a clinical judgment and is not based solely on fixed cut-off scores on psychometric tests.
Controls were defined as individuals who; 1) were independently functioning community dwellers 2) did not have active neurological or psychiatric conditions, 3) had no cognitive complaints, 4) had a normal neurological exam, 5) were not taking any psychoactive medications in doses that would impact cognition.
MRI and DWI
The MR imaging and DWI studies were performed on a 1.5 T (Signa; General Electric Medical Systems, Milwaukee, WI) MR scanner. After a sagittal scout, coronal T1 weighted images were obtained to be used as an anatomic reference for the placement of the regions of interest (ROI). Special attention was paid to the symmetric positioning of the patient’s head. Single shot echo planar - fluid attenuated inversion recovery (EPI-FLAIR) DWI was performed in a coronal plane with TR=9999ms, TE=93ms, TI= 2200 ms, slice thickness 5mm, slice spacing 2.5 mm, and FOV= 40×20 cm to cover whole head. A FLAIR image with b=0 s/mm2, and DWI with b=1000 s/mm2 in three orthogonal directions were acquired from each slice. With the image analysis software FuncTool (General Electric Medical Systems, Milwaukee, WI), average ADC maps were computed pixel by pixel based on the Stejskal and Tanner equation (1).
Elliptical ROI 12–30 pixels (29.3 – 73.2 mm2) in size were drawn over the EPI-FLAIR images that concurrently appeared on the ADC maps (Figure 1). Eight pairs of ROI were placed in each subject over the WM of the right and left frontal lobes, parietal lobes, occipital lobes, medial temporal lobes (temporal stem), anterior and posterior cingulate gyri, thalami and hippocampi by the same investigator (KK) who was blinded to the clinical diagnoses of the subjects (Figures 1 and 2). Parietal and frontal WM ROI were placed away from the ventricles in order to exclude visibly apparent periventricular WM hyperintensities as well as to place the ROI at the same location in every patient. The hippocampal ROI were manually traced over the hippocampal heads in order to exclude the perihippocampal cerebrospinal fluid (CSF) spaces. The thalamic, anterior cingulate WM and the temporal stem ROI were placed on the same image the hippocampal heads were traced. The thalamic ROI were placed over the medial dorsal nuclei. These nuclei constitute the limbic thalamus, receiving input from the hippocampus and amygdala and projecting fibers to the limbic cortex, which are structures known to be involved with early AD pathology (18). Temporal stem is defined as the WM connection between the temporal lobe and the frontal and parietal lobes (19). Because of the low spatial resolution of the EPI- FLAIR images, coronal T1 weighted images that had identical slice thickness and location were used as an anatomic reference for the placement and tracing of the ROI (Figure 1). AI’s were calculated for every WM ROI. (AI= ADCmax − ADCmin / ADCaverage) (20).
Figure 1.
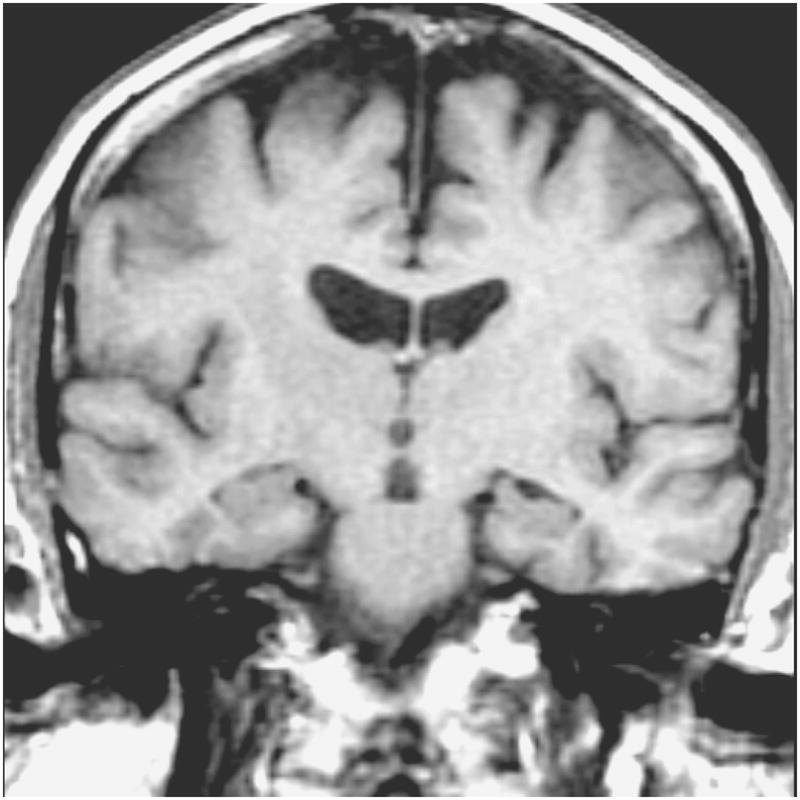
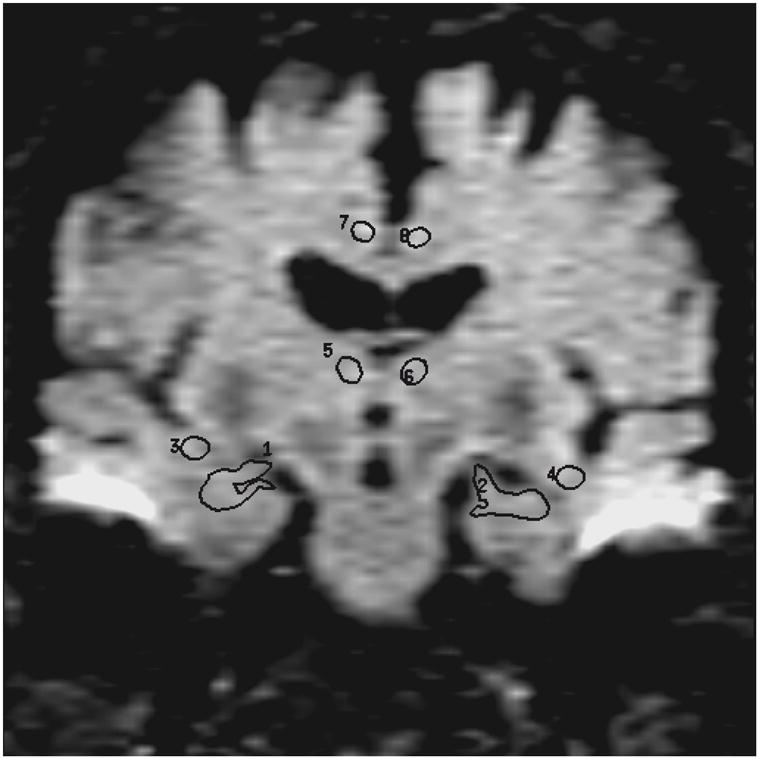
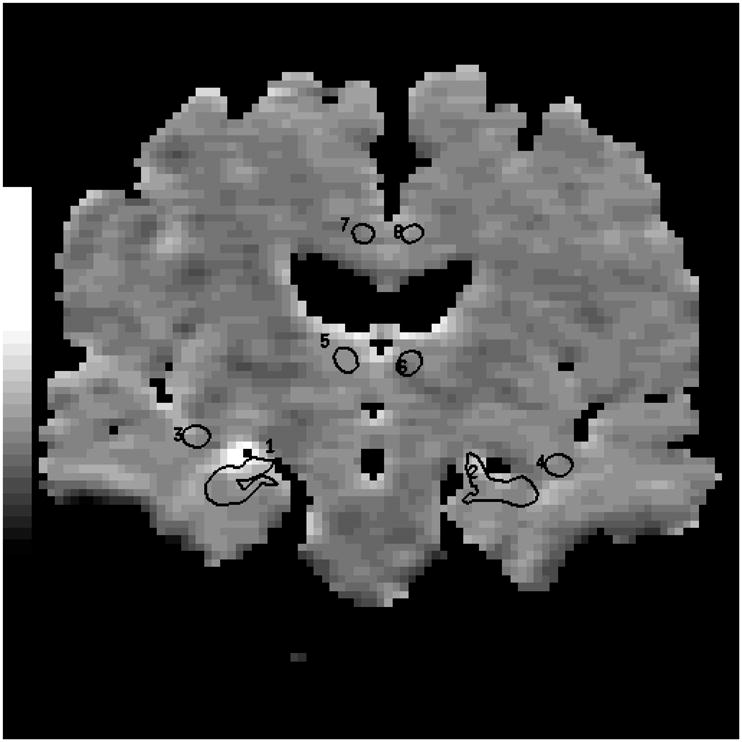
Coronal T1-weighted image (700 /14) is used to guide the placement of the ROI (a). Anterior cingulate WM, thalamic, and temporal stem ROI are placed and hippocampal ROI are traced on the coronal FLAIR image (9999 /93 /2200, b=0 s /mm2) (b). These ROI concurrently appear on the ADC (average) map generated from the FLAIR and the three orthogonal DWI pixel by pixel based on the Stejskal and Tanner equation (c). (1 and 2= right and left hippocampal ROI, 3 and 4=right and left temporal stem ROI, 5 and 6= right and left thalamic ROI, 7 and 8 = right and left anterior cingulate WM ROI)
Figure 2.
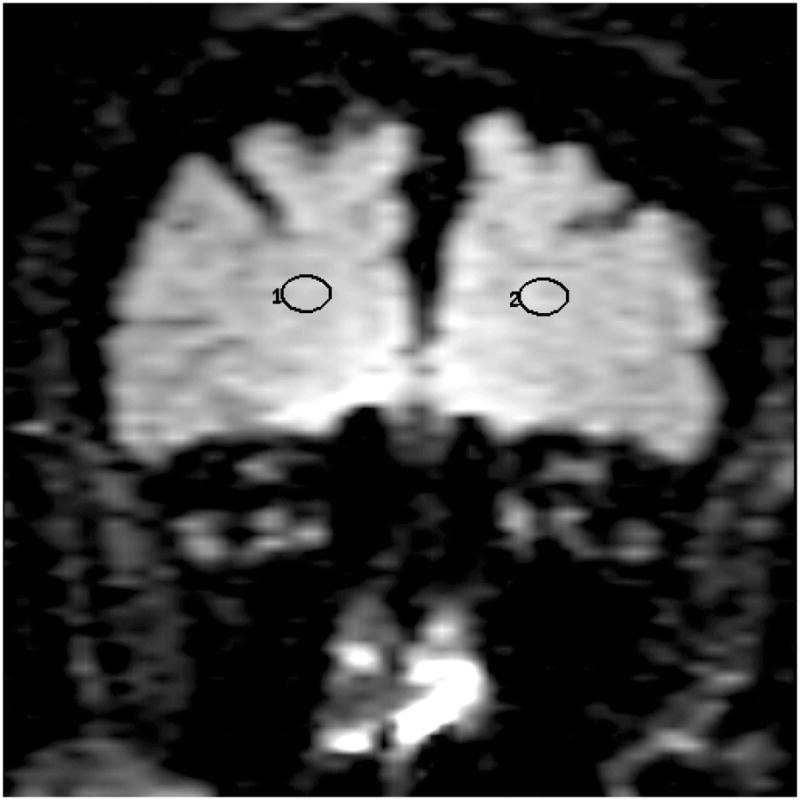
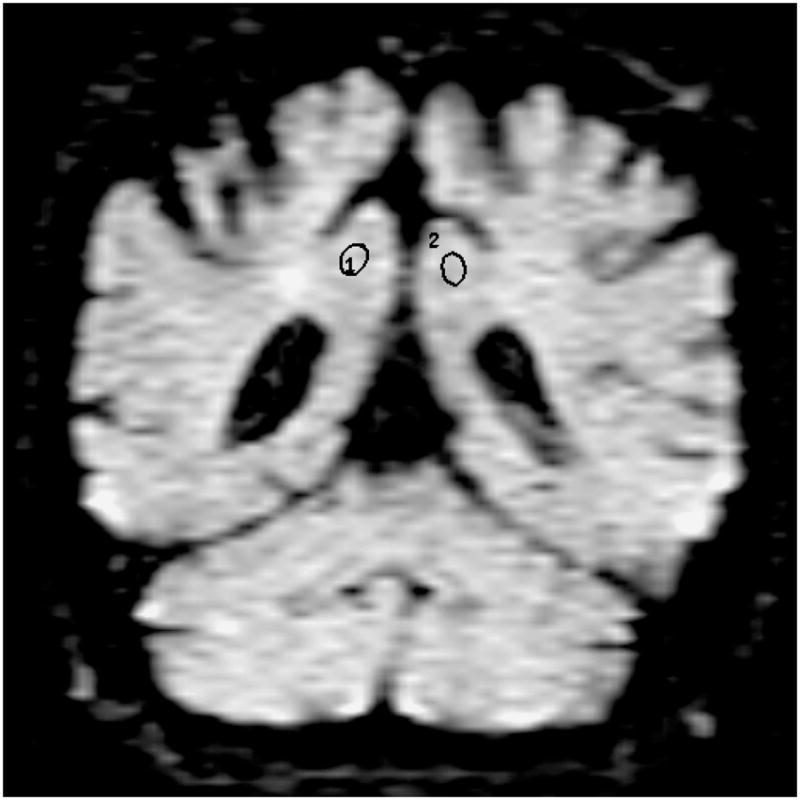
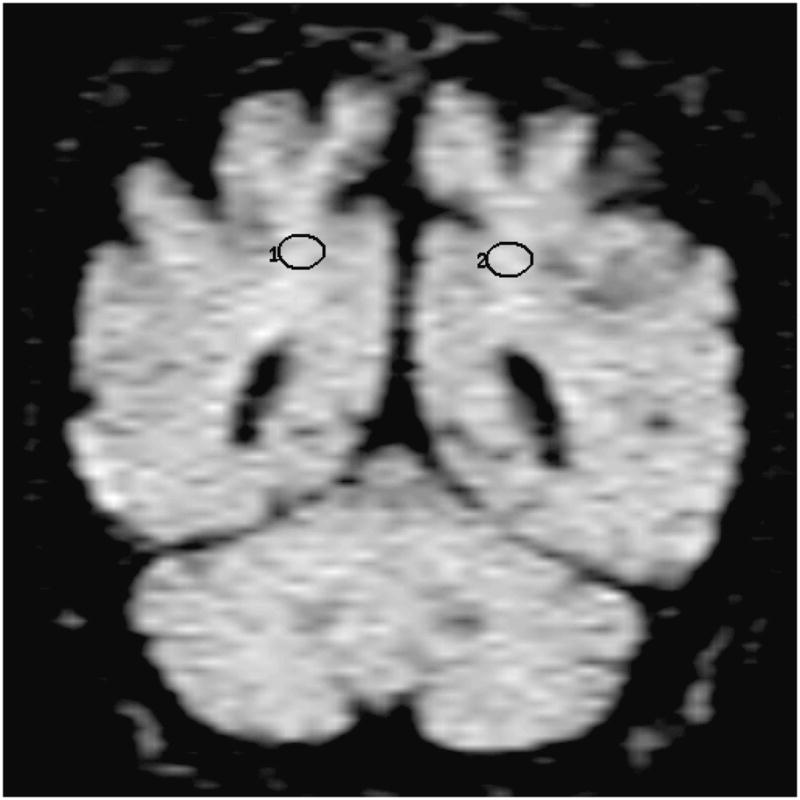
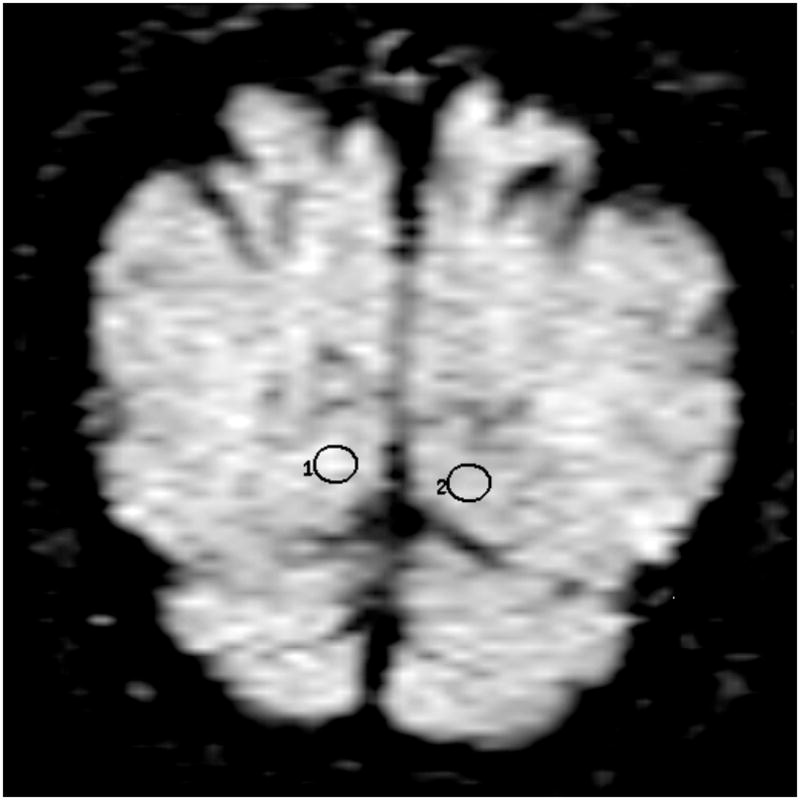
Location of the frontal lobe (a), posterior cingulate (b), parietal (c), and occipital (d) WM ROI on the coronal FLAIR image (9999 /93 /2200, b = 0 s /mm2). (1=right, 2=left)
Statistical Analyses
The differences in the mean ages, education (in years) and the MMSE scores in three clinical groups were tested by rank sum tests and the gender differences were tested by chi-square tests. The differences in right and left hemisphere ADC and AI’s were tested by signed rank tests. The effects of age and gender on ADC and AI were tested in a single model by multiple regression analysis in control subjects only, as the data in controls should be free of the confounding effects of disease. The differences in the ADC and AI of the ApoE ∈4 carriers and non-carriers were tested by rank sum tests in the three clinical groups independently. Between-group differences in ADC and AI were tested by multiple regression analysis. The level of significance was p< 0.05. The sensitivity and specificity of DWI in distinguishing AD and MCI subjects from controls were calculated at a fixed specificity of 80 %.
Results
The demographic aspects of the study group are presented in Table 1. The mean ages of the control, MCI and probable AD subjects were not different (p>0.05). The differences in male/female ratios of the three groups were not statistically significant (p>0.05). Education level was higher in controls than in AD patients (p=0.038). The mean Mini- Mental State Examination (MMSE) scores of probable AD patients were lower than those of controls and MCI patients (p<0.001). The mean MMSE scores of MCI patients were less than those of controls (p=0.004). The median CDR score in AD subjects was 1 (range 0.5–2). The ApoE ∈4 carrier /non-carrier ratios were higher in AD patients than in controls (p=0.001), and higher in MCI patients than in controls (p=0.004). The ApoE ∈4 carrier/non-carrier ratios of MCI and AD subjects were not different (p>0.05). There was no correlation between the ApoE genotype and ADC or AI in any of the ROI’s in each clinical group.
Table 1.
Demographic aspects of the subjects
| Control | MCI | AD | |
|---|---|---|---|
| n | 55 | 19 | 21 |
| Age (mean ± SD) | 81.36 ± 6.80 | 81.26 ± 6.64 | 79.14 ± 6.19 |
| Male/Female | 26 / 29 | 9 / 10 | 10 / 11 |
| Education | |||
| (mean ± SD in years) | 13.81 ± 2.89 | 13.32 ± 3.58 | 12.47 ± 2.50 |
| MMSE (mean ± SD) | 28.68 ± 1.37 | 26.83 ± 2.90 | 18.63 ± 5.53 |
| ApoE status | |||
| (∈4 carrier /non-carrier*) | 5 / 50 | 6 / 13 | 10 / 11 |
Subjects with a genotype of ∈3/4 and ∈2/4 were grouped as ∈4 carriers and subjects with a genotype of ∈2/3 and ∈3/3 were grouped as ∈4 non-carriers.
Except higher right thalamic ADC than the left (p=0.001), we did not find any difference between the ADC from the right and left hemisphere ROI’s in controls. Due to this difference, right and left thalamic ADC were analyzed separately for all three clinical groups and the homologous hemisphere values were combined for the remaining ROI’s. We tested for the effects of age on ADC and AI in control subjects, and there was no association between age and ADC or AI in any of the ROI (p>0.05).
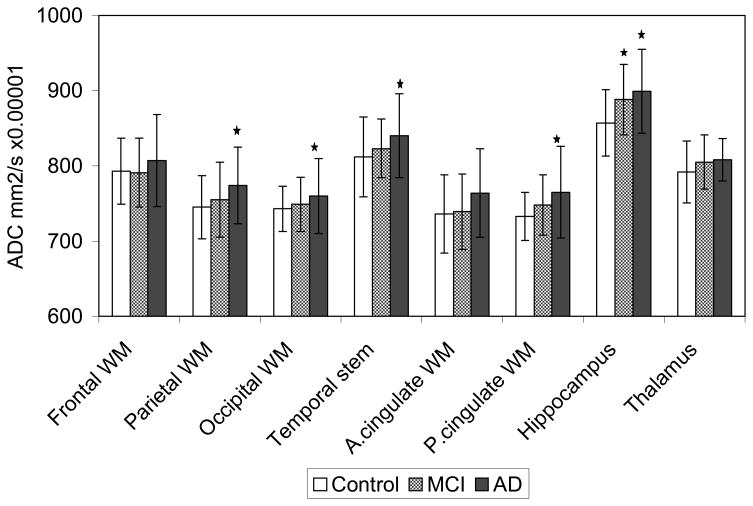
The mean ± standard deviation (SD) of ADC obtained from each of the eight ROI’s in control, MCI and AD subjects and the differences between the ADC of the three clinical groups are presented in table 2. The only measurement that differed between control and MCI subjects was the hippocampal ADC, which was higher in MCI patients compared to controls (p=0.016) and similar to the AD patients. Although a similar trend was seen in the ADC from other ROI, we did not find any difference between the ADC of MCI patients and controls in the remaining ROI (p>0.05). The ADC were higher in probable AD patients than control subjects in the temporal stem (p=0.014), occipital (p=0.047) parietal (p=0.004), posterior cingulate WM (p=0.001), and hippocampal ROI (p=0.001) (table 2 and figure 3).
Table 2.
ADC (mean ± SD × 10−6 mm2/s) and between-group comparison of ADC in control, MCI and probable AD subjects
| ROI Location * | Control | MCI | AD | Control | Control | MCI |
|---|---|---|---|---|---|---|
| n= 55 | n= 19 | n= 21 | vs. MCI | vs. AD | vs. AD | |
| Frontal WM | 793 ± 44 | 791 ± 46 | 807 ± 61 | NS | NS | NS |
| Parietal WM | 745 ± 42 | 755 ± 50 | 774 ± 51 | NS | P= 0.004 | NS |
| Occipital WM | 743 ± 30 | 749 ± 36 | 760 ± 50 | NS | P= 0.047 | NS |
| Temporal Stem | 812 ± 53 | 823 ± 39 | 840 ± 56 | NS | P=0.014 | NS |
| Anterior Cingulate WM | 736 ± 52 | 739 ± 50 | 764± 59 | NS | P=0.053 | NS |
| Posterior Cingulate WM | 733 ± 32 | 748 ± 40 | 765 ± 61 | NS | P= 0.001 | NS |
| Hippocampus | 857 ± 44 | 888 ± 47 | 899 ± 56 | P=0.016 | P=0.001 | NS |
| Right Thalamus* | 800 ± 46 | 805 ± 66 | 811 ± 69 | NS | NS | NS |
| Left Thalamus* | 783 ± 46 | 805 ± 58 | 804 ± 65 | NS | NS | NS |
NS: not significant (p>0.05)
Analyses of the ADC were made with the right and left hemisphere ROI’s together, except the right and left thalamic ROI’s, which were analyzed separately due to higher right thalamic ADC than left in controls (p<0.01). There were no other side to side differences in ADC of the homologous ROI in controls.
Figure 3.
The bar graph shows the means and the error bars show the ± SD ADC (mm2/s × 10−6) of the control, MCI and AD subjects from the eight ROI.
The parietal, posterior (P.) cingulate WM and the hippocampal ADC are higher in AD patients than in controls (p<0.01), the temporal stem and occipital WM ADC are higher in AD patients than in controls (p<0.05), and hippocampal ADC are higher in MCI patients than in controls (p<0.05).
In order to assess the potential diagnostic utility of ADC measurements, we fixed the specificity for inter-group discrimination at 80% ( this corresponds to an ADC threshold value of 891 × 10−6 mm2/s) and calculated the diagnostic sensitivity for each of the clinical group pairs. This assessment was done only for the hippocampus, since only hippocampal ADC were statistically significantly higher in both AD and MCI patients compared to controls. At a fixed specificity of 80%, the sensitivity of distinguishing AD patients from controls was 57% and MCI patients from controls was 47 % (Table 3).
Table 3.
Hippocampal ADC for distinction between controls vs. AD and MCI patients at a specificity of 80 %
| Calculation | AD vs. Control | MCI vs. Control |
|---|---|---|
| Sensitivity | 57 % (12 /21) | 47 % (9 /19) |
| Specificity | 80 % (44 /55) | 80 % (44 /55) |
| Positive predictive value | 52 % (12 /23) | 45 % (9 /20) |
| Negative predictive value | 83 % (44 /53) | 82 % (44 /54) |
The AI obtained from the temporal stem, frontal, parietal, occipital, anterior cingulate and posterior cingulate WM ROI were analyzed. In the controls, anterior cingulate AI were higher on the right side compared to the left (p<0.05). Other than that, there were no side to side differences in the AI of homologous brain regions. Except for the lower occipital AI in MCI patients than in controls (p= 0.036), there was no difference between the AI of the control, MCI and probable AD patients in any of the WM ROI (p>0.05).
Discussion
Diffusivity of water depends primarily on the presence of microscopic structural barriers in tissue that can alter the random motion of water molecules. Membranes of cell bodies, axons and myelin sheaths impede the movement of water in the brain tissue. Pathologic disruption of cell membranes, loss of myelin and axonal processes would lessen the restriction on the movement of water and therefore, the diffusivity measured by ADC would be expected to increase. Water diffuses along the orientation of the axons that are aligned in tracts, and this directionality of water diffusion is termed anisotropy. Loss of tissue organization would also cause a decrease in anisotropy.
In this study, the magnitude of water diffusion within the temporal stem, occipital, posterior cingulate, and parietal WM ROI were greater in patients with probable AD than in control and MCI subjects. Our findings are in agreement with prior studies that revealed higher ADC in the temporal stem and parietal white matter of AD patients compared to controls (11,12). The posterior cingulate gyrus is a part of the limbic system and is known to be involved early in the pathological progression of AD, and this have been demonstrated with functional imaging studies. PET (21, 22) and SPECT (23) revealed decreased glucose metabolism and blood flow in the posterior cingulate gyrus and pericingular parietal cortex in pre-clinical AD patients and subjects at risk for developing AD compared to the normal elderly people. With 1H MRS, an elevation in the myoinositol /creatine ratio have been identified in the posterior cingulate gyri in both patients with MCI and probable AD compared to elderly controls (24). The temporal stem serves as a conduit for temporal to extra-temporal WM tracts within which the spatial orientation of the fibers are generally uniform. It was previously postulated that this increase in ADC reflects decreased fiber density, including the disruption and loss of axonal membranes or myelin (12).
Correlation of MRI findings with WM pathology in AD indicated that periventricular hyperintensities on MRI are often related to the loss of myelinated axons and gliosis in the deep WM (25). WM rarefaction is associated with vascular risk factors especially hypertension. Independent of the periventricular changes, WM degeneration of secondary /Wallerian type has been identified to correlate with the subjacent cortical pathology in AD (6, 26). These studies suggest that two independent forms of WM degeneration may co-exist in AD patients; periventricular WM disease, which is usually evident on MRI and presumably of vascular-ischemic in origin, and Wallerian type WM degeneration secondary to the adjacent cortical neurodegenerative pathology. The WM regions we studied did not include the periventricular hyperintense areas on FLAIR images. In light of the previous studies on the WM pathology in AD, the finding of increased diffusivity of water in the temporal stem, posterior cingulate, occipital and parietal WM in AD patients suggests rarefaction of axons and myelin, and can be explained by anterograde Wallerian degeneration.
A decrease in anisotropy in the temporal stem and parietal WM of AD patients have been reported(10,11,12). It was postulated that the decrease in anisotropy reflects decreased fiber density including loss of axonal membranes or myelin (12). Except for lower occipital AI in MCI patients than in controls, our data did not reveal any other differences between the AI among controls, MCI and AD patients. This discrepancy may be related to a technical limitation in DWI, which was also encountered by the previous investigators (11). Because AI is a measure of directionality of diffusion, it is highly sensitive to the variable orientation of the head with respect to the fixed geometry of the MRI system’s gradients. In this study, the diffusion gradients were applied in the three logical orthogonal planes, which would cause a high degree of variability if all the subjects’ heads were not the same size and oriented the same way. This was apparent in our data with high variance of the AI, which may be the reason for not finding a difference between the AD patients and controls as reported by other groups (11,12). Calculation of the AI here is based only on the trace of the diffusion tensor. Solving the entire tensor with rotationally invariant techniques and application of higher number of diffusion gradients would overcome this problem (27).
In the controls, the ADC from the medial dorsal nuclei of thalami were higher on the right side compared to the left. This difference was not present in MCI or AD patients. There was however a trend of increase in ADC in the left thalami of AD and MCI subjects compared to controls which was not statistically significant. Although, such difference has not been reported before, our data from 53 normal elderly is one of the largest series in the literature. Our data imply that a side to side structural difference normally exists – ei. the neurons and glial cells may be more densely packed in the medial dorsal nuclei of left thalami compared to the right, so that the extracellular space is narrower and the diffusivity is less. However, we are not aware of any histological studies which would support this idea.
In the MCI subjects, the mean ADC were nearly always higher than the controls, and lower than the AD patients. However, only in the hippocampus did this trend reach statistical significance. Based on prior longitudional clinical studies, patients with MCI progress to AD at a rate of 12 % per year (7). We can be fairly certain that the significant majority of our group of MCI patients were composed of individuals who had pre-clinical AD while a smaller proportionally had isolated memory problem that may never progress to AD in their lifetime. Involvement of the hippocampus occurs very early during the pathological progression of AD (4). Synapse and neuron loss which coexist with the neurofibrillary pathology is present in the hippocampi of subjects with pre-clinical AD, who have isolated memory problems as in MCI (28,29,30). The increased diffusivity in the hippocampi of both MCI and probable AD patients is in agreement with the pathological evolution of AD. It suggests expansion of the extracellular space due to neuron loss. In addition, glial activation associated with neuritic senile plaques would also contribute to elevated ADC by producing an expansion of the extracellular space (31).
Diffusion of water in the hippocampi of AD patients has also been studied by other groups. One recent study had shown higher ADC in the hippocampi of AD patients than the control subjects (11). Another study did not identify any difference between the hippocampal ADC of normal elderly and AD patients (12). In both of these studies however, the hippocampi were not traced in order to exclude the contributions from the CSF but rather an ROI was placed over the hippocampi. It has been shown that CSF may significantly contribute to ADC measurements: A previous study revealed higher ADC values from the cortical gray matter with a spin-echo diffusion sequence compared to an inversion recovery diffusion sequence due to contamination with the CSF signal (32). Suppression of CSF would especially be important in patients with AD in whom the hippocampi are atrophic and partial volume averaging of CSF may be present when relatively thick slices as in DWI were used. Therefore, we used an EPI-FLAIR pulse sequence for DWI to avoid contributions from the CSF. CSF was not suppressed in the previous studies (11,12) which may be a reason for discrepant findings.
This data indicates that DWI may be able to identify early ultrastructural changes in the progression of Alzheimer’s pathology. At our center the accuracy for the clinical diagnosis of AD compared to the pathological diagnosis is 81%. Furthermore, due to the high degree of overlap between the ADC values of the three groups and low sensitivity in distinguishing AD and MCI patients from normal controls, our findings suggest limited value for clinical diagnosis in individual patients. However, measurements of ADC may be valuable in instances where group effects are of interest such as drug trials. With longitudinal follow-up of MCI patients, we will be able to determine if there is a correlation between the hippocampal ADC and rate of progression to AD.
Acknowledgments
The authors would like to thank Ruth Cha for performing the statistical analysis.
Grant Support: Supported by NIH- NIA AG11378, AG06786, AG16574, and the Alzheimer’s Association.
References
- 1.Stejskal EO, Tanner JE. Spin diffusion measurements: spin-echo in presence of a time dependent field gradient. J Chem Phys. 1965;42:288–292. [Google Scholar]
- 2.Le Bihan D, Breton E, Lallemand D, Grenier P, Cabanis E, Laval-Jeantet M. MR imaging of incoherent motions: application to diffusion and perfusion in neurologic disorders. Radiology. 1986;161:401–407. doi: 10.1148/radiology.161.2.3763909. [DOI] [PubMed] [Google Scholar]
- 3.Provenzale JM, Sorensen GA. Diffusion weighted MR imaging in acute stroke: theoretic considerations and clinical applications. AJR. 1999;173:1459–1467. doi: 10.2214/ajr.173.6.10584783. [DOI] [PubMed] [Google Scholar]
- 4.Braak H, Braak E. Neuropathological staging of Alzheimer’s disease. Acta Neuropathol (Berl) 1991;82:239–259. doi: 10.1007/BF00308809. [DOI] [PubMed] [Google Scholar]
- 5.Jack CR, Petersen RC, Xu Y, et al. Medial temporal atrophy an MRI in normal aging and very mild Alzheimer’s disease. Neurology. 1997;49:786–794. doi: 10.1212/wnl.49.3.786. [DOI] [PMC free article] [PubMed] [Google Scholar]
- 6.Englund E. Neuropathology of white matter changes in alzheimer’s disease and vascular dementia. Dement Geriatr Cogn Disord. 1998;9(suppl 1):6–12. doi: 10.1159/000051183. [DOI] [PubMed] [Google Scholar]
- 7.Petersen RC, Smith GE, Waring SC, Ivnik RJ, Tangalos EG, Kokmen E. Mild cognitive impairment clinical characterization and outcome. Arch Neurol. 1999;56:303–308. doi: 10.1001/archneur.56.3.303. [DOI] [PubMed] [Google Scholar]
- 8.Petersen RC, Smith GE, Ivnik RJ, et al. Apolipoprotein E status as a predictor of the development of Alzheimer’s disease in memory impaired individuals. JAMA. 1995;273 (16):1274–1278. [PubMed] [Google Scholar]
- 9.Smith GE, Petersen RC, Parisi JE, Ivnik RJ. Definition, course, and outcome of mild cognitive impairment. Aging, Neuropsychology and Cognition. 1996;3(2):141–147. [Google Scholar]
- 10.Hanyu H, Shindo H, Kakizaki D, Abe K, Iwamoto T, Takasaki M. Increased water diffusion in cerebral white matter in Alzheimer’s disease. Gerontology. 1997;43:343–351. doi: 10.1159/000213874. [DOI] [PubMed] [Google Scholar]
- 11.Sandson TA, Felician O, Edelman RR, Warach S. Diffusion weighted magnetic resonance imaging in Alzheimer’s Disease. Dement Geriatr Cogn Disord. 1999;10:166–171. doi: 10.1159/000017099. [DOI] [PubMed] [Google Scholar]
- 12.Hanyu H, Sakurai H, Takasaki M, Shindo H, Abe K. Diffusion weighted MR imaging of the hippocampus and temporal white matter in Alzheimer’s disease. J of Neurol Sci. 1998;156:195–200. doi: 10.1016/s0022-510x(98)00043-4. [DOI] [PubMed] [Google Scholar]
- 13.Petersen RC, Kokmen E, Tangalos E, Ivnik RJ, Kurland LT. Mayo Clinic Alzheimer’s Disease Patient Registry. Aging. 1990;2:408–415. doi: 10.1007/BF03323961. [DOI] [PubMed] [Google Scholar]
- 14.Folstein MF, Folstein SE, McHugh PR. “Mini-Mental State”: a practical method for grading the cognitive state of patients for the clinician. J Psychiatr Res. 1075;12:189–198. doi: 10.1016/0022-3956(75)90026-6. [DOI] [PubMed] [Google Scholar]
- 15.American Psychiatric Association. Diagnostic and statistical manual of mental disorders. 3. Washington, DC: 1987. DSM-III-R. revised. [Google Scholar]
- 16.Mc Khann GM, Drachman D, Folstein M, Katzman R, Price D, Stadlan EM. Clinical diagnosis of Alzheimer’s Disease: report of the NINCDS ADRDA work group under the auspices of Department of Health and Human Services Task Force on Department of Health and Human Services Task Force on Alzheimer’s disease. Neurology. 1984;34:39–944. doi: 10.1212/wnl.34.7.939. [DOI] [PubMed] [Google Scholar]
- 17.Morris JC. The Clinical Dementia Rating (CDR): current version and scoring rules. Neurology. 1993;43:2412–2414. doi: 10.1212/wnl.43.11.2412-a. [DOI] [PubMed] [Google Scholar]
- 18.Gower EC. Efferent projections from limbic cortex of the temporal pole to the magnocellular medial dorsal nucleus in the rhesus monkey. J of Comp Neurol. 1989;280:343–358. doi: 10.1002/cne.902800303. [DOI] [PubMed] [Google Scholar]
- 19.Duvernoy HM. The human hippocampus: functional anatomy, vascularization and serial sections with MRI. Berlin; New York: Springer; 1998. [Google Scholar]
- 20.Brunberg JA, Chenevert TL, McKeever PE, et al. In vivo MR determination of water diffusion coefficients and diffusion anisotropy: correlation with structural alteration in gliomas of the cerebral hemispheres. AJNR. 1995;16:361–371. [PMC free article] [PubMed] [Google Scholar]
- 21.Minoshima S, Giordani B, Berent S, Frey KA, Foster NL, Kuhl DE. Metabolic reduction in the posterior cingulate cortex in very early Alzheimer’s disease. Ann Neurol. 1997;42:85–94. doi: 10.1002/ana.410420114. [DOI] [PubMed] [Google Scholar]
- 22.Reiman EM, Caselli RJ, Yun LS, et al. Preclinical evidence of Alzheimer’s disease in persons homozygous for the ∈4 allele for apolipoprotein E. N Engl J Med. 1996;334:752–758. doi: 10.1056/NEJM199603213341202. [DOI] [PubMed] [Google Scholar]
- 23.Johnson KA, Jones K, Holman BL, et al. Preclinical prediction of Alzheimer’s disease using SPECT. Neurology. 1998;50:1563–1571. doi: 10.1212/wnl.50.6.1563. [DOI] [PubMed] [Google Scholar]
- 24.Kantarci K, Jack CR, Xu YC, et al. Regional metabolic patterns in mild cognitive impairment and Alzheimer’s disease, a 1H MRS study. Neurology. 2000;55(2):210–217. doi: 10.1212/wnl.55.2.210. [DOI] [PMC free article] [PubMed] [Google Scholar]
- 25.Scheltens P, Barkhof F, Leys D, Wolters EC, Ravid R, Kamphorst W. Histopathologic correlates of white matter changes on MRI in Alzheimer’s disease and normal aging. Neurology. 1995;45:883–888. doi: 10.1212/wnl.45.5.883. [DOI] [PubMed] [Google Scholar]
- 26.Smith CD, Snowdon DA, Wang H, Markesbery WR. White matter volumes and periventricular white matter hyperintensities in aging and dementia. Neurology. 2000;54:838–842. doi: 10.1212/wnl.54.4.838. [DOI] [PubMed] [Google Scholar]
- 27.Pierpaoli C, Jezzard P, Basser PJ, Barnett A, Di Chiro G. Diffusion tensor MR imaging of the human brain. Radiology. 1996;201:637–648. doi: 10.1148/radiology.201.3.8939209. [DOI] [PubMed] [Google Scholar]
- 28.Price JL, Morris JC. Tangles and plaques in nondemented aging and preclinical Alzheimer’s disease. Ann Neurol. 1999;45:358–368. doi: 10.1002/1531-8249(199903)45:3<358::aid-ana12>3.0.co;2-x. [DOI] [PubMed] [Google Scholar]
- 29.Delacourte A, David JP, Sergeant N, et al. The biochemical pathway of neurofibrillary degeneration in aging and Alzheimer’s disease. Neurology. 1999;52:1158–1165. doi: 10.1212/wnl.52.6.1158. [DOI] [PubMed] [Google Scholar]
- 30.Grober E, Dickson D, Sliwinski MJ, et al. Memory and mental status correlates of modified Braak staging. Neurobiol of Aging. 1999;20(6):573–579. doi: 10.1016/s0197-4580(99)00063-9. [DOI] [PubMed] [Google Scholar]
- 31.Dickson DW. The pathogenesis of senile plaques. J Neuropath and Exp Neurol. 56(4):321–329. doi: 10.1097/00005072-199704000-00001. [DOI] [PubMed] [Google Scholar]
- 32.Kwong KK, McKinstry RC, Chien D, Crawley AP, Pearlman JD, Rosen BR. CSF-suppressed quantitative single shot diffusion imaging. Magn Reson in Med. 1991;21:157–163. doi: 10.1002/mrm.1910210120. [DOI] [PubMed] [Google Scholar]


