

Abstract
Common SNPs in the chromosome 17q12-q21 region alter the risk for asthma, type 1 diabetes, primary biliary cirrhosis, and Crohn disease. Previous reports by us and others have linked the disease-associated genetic variants with changes in expression of GSDMB and ORMDL3 transcripts in human lymphoblastoid cell lines (LCLs). The variants also alter regulation of other transcripts, and this domain-wide cis-regulatory effect suggests a mechanism involving long-range chromatin interactions. Here, we further dissect the disease-linked haplotype and identify putative causal DNA variants via a combination of genetic and functional analyses. First, high-throughput resequencing of the region and genotyping of potential candidate variants were performed. Next, additional mapping of allelic expression differences in Yoruba HapMap LCLs allowed us to fine-map the basis of the cis-regulatory differences to a handful of candidate functional variants. Functional assays identified allele-specific differences in nucleosome distribution, an allele-specific association with the insulator protein CTCF, as well as a weak promoter activity for rs12936231. Overall, this study shows a common disease allele linked to changes in CTCF binding and nucleosome occupancy leading to altered domain-wide cis-regulation. Finally, a strong association between asthma and cis-regulatory haplotypes was observed in three independent family-based cohorts (p = 1.78 × 10⁻⁸). This study demonstrates the requirement of multiple parallel allele-specific tools for the investigation of noncoding disease variants and functional fine-mapping of human disease-associated haplotypes.
Introduction
Bronchial asthma (MIM 600807) is the most common chronic disease among children and young adults1 and is characterized by intermittent inflammation of the small airways of the lung with characteristic symptoms of wheezing and shortness of breath. Asthma and asthma-related traits are complex genetic disorders because of the interactions between multiple genes and environmental factors.2 To date, more than 30 replicated loci have been associated with these diseases.3 A genome-wide association study (GWAS) reported common SNPs in the 17q12-q21 region to be associated with childhood asthma and also linked with the expression level of the ORM1-like 3 (S. cerevisiae) (ORMDL3) gene4 (MIM 611403). Furthermore, one SNP (rs7216389) based on evolutionary conservation was highlighted as the potential causal variant. To date, several other studies have replicated this association for adult asthma in different ethnic groups.5–8 The rs7216389 SNP is found within a large CEU (CEPH collection of individuals of European descent) linkage disequilibrium (LD) block that encompasses not only ORMDL3, but also gasdermin B (GSDMB), zona pellucida binding protein 2 (ZPBP2), and IKAROS family zinc finger 3 (Aiolos) (IKZF3) genes (Figure 1). Another variant (rs2872507) located within this same LD block has been associated with Crohn disease (CD)9 (IBD22, MIM 612380). More recently, the same region was associated with the risk of type 1 diabetes (T1D) (MIM 222100)10 and primary biliary cirrhosis (PBC) (MIM 109720).11 Therefore, elucidation of the genetic mechanisms of transcriptional control of the IKZF3-ORMDL3 genomic region may potentially shed light on the pathogenesis of multiple complex diseases.
Figure 1.
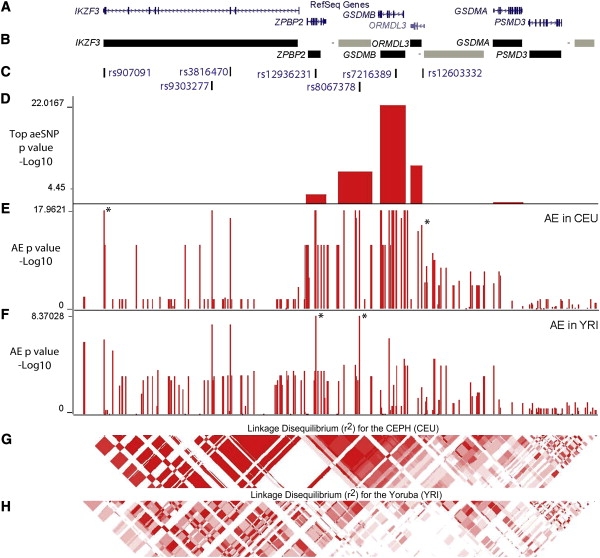
Allelic Expression Analysis of the Genes Found in the Vicinity of rs7216389
(A) RefSeq genes found within the 17q12-q21 region.
(B) Informative windows tested for AE via the Illumina 1M duo (three intergenic [−] regions with expressed SNPs were also tested [in gray]).
(C) Location of pertinent SNPs.
(D) Blocks showing the top association for each transcript (−log10(p value)) via high-throughput AE mapping data generated from 34 informative CEU HapMap LCLs by the Illumina 1M BeadChips (B.G., D.K. Pokholok, T.K., E.G., L. Morcos, D.J.V., J. Le, V.K., K.C.L.L., V. Gagné, J.D., R.H., A. Montpetit, M.-M. Joly, E.J. Harvey, D.S., P. Beaulieu, R. Hamon, A. Graziani, K.D., E.H., J. Majewski, H.H.H. Göring, A.K.N., M. Blanchette, K.L. Gunderson, and T.P., unpublished data).
(E and F) GSDMB AE mapping results for 32 informative CEU LCLs (E) (stars delimit the 160 kb CEU rHAP) and for 21 informative YRI LCLs (F) (stars delimit the 22 kb YRI rHAP). Vertical red lines correspond to −log10(p value) of the AE assay for each SNP tested and generated by a two-sided Fisher's exact test.
(G and H) Linkage disequilibrium (r2) for CEU phased genotype data (G) and for YRI phased genotype data (H).
To validate and map regulatory variants affecting gene regulation, measurement of allelic expression (AE) differences in individuals provides a specific means to assess cis-acting variation. We have recently developed a highly sensitive approach for mapping cis-regulatory variation based on interindividual variation in AE (B.G., D.K. Pokholok, T.K., E.G., L. Morcos, D.J.V., J. Le, V.K., K.C.L.L., V. Gagné, J.D., R.H., A. Montpetit, M.-M. Joly, E.J. Harvey, D.S., P. Beaulieu, R. Hamon, A. Graziani, K.D., E.H., J. Majewski, H.H.H. Göring, A.K.N., M. Blanchette, K.L. Gunderson, and T.P., unpublished data). The ability to focus on cis-regulatory components of AE allows us to identify strong genetic influences on the allelic transcriptional regulation of genes. Earlier AE and cis-eQTL studies on the HapMap CEU lymphoblastoid cell lines (LCL) by us and others (Ge et al. unpublished data12,13) as well as in other CEU LCLs14 have revealed that asthma-associated SNPs modify the expression levels of ORMDL3 and GSDMB. Originally, the expression change of ORMDL34 was put forward as a functional mechanism underlying the asthma association; however, the fact that more than one transcript is under genetic control in this region suggests that the mechanism may be more complex.
In this study, we undertook several steps to identify the SNPs involved in the observed AE. First, to identify all the potential DNA variants that may affect AE, we resequenced the 160 kb AE-associated CEU haplotype. Next, we refined this AE-associated haplotype by measuring AE in a second population of LCLs (Yoruba [YRI]) and generated a map of SNPs associated with AE. The domain-wide influence of the haplotype on the expression of the 17q12-q21 genes was suggestive of long-range chromatin effects. Therefore, to identify DNA polymorphisms associated with allele-specific chromatin effects, we screened candidate SNPs via formaldehyde-assisted isolation of regulatory elements (FAIRE). We identified one SNP that demonstrated stable allelic differences in association with nucleosomes and the insulator protein CTCF. Parallel analysis of our three best candidate SNPs via EMSA across multiple cell types revealed a second functional SNP in the same haplotype. Finally, we show the close link between the identified functional variants and asthma risk in several asthma cohorts.
Material and Methods
Cell Culture of Lymphoblastoid Cell Lines
HapMap immortalized lymphoblastoid cell lines (LCLs) were grown in T75 flasks in 1X RPMI 1640 Media (Invitrogen, Burlington, ON) (with 2 mM L-glutamine, 15% fetal bovine serum, and 1% penicillin/streptomycin) at 37°C with 5% CO2. For the FAIRE, MNase treatment, N-ChIP and X-ChIP assays, LCLs were grown to 90% confluency. Two independent cultures of cells were used for the FAIRE assay (input and FAIRE-treated cells). The study was approved by the local ethics committee (McGill University IRB).
RNA Extraction and Reverse Transcription for Expression Analysis
Total RNA was extracted from cell lysates of 53 and 57 unrelated CEU and YRI HapMap LCLs,15 respectively, with the RNeasy Mini Kit (QIAGEN, Mississauga, ON). High-quality RNA was confirmed for all samples with an Agilent 2100 BioAnalyzer (Agilent Technologies, Palo Alto, CA), and the concentrations were determined with the Nanodrop ND-1000 (NanoDrop Technologies, Wilmington, DE). Total RNA was annealed to 250 ng of random hexamers (Invitrogen, Carlsbad, CA) at 70°C for 10 min. First-strand cDNA synthesis was performed with SuperScript II reverse transcriptase (Invitrogen) according to the manufacturer's instructions. The CEU cDNA was used for gene expression analysis of the 17q12-q21 region by quantitative real-time PCR whereas the YRI cDNA was used for AE measurements of GSDMB and ORMDL3.
DNA Isolation
Genomic DNA (gDNA) from the CEU and YRI cell lysates was extracted with the GenElute DNA Miniprep Kit (SigmaAldrich, Oakville, ON) according to the protocol provided by the manufacturer, and concentrations were determined with the Nanodrop ND-1000.
Primer Design
All primers were designed with the Primer3 v. 0.4.0 software. Primer sequences can be found in Table S1 available online.
Allelic Expression Measurements and Mapping by Normalized Sanger Sequencing in CEU and YRI LCLs
AE measurements for GSDMB and ORMDL3 in the CEU LCLs have been previously reported12 and were generated by normalized Sanger sequencing with the PeakPicker software,16 which compares cDNA sequence allele ratios to the gDNA allele ratio and accounts for reaction-to-reaction variation in nucleotide incorporation (causing technical variation in heterozygote ratios) by normalizing allele ratios to flanking sequence allele-specific fluorescence. AE measurements by normalized Sanger sequencing in the YRI LCLs were assayed with intragenic SNPs in individuals that were heterozygous for that SNP. GSDMB was assayed with rs1008723, rs7216389, and rs7219923 whereas ORMDL3 was assayed with rs12603332 and rs8076131. In brief, the gDNA and cDNA from heterozygous samples was amplified for each marker SNP in duplicate, verified by agarose gel electrophoresis, and sequenced with ABI Big Dye chemistry and capillary electrophoresis on an ABI 3730 sequencer (Applied Biosystems, Foster City, CA). Relative allelic expression levels for each SNP were assessed with the PeakPicker software.12,16
To determine which SNPs were associated with AE, the population distribution of AE in phased chromosomes was tested for association with a two-sided Fisher's exact test.17,18 To assess the significance level of the Fisher's exact tests, permutation tests were performed by shuffling the AE phenotypes among the informative LCL samples (n = 100,000), repeating the Fisher's exact tests for all flanking SNPs and keeping minimum p values achieved in each permutation cycle to derive empirical, locus-wide significance. Phased haplotype and AE phenotype information for each HapMap LCL used as well as Fisher's exact test p values for each SNP can be found in Table S2 (GSDMB [CEU]), Table S3 (ORMLD3 [CEU]), Table S4 (GSDMB [YRI]), and Table S5 (ORMDL3 [YRI]).
Genome-wide Allelic Expression Measurements in CEU LCLs
Genome-wide AE measurements in 53 CEU LCLs and data from CEPH family 1420 was generated on the Illumina 1M BeadChips (B.G., D.K. Pokholok, T.K., E.G., L. Morcos, D.J.V., J. Le, V.K., K.C.L.L., V. Gagné, J.D., R.H., A. Montpetit, M.-M. Joly, E.J. Harvey, D.S., P. Beaulieu, R. Hamon, A. Graziani, K.D., E.H., J. Majewski, H.H.H. Göring, A.K.N., M. Blanchette, K.L. Gunderson, and T.P., unpublished data). In brief, Δ heterozygote ratios (Δ het ratios = het ratio in gDNA – het ratio in cDNA) in expressed SNPs were calculated for each transcript in the chromosome 17 region and the average Δ het ratios for any transcript with more than two expressed SNP in an individual were derived from phased chromosomes. The median Δ het ratios were converted to estimated fold-differences (Figure 2; Figure S1) via the formula (0.5 + Δ het ratio)/(0.5 − Δ het ratio). A regression-based statistic was used to map the AE phenotypes of the CEU LCLs to local SNPs (Figure 1D). Transcripts were considered to harbor common cis-variants if they could be significantly mapped to SNPs. Multiple testing in AE regression test for each locus was corrected for by requiring empirical (based on 10,000 permutations) significance of 0.005 or lower.
Figure 2.
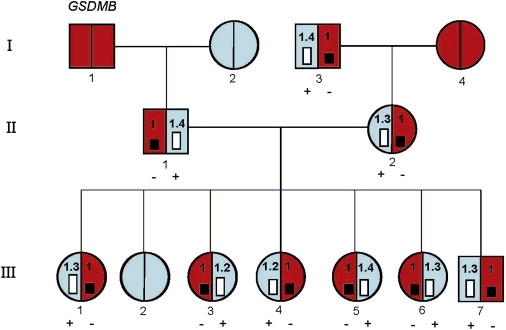
Transmission of AE Observed for GSDMB in the LCLs from CEPH Family 1420
Relative underexpression (−) or overexpression (+) is shown below the family member when data were available. The estimated fold differences between alleles, measured with the Illumina 1M BeadChip AE analysis (B.G., D.K. Pokholok, T.K., E.G., L. Morcos, D.J.V., J. Le, V.K., K.C.L.L., V. Gagné, J.D., R.H., A. Montpetit, M.-M. Joly, E.J. Harvey, D.S., P. Beaulieu, R. Hamon, A. Graziani, K.D., E.H., J. Majewski, H.H.H. Göring, A.K.N., M. Blanchette, K.L. Gunderson, and T.P., unpublished data), is shown in the bar graph for each family member. The red color represents the haplotype associated with underexpression of GSDMB (rs12936231>G) while the blue color represents the overexpressed-associated haplotype (rs12936231>C). The expression differences between the alleles are subtle, but are reproducible and correlate perfectly with what is expected based on population AE mapping.
Resequencing of the CEU Haplotype and Genotyping of Non-HapMap SNPs
To identify all genetic polymorphisms potentially responsible for the differences in allelic expression, the large CEU LD block (hg18, chr17:35179985-35339296) was resequenced with tiled long-range PCRs coupled with 454 GS-FLX sequencing (Roche, Quebec, Canada) in four individuals heterozygous for the overexpressed-associated haplotype (CEU, NA07056 and NA07345; YRI, NA18871 and NA18858) and demonstrating AE. Non-HapMap SNPs that were heterozygous in at least two of the four samples were determined by a novel SNP-calling algorithm (ProbHD).19 ProbHD provides a heterozygosity probability for each chromosomal position and allows the identification of preferentially amplified fragments and other poorly sequenced regions. In individual samples and with an average fold-coverage of 20×–50×, the de novo heterozygote detection has 5%–10% false-call rate and ∼90% sensitivity, but adding information across four samples allows for detection of shared heterozygous sites at 95% sensitivity with lower than 5% false call rate.19 Newly identified non-HapMap SNPs were genotyped in our panel of 30 CEU and 30 YRI HapMap trios15 with the Sequenom MassARRAY iPLEX Gold (Sequenom Inc., Newton, MA). If the Sequenom assay failed, the SNPs were genotyped by standard Sanger sequencing but only in the YRI panel. In total, 13 variants discovered in sequencing were tested (Table S7). All strong candidates (heterozygous in all four individuals included in large-scale sequencing) were among successfully genotyped sites (n = 10, 3 SNPs located in SINE repeats could not be typed by Sequenom or Sanger sequencing). Finally, the 160 kb region was also examined for potential insertions, deletions, and copy number variations with the Database of Genomic Variants.20
Expression Analysis by Quantitative Real-Time PCR
To evaluate the impact of the CEU AE-associated haplotype on the gene expression of IKZF3, ZPBP2, GSDMB, and ORMDL3, quantitative real-time PCR on a panel of 53 CEU LCLs was performed. PCR products from each pair of primers (Table S1) were tested by agarose gel electrophoresis to verify the presence of a single band of the predicted size. First-strand cDNA amplification was performed with the Applied Biosystems (ABI 7900HT) real-time PCR machine with the GeneAmp 7900HT sequence detection system software (PerkinElmer Corp., Foster City, CA), and the detection was made by measuring the binding of the fluorescence dye SYBR Green I to double-stranded DNA. PCR reactions were set up in 384-well plates in 10 μl volumes comprising 2 μl cDNA, 7.936 μl of Power SYBR Green PCR master mix 2× (Applied Biosystems), and 0.32 μM of gene-specific primers. The program was as follows: an initial step at 95°C (10 min) and then 40 cycles of 95°C (20 s), 58°C/60°C (30 s), and 72°C (45 s). The results were analyzed with the relative standard curve method. The mean and SD values for the technical triplicates were calculated, and the mean value was then normalized to the ribosomal protein 18S housekeeping gene (RPS18) mean to obtain the target-to-reference ratio. Linear regression analysis was performed with R, v2.8.0.21
Formaldehyde-Assisted Isolation of Regulatory Elements Assay
The formaldehyde-assisted isolation of regulatory elements (FAIRE) procedure was performed as described22 with some modifications. In brief, cells were fixed for 7 min with 1% formaldehyde and incubated for 5 min with 125 mM glycine. The cells were then collected at 2000 rpm (4 min, 4°C) and washed 3 times with 1× phosphate-buffered saline (PBS) containing 0.2 mM phenylmethylsulphonylfluoride (PMSF, EM). Cells were snap frozen in liquid nitrogen and stored at −80°C. The frozen cells were resuspended in lysis buffer containing protease inhibitors (1 μg/ml leupeptin, 1 μg/ml pepstatin, 2 μg/ml aprotinin, 0.2 μM PMSF) and homogenized. Samples were sonicated for 3 sessions of 30 pulses (1 s on/1 s off) with a Branson DIGITAL Sonifier UNITS (Models S-450D) at 15% amplitude to have a DNA fragment distribution between 1 kb and 300 bp. After removing cellular debris by centrifugation, a phenol-chloroform extraction was performed to recover the DNA. The DNA was quantified by a spectrophotometer and stored at −20°C.
To test for FAIRE enrichment of specific SNP regions, 200 to 500 ng of DNA was amplified by PCR. For each SNP, at least two heterozygous LCLs were tested. For SNP regions that showed FAIRE enrichment, normalized Sanger sequencing was done. FAIRE-treated DNA samples were compared to the input DNA samples and normalized allelic ratios were calculated.
MNAse Treatment
The nuclei from LCLs were prepared as described.23 A total of 25−30 × 106 nuclei were incubated with 10 U of MNase (Fermentas, Burlington, ON) for 10 min at 37°C. Digestion was stopped with 20 mM EDTA (pH 8.0). Chromatin fractions containing mononucleosomes and oligonucleosomes were purified, PCR amplified, and sequenced. Primers are shown in Table S1.
Native Chromatin Immunoprecipitation
Native chromatin fragments were prepared from fresh cell culture as described23 with some modifications. The nuclei were incubated in a dialysis buffer for 1 hr at 4°C on a rotating wheel. 30 μg of chromatin was incubated with 10 μg of commercial antibodies and then with 50 μl protein-G sepharose (GE Healthcare, Uppsala, Sweden) and washed. The DNA was purified and analyzed by quantitative PCR with a Rotor-Gene 6000 (Corbett Life Science, Montreal, QC). Specific antibodies for acetylated histone H3 (H3Ac), histone H3 methylated at lysine 9 (H3K9me3), and histone H4 trimethylated on lysine 27 (H3K27me3) were purchased from Upstate (Millipore, Temecula, CA).
Crosslinking Chromatin Immunoprecipitation Assay
Fresh LCL cultures were used. Formaldehyde (37% formaldehyde, 11% methanol, Fisher) was added directly to the flask (containing 40–50 × 106 cells) to a final concentration of 1% and incubated for 10 min at room temperature without shaking. To quench the formaldehyde, 125 mM of glycine was added to the fixed cells. Cells were collected at 1500 rpm for 4 min (4°C) and washed 3 times with 1× PBS containing protease inhibitors and sodium butyrate. Chromatin immunoprecipitations were performed as previously described24 with some modifications. Immunoprecipitation buffer contained 3 mM EDTA and 25 mM Tris-HCl (pH 8.0). Cells were sonicated for 3 sessions of 30 pulses (1 s on/1 s off) with Branson Sonifier at 15% amplitude. Cell debris was removed by centrifugation and aliquots of the supernatant were taken for quantification and verification of proper sonication while the remaining was stored at −80°C until use.
25 μg of chromatin was precleared with 50 μl of protein G sepharose (GE Healthcare, Uppsala, Sweden) and then incubated overnight at 4°C with 10 μg of commercial antibodies in immunoprecipitation buffer containing salmon sperm DNA (1 mg/ml final) and BSA (0.5 mg/ml final). 50 μl of protein G sepharose was added and the incubation continued for 4 hr. The chromatin complexes were sequentially washed in low salt, high salt, LiCl salt, and TE buffers. The protein/DNA complex was eluted in an SDS elution buffer (1% SDS, 50 mM Tris [pH 8.0], 10 mM EDTA). The crosslink between protein and DNA was reversed by treating the protein/DNA complex with Proteinase K. Finally, the DNA was purified with phenol-chloroform extractions. Specific antibodies for CTCF were purchased from Upstate (Millipore, Temecula, CA).
FAIRE and ChIP qPCR
For the quantitative real-time PCR (qPCR) assays, 20 ng of FAIRE-treated DNA, immunoprecipitated DNA, or input DNA were used. The qPCR was performed with 0.1 μM primers (Table S1) and 1× Power SYBR green PCR master mix (Applied Biosystems) on the Rotor-Gene 6000 (Corbett Life Science) machine. The program used was: 95°C for 10 min; 40 cycles of 95°C for 20 s, 55°C–60°C for 20–30 s; and 72°C for 45 s, followed by a melting step from 65°C to 95°C. Results were analyzed with the relative standard curve method with the Rotor-Gene 6000 series software.
Normalization of the rs12936231 FAIRE-enriched region was performed against the promoter of ORMDL3, which is also highly enriched in protein-free DNA and does not show a genotype effect (Figure S5).
For the ChIP assays, a series of controls were used to confirm antibody specificity and allele-specific effects: the promoter region of the imprinted small nuclear ribonucleoprotein polypeptide N (SNRPN) gene, which is known to carry parent-of-origin-specific chromatin modifications, the active nestin (NES) gene, and the inactive ribosomal protein large P1 (RPLP1) genes were used as controls for histone H3 modifications (Figure S2). The differentially methylated region of H19, known to bind CTCF,25 and the promoter region of SNRPN were used as controls for CTCF binding ChIP assays. The results were normalized to the input DNA.
In Vitro Transient Transfection Assays
To test for allelic activity, haplotype-specific constructs for rs12936231 (chr17:35282398-35282865), rs9303277 (chr17:35229745-35230240), rs8067378 (chr17:35304625-35305060), and rs7216389 (chr17:35323239-35324267) were subcloned into a pGL3 vector containing a firefly luciferase reporter gene either with or without an SV40 promoter (Promega) via a previously published method.26 All constructs were tested in five different human immortalized cell lines. The cervical cancer (HeLa), choriocarcinoma (Jeg3), hepatocellular liver carcinoma (HepG2), osteosarcoma (MG-63), and T cell lymphoblast-like (Jurkat) cell lines were transfected with lipofectamine 2000 according to the manufacturer's instructions (Invitrogen). To control for transfection efficiency, the measurement of the firefly luciferase was normalized to the measurement of the Renilla luciferase. Experiments were performed in quadruplicate, the activities of the two luciferases were measured 24 hr after transfection, and allelic haplotypes for each SNP were compared. Statistical significance (p value) was determined with an unpaired Student's t test.
Electrophoretic Mobility Shift Assay
EMSAs were carried out to test for allele-specific DNA-protein interactions on rs9303277, rs12936231, rs8067378, and rs7216389. For each SNP, double-stranded oligonucleotide probes corresponding to each allelic variant were radiolabeled and incubated in the presence of HeLa, HepG2, Jeg3, MG-63, or LCL (GM12815) cell nuclear extracts. In brief, protein was quantified with the Bradford protein assay (BioRad). Nuclear extracts (10 μg) were incubated with 35 fmol radiolabeled double-stranded DNA probes and with a buffer containing 50 mM Tris-HCl (pH 7.5), 5 mM MgCl2, 2.5 mM EDTA, 2.5 mM DTT, 250 mM NaCl, 0.25 μg/μl poly (deoxyinosinate-deoxycytidylate), and 20% glycerol in a total volume of 10 μl, for 20 min at room temperature. Complexes were separated on a nondenaturing 6% polyacrylamide gel (acrylamide-bisacrylamide, 37.5:1) in 1× Tris-glycine-EDTA buffer (190 V at 4°C). For binding competition, the EMSA was performed in the presence of a 50-fold molar excess of the unlabeled oligonucleotide probe, the unlabeled corresponding mutant probe, or a nonspecific DNA probe. Binding competitions were carried out by preincubating nuclear extracts in binding buffer for 10 min at room temperature, followed by a 20 min incubation at room temperature with a radiolabeled double-stranded DNA probe.
Genetic Association Studies in Asthma
Genetic association testing was performed in three family-based childhood asthma cohorts: The Childhood Asthma Management Program (CAMP),27,28 the Genetic Epidemiology of Asthma in Costa Rica cohort,29 and the Saguenay-Lac-Saint-Jean (SLSJ) asthmatic familial collection. CAMP is a multicenter, randomized, double-blind, placebo-controlled trial to investigate the long-term effects of inhaled anti-inflammatory medication. Of the 1041 children randomized in the clinical trial, 968 children and 1518 of their parents contributed DNA samples as part of the genetic ancillary study of CAMP. DNA was sufficient for 503 probands and parents for 470 nuclear families of self-reported non-Hispanic white ancestry studied previously.30 Asthma was defined by a doctor diagnosis in conjunction with objective evidence of airway hyperresponsiveness as defined by a methacholine PC20 of 12 mg/dl or less, and at least one of the following for at least 6 months in the year before recruitment: (1) asthma symptoms at least two times per week, (2) at least two uses per week of an inhaled bronchodilator, or (3) daily asthma medication use. The Costa Rica cohort consists of 412 parent-child trios recruited through asthmatic children ages 6 to 14 years. Children were included in the study if they had asthma (a physician's diagnosis of asthma and ≥2 respiratory symptoms or asthma attacks in the previous year) and a high probability of having ≥6 great-grandparents born in the Central Valley of Costa Rica.31 The SLSJ asthmatic familial collection comprises 253 asthmatic probands and their relatives for a total of 1275 subjects. A proportion of 36.6% of relatives are affected by asthma. Participants were defined as having asthma if (1) they had a reported history of asthma (validated by a physician), or (2) they showed asthma-related symptoms and a positive PC20 (provocative concentration causing a 20% drop in FEV1 [PC20] < 8 mg/ml32) at the time of recruitment. Approval was obtained from the Institutional Review Boards of Brigham and Women's Hospital (Boston, MA), the Hospital Nacional de Niños (San José, Costa Rica), the Centre de Santé et de Services Sociaux de Chicoutimi, and each of the CAMP-participating institutions. Informed consent was obtained from parents of participating children, and the child's assent was obtained prior to study enrollment.
SNP genotyping was performed with the MassArray IPlex Gold genotyping platform (Sequenom Inc) or TaqMan SNP Genotyping Assays (Applied Biosystems). Genotype data quality was assessed by genotype completion rates, discordance in the duplicate genotyping, and evidence of Mendelian inconsistencies.33 Family-based association tests (FBAT) with asthma affection status were conducted with the transmission disequilibrium test34 as implemented in Haploview or via the FBAT software (Version 1.7) under an additive model with the empirical variance estimator “-e.”35 The number of effective independent SNPs was evaluated and after factoring in specific criteria (use of one phenotype, one genetic model, and 1.67 effective SNPs), we fixed the significance threshold at 0.030 to keep the type I error rate at a 5% level.36
Results
Allelic Expression Mapping in the Chromosome 17q12-q21 Region
To specifically interrogate the role of cis-regulatory variation across the chromosome 17 region, we carried out detailed analysis of the genome-wide AE data generated by the Illumina 1M BeadChip Array (B.G., D.K. Pokholok, T.K., E.G., L. Morcos, D.J.V., J. Le, V.K., K.C.L.L., V. Gagné, J.D., R.H., A. Montpetit, M.-M. Joly, E.J. Harvey, D.S., P. Beaulieu, R. Hamon, A. Graziani, K.D., E.H., J. Majewski, H.H.H. Göring, A.K.N., M. Blanchette, K.L. Gunderson, and T.P., unpublished data) with the HapMap CEU LCLs. The allelic expression signal was strong for GSDMB and was observed in 31 of 32 heterozygous individuals, whereas ORMDL3 (AE in 22/31) and the intergenic region downstream of GSDMB (AE in 20/28) showed moderate allele-specific expression (Figure 1D). The ZPBP2 gene also showed nominal AE association but did not reach 0.005 permutations significance level used to account for multiple testing in the previous genome-wide screen of AE (Figure 1D) (B.G., D.K. Pokholok, T.K., E.G., L. Morcos, D.J.V., J. Le, V.K., K.C.L.L., V. Gagné, J.D., R.H., A. Montpetit, M.-M. Joly, E.J. Harvey, D.S., P. Beaulieu, R. Hamon, A. Graziani, K.D., E.H., J. Majewski, H.H.H. Göring, A.K.N., M. Blanchette, K.L. Gunderson, and T.P., unpublished data). An individual assayed at a heterozygous intragenic SNP may not show AE of the gene tested if that individual is homozygous at the causative SNP or if other external factors are confounding the results. Furthermore, all of these genes show Mendelian transmission of the AE phenotype (Figure 2; Figure S1). The other genes (IKZF3, GSDMA, and PSMD3) and intergenic regions did not show any common AE (Figure 1D). Of these, we have previously validated the AE in ORMDL3 and GSDMB via normalized Sanger sequencing in CEU LCL samples.12 From the 32 and 29 CEU LCLs that showed AE for GSDMB and ORMDL3, respectively, we generated maps of SNPs associated with AE12 with the phased genotype information for each HapMap sample (Figure 1E; Table S2 for GSDMB and Table S3 for ORMLD3). We note that although each gene has multiple isoforms, differential expression of transcript isoforms was not detected in a previous study via the Affymetrix exon array in the CEU HapMap population,37 suggesting a minimal impact of the different isoforms on the AE signals observed. In addition, total transcript levels based on metaprobeset associations in the Affymetrix exon array as well as arrays measuring gene expression at different sites for the transcripts (U133 and Illumina) show results concordant with our data for GSDMB and ORMDL3 (B.G., D.K. Pokholok, T.K., E.G., L. Morcos, D.J.V., J. Le, V.K., K.C.L.L., V. Gagné, J.D., R.H., A. Montpetit, M.-M. Joly, E.J. Harvey, D.S., P. Beaulieu, R. Hamon, A. Graziani, K.D., E.H., J. Majewski, H.H.H. Göring, A.K.N., M. Blanchette, K.L. Gunderson, and T.P., unpublished data).13,37 Furthermore, the AE measurements primarily target nonspliced primary transcripts and their results are supported by in-house qRT-PCR experiments as well as independent expression array data targeting measurement of transcript levels.4,13
Haplotype-based analysis of the GSDMB and ORMDL3 fine-mapping data revealed a common haplotype associated with an increase in gene expression (Tables S2 and S3). This haplotype is delineated by rs907091 and rs12603332 (stars in Figure 1E) and contains 15 SNPs that are equally strongly associated with AE (p = 1.09 × 10⁻¹⁸) (Table 1).
Table 1.
Allelic Expression-Associated SNPs Found within the 160 kb CEU Haplotype on Chromosome 17
| GSDMB CEUa AE p Value | GSDMB YRIb AE p Value | SNP | Chromosomal Location | Genic Location | Overexpressed CEU Haplotype | FAIRE Enrichment | Allelic Effect (un/ov) |
|---|---|---|---|---|---|---|---|
| 1.09 × 10⁻¹⁸ | 4.95 × 10⁻⁷ | rs907091 | 35175268 | IKZF3 | T | + | nt |
| 3.01 × 10⁻¹² | 1.0 | rs907092c | 35175785 | IKZF3 | G | nt | nt |
| 1.09 × 10⁻¹⁸ | 2.39 × 10⁻⁸ | rs9303277 | 35229995 | IKZF3 | C | ++ | 1.91 |
| 0.0127 | 1.0 | rs2060941 | 35236409 | IKZF3 | G | + | 0.98 |
| 3.60 × 10⁻¹⁷ | 2.39 × 10⁻⁸ | rs3816470 | 35239327 | IKZF3 | A | + | 1.17 |
| 3.01 × 10⁻¹² | 0.6651 | rs4795397 | 35277271 | intergenic | A | +++ | 1.61 |
| 2.46 × 10−06 | 1.0 | rs12150079 | 35278943 | ZPBP2 | G | ++ | 1.17 |
| 1.09 × 10⁻¹⁸ | 2.26 × 10⁻⁴ | rs11557467 | 35282160 | ZPBP2 | G | + | 0.91 |
| 1.09 × 10⁻¹⁸ | 4.26 × 10⁻⁹ | rs12936231 | 35282646 | ZPBP2 | Cd | +++ | 3.69 |
| 3.01 × 10⁻¹² | 0.0017 | rs2872507e | 35294289 | intergenic | Gd | nt | nt |
| 1.09 × 10⁻¹⁸ | 7.54 × 10⁻⁵ | rs9901146 | 35296869 | intergenic | Gd | + | nt |
| 1.09 × 10⁻¹⁸ | 7.54 × 10⁻⁵ | rs12950743 | 35302759 | intergenic | Td | − | nt |
| 3.60 × 10⁻¹⁷ | 6.34 × 10⁻⁴ | rs7359623 | 35303115 | intergenic | Cd | +/− | nt |
| 1.09 × 10⁻¹⁸ | 4.26 × 10⁻⁹ | rs8067378 | 35304874 | intergenic | Ad | + | 0.85 |
| 1.09 × 10⁻¹⁸ | 0.346 | rs2305479 | 35315743 | GSDMB | C | nt | nt |
| 1.09 × 10⁻¹⁸ | 3.77 × 10⁻⁷ | rs2290400f | 35319766 | GSDMB | T | + | nt |
| 1.09 × 10⁻¹⁸ | 2.26 × 10⁻⁴ | rs1008723 | 35319793 | GSDMB | G | + | nt |
| 1.09 × 10⁻¹⁸ | 0.233 | rs869402 | 35321569 | GSDMB | C | nt | nt |
| 1.09 × 10⁻¹⁸ | 3.76 × 10⁻³ | rs1011082g | 35322040 | GSDMB | G | + | nt |
| 1.09 × 10⁻¹⁸ | 0.243 | rs7216389h | 35323475 | GSDMB | T | ++ | 1.21 |
| 1.09 × 10⁻¹⁸ | 7.96 × 10⁻⁵ | rs7216558g | 35323597 | GSDMB | T | + | nt |
| 1.09 × 10⁻¹⁸ | 1.98 × 10⁻⁵ | rs9303281 | 35327572 | GSDMB | A | +/− | nt |
| 1.09 × 10⁻¹⁸ | 7.96 × 10⁻⁵ | rs7219923 | 35328044 | GSDMB | T | + | nt |
| 1.09 × 10⁻¹⁸ | 7.96 × 10⁻⁵ | rs7224129 | 35328952 | intergenic | A | + | nt |
| 7.14 × 10⁻¹⁵ | 1.0 | rs4378650h | 35334391 | ORMDL3 | G | − | nt |
| 6.12 × 10⁻¹⁶ | 0.0058 | rs12603332h | 35336333 | ORMDL3 | C | + | nt |
Allelic effect defined as the ratio of alleles in FAIRE-enriched samples normalized to the ratio of alleles in the input is shown. These values are based on measurements of sequencing chromatograms and indicate the departure from equal ratio.
Abbreviations: nt, not tested; un/ov, underexpressed/overexpressed haplotype; +/−, relative quantity of PCR product visualized on agarose gel.
Fisher's exact test p values generated from 32 CEU LCLs.
Fisher's exact test p values generated from 21 YRI LCLs.
Primary biliary cirrhosis-associated SNP.
22 kb YRI haplotype.
Crohn disease-associated SNP.
Type I diabetes.
Non-HapMap SNP.
Asthma-associated SNPs.
The strong LD among the common SNPs associated with AE in the CEU did not allow further delineation of the causal variant(s). Consequently, we tested GSDMB and ORMDL3 for AE in a second LCL population, the YRI,15 because the large LD block observed in the CEU population (Figure 1G) is broken up into smaller LD blocks in the YRI population (Figure 1H). Differential AE was found in 10 of 36 heterozygous YRI individuals for ORMDL3 and in 21 of 32 heterozygous YRI individuals for GSDMB. Again, maps of AE-associated SNPs were generated for GSDMB and ORMDL3 with the phased genotype data available for the HapMap YRI LCL samples (Figure 1F; Tables S4 and S5). To account for multiple testing in each locus, permutation tests (n = 100,000) were carried out and locus-wide empirical significances of allelic expression associations for GSDMB and ORMDL3 by Fisher's exact test were derived: in the CEU data set, both genes were associated to AE at Pperm < 1 × 10⁻⁵, and in the YRI data set, GSDMB was associated at Pperm < 1 × 10⁻⁵ whereas ORMDL3 did not reach significance (Pperm < 0.5). Overall, the overlap of the AE-associated SNPs between the CEU and YRI suggested that a SNP(s) common among the two populations may be the cause of the AE observed.
Haplotype analysis of the YRI GSDMB AE data revealed a 22 kb segment of the CEU haplotype, bound by rs12936231 and rs8067378 (stars in Figure 1F), that is also associated (p = 4.26 × 10⁻⁹) with higher expression of GSDMB (Table 1; Table S4). We primarily focused our efforts to the 22 kb region showing the top associations in YRI but note that there are additional SNPs that are strongly associated with AE in the YRI samples as well (Table 1). In the CEU population, the originally suggested functional SNP (rs7216389)4 is strongly associated with AE (p = 1.09 × 10⁻¹⁸). However, in the YRI population, rs7216389 is not in strong LD with AE-associating SNPs and is not linked to AE (p = 0.243), excluding it as a causal candidate for the AE observed across populations. The best functional candidate based on evolutionary sequence conservation (28-way Vertebrate Multiz alignment)38 among the AE-associated SNPs is rs12936231, which lies in a conserved 50 bp block, with the G allele being conserved across mammalian species. None of the other SNPs with strong AE association observed in both YRI and CEU (rs8067378, rs9303277, rs3816470, rs2290400, and rs907091) showed significant conservation.
To identify all the possible genetic variants that may potentially be involved in the regulation of AE, the 160 kb CEU haplotype was tiled with long-range PCR amplicons for four individuals (2 CEU and 2 YRI) carrying the common AE-associated haplotype and resequenced with a high-throughput 454 GS-FLX sequencer. Within the 160 kb interval, 13 SNPs previously not genotyped by HapMap and showing heterozygosity in two of the four samples with differential AE were considered as candidate sites. These SNPs were subsequently genotyped in either our CEU and YRI panels or our YRI panel only, phased within the sample set, and tested for AE association (r2 values for these SNPs with rs12936231 can be found in Table S7). Two of these SNPs (rs1011082 and rs7216558) were found to be strongly associated with AE in the CEU population (p = 1.09 × 10⁻¹⁸) but not as strongly in the YRI population (p = 3.76 × 10⁻³–7.96 × 10⁻⁵) (Table 1). The sensitivity of our algorithm for detecting heterozygous SNPs in our samples for known polymorphisms is 98.5%,19 and our results suggest that nearly all candidate variants were identified. However, we were not able to genotype three SNPs that lay in SINE repeat elements, and both Sequenom assay and Sanger sequencing failed. These SNPs were not predicted to be heterozygous in all sequenced samples, so we note that they are less likely to be strongly associated with AE (Table S7). In addition, no heterozygous insertions, deletions, or copy number variations were detected within the 160 kb resequenced haplotype or identified through the Database of Genomic Variants,20 suggesting that differences in allele-specific expression must result from the effect of a single SNP or the combination of multiple SNPs.
To validate the effect of the overexpressed-associated haplotype on the gene expression of GSDMB, ORMDL3, ZPBP2, and IKZF3, quantitative real-time PCRs were performed on a panel of 53 CEU LCL samples. As expected, the expression correlation against the common CEU overexpressed-associated haplotype (AA = 9, AB = 32, BB = 12, where A represents the CEU haplotype associated with overexpression of GSDMB and B is any other haplotype) showed that individuals that are homozygous for the overexpressed-associated haplotype (AA) have a significant increase in GSDMB (p = 2.75 × 10⁻⁵) and ORMDL3 (p = 0.00388) and lower ZPBP2 (p = 0.00371) mRNA levels, relative to individuals that do not carry the overexpressed-associated haplotype (BB) (Figure 3). IKZF3 expression was not correlated with the overexpressed-associated haplotype (p = 0.87068).
Figure 3.
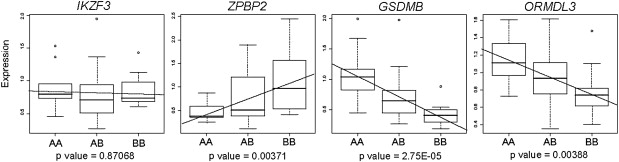
Quantitative Real-Time PCR Results for IKZF3, ZPBP2, GSDMB, and ORMDL3 Performed in 53 CEU LCLs, All Normalized for 18S and Correlated with the Common CEU Overexpressed-Associated Haplotype
“A” represents the CEU haplotype associated with the overexpression of GSDMB and “B” is any other haplotype (AA = 9, AB = 32, BB = 12). Error bars were calculated by the mean ± SD for each genotype.
Identification of the Causal cis-Regulatory Variant(s)
Three different approaches were used to assess the functional potential of the AE-associated SNPs: all CEU AE-associated SNPs were tested for allele-specific chromatin differences in vivo, additionally the top three AE-associated SNPs (rs12936231, rs9303277, and rs8067378) observed in both the CEU and YRI populations as well as the original asthma-associated SNP (rs7216369) were tested for their regulatory potential and allele-specific DNA-protein interactions in vitro.
Given that the 17q12 haplotype affects the expression of multiple transcripts, we hypothesized that genetic variation in this region might influence chromatin states and alter gene regulation in a domain-wide manner. To test for this possibility, we screened all the SNPs that were strongly associated with AE in the CEU population to detect allele-specific differences in chromatin states with the formaldehyde-assisted isolation of regulatory elements (FAIRE) assay combined with PCR and Sanger sequencing. Like the DNase I hypersensitivity assay, FAIRE detects DNA regions that are devoid of nucleosomes and that often contain regulatory elements.22,39 Overall, 16 AE-associated SNPs, 3 asthma-associated SNPs, and 3 control SNPs were tested for FAIRE enrichment in at least two heterozygous cell lines (Table 1). Only two of the SNPs showed high FAIRE enrichment (rs4795397 and rs12936231) denoted as +++ in Table 1, but only rs12936231 showed a robust, allele-specific FAIRE enrichment in all eight heterozygous cell lines tested (Figure 4A). The rs12936231 G allele was consistently overrepresented in the FAIRE-enriched fraction (G/C ratio 3.69). To validate the FAIRE results, the rs12936231 region was tested for the presence of nucleosome-free DNA with MNase treatment in five heterozygous cell lines. This region showed a strong allele-specific MNase sensitivity, with the G allele being preferentially digested by MNase (Figure 4A). The genotype effect of rs12936231 on the FAIRE enrichment was then tested by quantitative PCR experiments (Figure 4B). LCL samples homozygous for the C allele consistently showed a low level of FAIRE enrichment in contrast to the two other genotypes. Therefore, independent approaches suggest that the two alleles of the rs12936231 SNP have a different association with nucleosomes.
Figure 4.
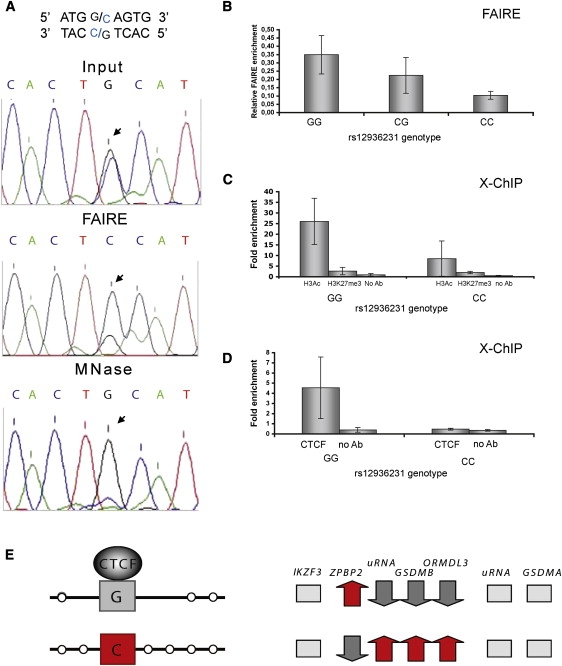
Allele-Specific Chromatin Effects in the rs12936231 Region
(A) Sequencing assay to detect allele-specific FAIRE enrichment and micrococcal nuclease (MNase) sensitivity. The negative strand of the rs12936231 region is shown and the position of the SNP is indicated by an arrow.
(B) Genotype effect on FAIRE enrichment for rs12936231, qPCR results on FAIRE-treated LCLs (GG = 4, CG = 7, CC = 3).
(C) Association of the rs12936231 alleles with active and inactive chromatin marks as determined by X-ChIP qPCR assays (GG = 4 and CC = 4).
(D) Allele-specific CTCF binding detected by X-ChIP qPCR assay in homozygous GG (n = 4) and CC (n = 4) LCLs.
For (B), (C), and (D), the error bars were calculated with the mean ± SD for each genotype.
(E) Summary diagram for the allele-specific chromatin conformation in the rs12936231 region (left) and gene expression (right) in the ZPBP2-ORMDL3 region.
The rs12936231 SNP showed in vivo differences in its chromatin distribution, so follow-up studies were carried out. Allele-specific gene expression has been associated with different modifications of histone tails on active and silent alleles;23,40,41 therefore, the association of the rs12936231 region with H3Ac (active chromatin mark) and H3K9me3 or H3K27me3 (marks of inactive chromatin) via native ChIP (N-ChIP) and crosslinking ChIP (X-ChIP) assays was tested. In this study, the N-ChIP data provides information about the allele that resists MNase digestion (i.e., the C allele), whereas the X-ChIP characterizes both alleles. Both assays showed that the rs12936231 DNA region is associated with active chromatin marks in homozygous individuals of either genotype (Figure 4C; Figure S2). Although better enrichment with the active histone mark H3Ac is found on the G allele, the difference failed to reach statistical significance.
About 70% of ubiquitous distal (≥2 kb from the transcriptional start site) DNase I hypersensitive sites are associated with the CCTC binding protein CTCF.42 Furthermore, rs12936231 variants alter the sequence of putative binding sites for CTCF25,43 and p300 (Figure S3). CTCF is a well-characterized protein involved in chromatin looping and is known to reposition nucleosomes.44,45 Therefore, we assayed the allele-specific association of rs12936231 with CTCF in LCLs that were homozygous for the G or the C allele via X-ChIP assays. The results indicate that the G allele is CTCF enriched compared to the C allele (Figure 4D). We note that the CTCF binding to this region was recently independently demonstrated by ENCODE46 ChIP sequencing showing LCL-specific CTCF-ChIP-seq. peak centered on the rs12936231 SNP (Figure S4).
Converging lines of functional data show that the rs12936231 explains, in part, the allele-specific differences observed in the transcription of ZPBP2, GSDMB, and ORMDL3. The G allele of the rs12936231, which is associated with lower GSDMB and ORMDL3 and higher ZPBP2 expression, is mostly devoid of nucleosomes, but associated with CTCF. In contrast, the C allele, which is associated with higher ORMDL3 and GSDMB and lower ZPBP2 expression, is not enriched with CTCF.
In parallel with in vivo analyses of expression and chromatin activity, we carried out in vitro analyses of candidate SNPs. The regulatory potential of the three SNPs most strongly associated with AE (rs9303277, rs12936231, and rs8067378) as well as rs7216369 was tested by transient transfection assays in five immortalized cell types: cervical cancer (HeLa), hepatocellular carcinoma (HepG2), choriocarcinoma (Jeg3), osteosarcoma (MG-63), and CD4+ T cell leukemia (Jurkat). Allele-specific constructs for each SNP were tested with an SV40 minimal promoter-containing vector (enhancer activity) and a pGL3 basic vector (promoter activity). Only the pGL3 construct containing the rs12936231 showed significant allele-specific differences in promoter activity (p < 0.01), which was seen in four cell lines (HeLa, Jeg3, HepG2, MG-63) (Figure 5). The increase in activity was observed for the G allele but only when the construct was in an antisense orientation (when referenced to GSDMB/ORMDL3 orientation). Slight cell-type-specific enhancer activity was observed for rs9303277 and rs12936231 but not in an allele-specific manner (all data, including constructs for the GSDMB and ORMDL3 promoters, can be found on the GRiD website).
Figure 5.
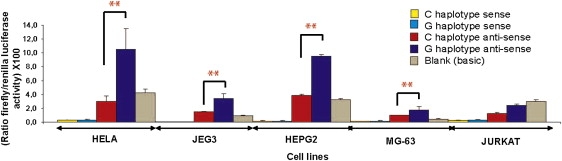
Gene Reporter Assays for Promoter Haplotypes Carrying the rs12936231 Region
Relative luciferase activity of the promoter haplotypes was measured after transient transfection in five different cell lines. Each haplotype was transfected in both sense and antisense and performed in quadruplicates (mean ± SD). The empty promoterless pGL3-Basic vector was used as a negative control. ∗∗p < 0.01.
Finally, these same candidate SNPs were also assayed to determine allele-specific DNA-protein interactions via electrophoretic mobility shift assays (EMSA) in nuclear extracts from LCLs. The cell specificity of the binding was tested in four additional immortalized cancer cell types: HeLa, HepG2, Jeg3, and MG-63. Of the four SNPs tested, only rs8067378 showed allele-specific differences for DNA-protein interactions in LCLs (Figure 6). Allele-specific differences for rs8067378 in protein binding were also found in all other cell lines. All EMSA results can be found in Figure S6.
Figure 6.
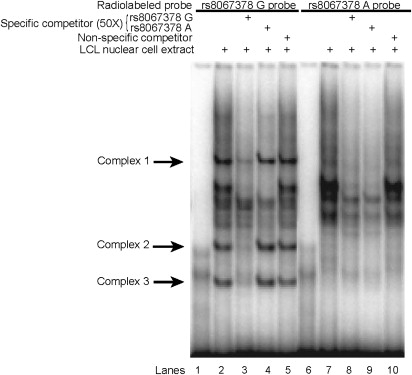
Positive EMSA Analyses Showing Allelic DNA-Protein Interactions for SNP rs8067378G>A in LCLs
The unlabeled probes used to complete DNA-protein interactions are indicated (+) at the top of each lane. Specific competitors corresponding to the unlabeled allele-specific probes were used in lanes 3, 4, 8, and 9 and a nonspecific competitor was used in lanes 5 and 10. The three predominant allele-specific DNA-protein complexes are indicated by arrows. All other cell types tested showed similarly strong allele-specific effects for this SNP, whereas none of the other SNPs yielded consistently strong EMSA signals (Figure S6).
Functional Haplotype and Risk of Asthma
The relationship of the rs12936231 SNP with asthma susceptibility has not been previously assessed. Therefore, we pursued association studies for our top functional candidate SNP (rs12936231), three other SNPs (rs8067378, rs9303277, and rs3816470) occurring in the same CEU haplotype, and the asthma-associated rs7216389 SNP.4 The association studies were carried out in three independent family-based asthma cohorts. All four candidate AE-associated SNPs demonstrated significant evidence for association (α < 0.03 in individual cohorts,36 p = 8.74 × 10⁻⁷–4.95 × 10⁻⁸ by Fisher combined test) in each of the cohorts, and haplotype association analysis confirmed a strong association of the overexpressed-associated haplotype with asthma risk (p = 8.62 × 10⁻⁸; Tables 2 and 3). We note that despite varying statistical significance of the associations across cohorts, the observed transmission disequilibrium levels were similar (transmitted to nontransmitted ratios for rs12936231 is 1.44 in Costa Rica, 1.27 in CAMP, and 1.61 in the SLSJ asthmatic familial collection), suggesting that the observed differences in p values are due to differences in the number of informative families in each study. The strong LD between these markers in the populations tested precludes preferential recognition of one variant over the others as the definitive risk locus, because the combined evidence for association was very similar across markers (Fisher's combined p values of 4.95 × 10⁻⁸ for rs9303277 and 8.74 × 10⁻⁷ for rs12936231). We note, however, that the allelic associations at these markers are slightly stronger than those observed for the previously suggested causal variant (rs7216389 Fisher's combined p value p = 3.04 × 10⁻⁶).
Table 2.
TDT Results for Polymorphisms Located in the 17q12 Region in Three Asthma Cohorts
| SNP | Risk Allele | Costa Rican Hispanic |
CAMP Non-Hispanic White |
SLSJ Asthmatic Familial Collection (White) |
Fisher's Combined Test |
||||||||||
|---|---|---|---|---|---|---|---|---|---|---|---|---|---|---|---|
| Trio # | T:U | χ2 | p Value | Trio # | T:U | χ2 | p Value | Trio # | S:E(S) | Z Score | p Value | χ2 | p Value | ||
| rs9303277 | C | 275 | 294:198 | 18.7 | 1.50 × 10⁻⁵ | 444 | 293:227 | 8.4 | 0.004 | 134 | 306:278 | 3.0 | 0.003 | 44.9 | 4.95 × 10⁻⁸ |
| rs3816470 | A | 261 | 278:191 | 16.1 | 5.89 × 10⁻⁵ | 412 | 287:228 | 6.8 | 0.009 | 157 | 335:312 | 2.3 | 0.024 | 36.4 | 2.34 × 10⁻⁶ |
| rs12936231 | C | 278 | 294:204 | 16.3 | 5.51 × 10⁻⁵ | 449 | 285:224 | 7.3 | 0.007 | 136 | 300:276 | 2.5 | 0.011 | 38.6 | 8.74 × 10⁻⁷ |
| rs8067378 | A | 280 | 301:201 | 19.9 | 8.07 × 10⁻⁶ | 436 | 286:225 | 7.3 | 0.007 | 152 | 333:308 | 2.4 | 0.015 | 41.8 | 2.03 × 10⁻⁷ |
| rs7216389 | T | 382 | 299:200 | 19.6 | 9.32 × 10⁻⁶ | 278 | 202:173 | 2.24 | 0.130 | 154 | 300:276 | 2.4 | 0.0146 | 35.8 | 3.04 × 10⁻⁶ |
T:U denotes ratio of transmitted to untransmitted risk alleles; S denotes association test statistic and E(S) is the expected statistic. Fisher's combined p value calculated for k number of p values by χ2 = −2∑loge(p valuek) with 2k degrees of freedom.
Table 3.
Haplotypic TDT Results for the Four SNP Haplotypes Located in the 17q12 Region in Two Asthma Cohorts
| Haplotypea | Costa Rican Hispanic |
CAMP Non-Hispanic White |
SLSJ Asthmatic Familial Collection, White |
Fisher's Combined Test |
|||||||||||||
|---|---|---|---|---|---|---|---|---|---|---|---|---|---|---|---|---|---|
| Trio # | Haplotype Frequency | T:U | χ2 | p Value | Trio # | Haplotype Frequency | T:U | χ2 | p Value | Trio # | Haplotype Frequency | S:E(S) | Z Score | p Value | χ2 | p Value | |
| C:A:C:A | 290 | 0.58 | 302:201 | 20.3 | 6.60x10⁻⁶ | 337 | 0.50 | 356:284 | 8.0 | 0.005 | 180 | 0.58 | 317:292 | 2.6 | 0.010 | 43.6 | 8.62x10⁻⁸ |
| T:G:G:G | 287 | 0.39 | 196:297 | 20.5 | 5.90X10⁻⁶ | 326 | 0.44 | 278:349 | 8.0 | 0.005 | 178 | 0.37 | 191:221 | −3.1 | 0.002 | 47.1 | 1.78x10⁻⁸ |
| C:G:C:A | N/A | N/A | N/A | N/A | 51 | 0.03 | 34:30 | 0.3 | 0.574 | 30 | 0.04 | 26:24 | 0.6 | 0.538 | - | ||
| T:G:C:A | N/A | N/A | N/A | N/A | 30 | 0.02 | 21:18 | 0.3 | 0.582 | N/A | N/A | N/A | N/A | - | |||
| C:G:G:G | 44 | 0.02 | 22:26 | 0.3 | 0.615 | N/A | N/A | N/A | N/A | N/A | N/A | N/A | N/A | - | |||
| Omnibus haplotype testb | 0.002 | 0.02 | 0.054 | 26.1 | 0.0002 | ||||||||||||
T:U denotes ratio of transmitted to untransmitted risk alleles; S denotes association test statistic and E(S) is the expected statistic. Data presented for haplotypes present in ≥1% of the population. Fisher's combined p value calculated for k number of p values by χ2 = −2∑loge(p valuek) with 2k degrees of freedom.
rs9303277:rs3816470:rs12936231:rs8067378.
Statistic implemented in PBAT v3.6.
Discussion
Clinical association data for common complex disease susceptibility often have, as in the case of the 17q12 associations, relatively modest odds ratio (OR).4,9–11 This inherently limits the power of a study in mapping causal variants: small changes in the OR by closely linked SNPs in LD would require very large cohorts. One strategy utilized for strong disease associations (e.g., TCF7L2 for type 2 diabetes) is to carry out mapping in patient cohorts that are genetically more diverse to exploit population-specific differences in LD, which may allow more efficient fine-mapping.47 It has also been suggested that cellular phenotypes could be used as a tool for dissecting disease variation.48 So far, the only functional link of the LD block associated with asthma and autoimmune diseases has been altered gene regulation in the 17q12-q21 locus observed in human lymphoblastoid cells.4,9,14 Allelic expression, as we have previously shown for thousands of cis-regulated genes, can segregate in a Mendelian fashion (B.G., D.K. Pokholok, T.K., E.G., L. Morcos, D.J.V., J. Le, V.K., K.C.L.L., V. Gagné, J.D., R.H., A. Montpetit, M.-M. Joly, E.J. Harvey, D.S., P. Beaulieu, R. Hamon, A. Graziani, K.D., E.H., J. Majewski, H.H.H. Göring, A.K.N., M. Blanchette, K.L. Gunderson, and T.P., unpublished data), and we can demonstrate transmission of AE phenotypes with the asthma-associated haplotype (Figure 2; Figure S1). The heritable cis-variants also largely explain (r2 = 0.97) the population variation in AE in the CEU, and although unidentified rare variants may also have an effect on the AE observed, the effect sizes are predicted to be small. The large effect sizes combined with interethnic fine-mapping allow us to formulate specific hypotheses on the causal cis-regulatory SNPs in the locus. Although expression and AE phenotypes have been shown to overlap GWAS hits in multiple earlier studies, this study is the first one to our knowledge with systematic functional follow-up for pinpointing the causal variant(s).
We demonstrate that the genetic variants associated with asthma and autoimmune disease act over a large genomic region and affect the expression of not one but several transcripts. We suggest that rs12936231 is part of a regulatory region that governs the transcriptional activity of at least three genes (ZPBP2, GSDMB, and ORMDL3) in the chromosome 17q12-q21 region and that it is one of the leading functional candidates explaining the phenotypic association with asthma. A trans-based expression analysis using the ingenuity pathway analysis (IPA) of the rs12936231 SNP via public data sets13,37 revealed no reproducible effect on other genes or pathways (Table S6). The allele-specific protein-DNA interactions detected for rs8067378 along with converging AE-mapping results in the two populations may be a modifier of cis-regulation. We note that although functional SNPs in the 22 kb shared haplotype provide the best parsimonious explanation for heritable variation in gene regulation in both population at the 17q12-q21 locus, it is clear that either local haplotype (other cis-acting SNPs) or trans-acting differences between the populations may modulate this effect, as indicated by the fact that the ORMDL3 association in the YRI is significantly weaker and the magnitude of the AE in GSDMB is larger in the CEU. To refine our understanding of the underlying molecular mechanism, further work, such as isolation of the differentially binding proteins at the rs12936231 and rs8067378 regions, mapping of the chromatin loops and in vivo validation of our hypotheses using large insert (i.e., BAC) reporter gene constructs in transgenic mice are called for.
Typical of clinical association data, the resolution of mapping in this strong LD region does not allow dissection of the effect of an individual SNP on asthma risk. This is not unexpected given the odds ratio reported for asthma association (<1.5),4 which would require thousands of samples in a resequencing study to detect causal variant among closely linked SNPs (M.S., J. Chicoine, D. Serre, T.P., and R. Sladek, unpublished simulation studies). On the other hand, the allelic expression trait at GSDMB is almost completely explained by the associated SNPs, and the large effect size renders fine-mapping of the cellular trait feasible even in small sample sizes, as expected.49 Nevertheless, the best functional SNPs delineated in this study could clearly explain the asthma association as well as show strong LD with CD-, T1D-, and PBC-associated variants.9–11 If the causal SNPs exert population independent risks for these traits, an interethnic fine-mapping strategy could further resolve the issue of marginal effects explained by SNPs versus haplotypic effects.
The effect of genetic variation, including SNPs, on the transcription of multiple genes residing in the same chromosomal domain has been documented in sheep, mice, and humans (B.G., D.K. Pokholok, T.K., E.G., L. Morcos, D.J.V., J. Le, V.K., K.C.L.L., V. Gagné, J.D., R.H., A. Montpetit, M.-M. Joly, E.J. Harvey, D.S., P. Beaulieu, R. Hamon, A. Graziani, K.D., E.H., J. Majewski, H.H.H. Göring, A.K.N., M. Blanchette, K.L. Gunderson, and T.P., unpublished data50–52 and reviewed in 53), and its role in determining epigenetic states has also been demonstrated in genome-wide studies.54 Our work provides another example of the influence of a common genetic variant on chromatin states and, to our knowledge, is the first report of a SNP that affects nucleosome positioning and CTCF binding in cis and that is also linked to common complex trait susceptibility in humans.
CTCF is the only known insulator protein in mammals (reviewed in 55,56). Its binding to insulator DNA elements may block enhancers from activating their target genes via formation of chromatin loops, thereby limiting the enhancer activity to a certain chromosomal domain and define nuclear architecture (reviewed in 45,55).56 Unlike enhancer elements, the function of insulator sequences depends upon orientation57 and in some instances insulators may also act as decoy promoters (reviewed in 55). Therefore, the promoter activity of the rs12926231 region that was detected in the in vitro transfection assays may be part of its insulator features. Alternatively, it may reflect the presence of a polymorphic binding site for a transcriptional activator, such as the E1A binding protein p300 (Figure S3). Based on our data, we hypothesize that the G and C alleles of rs12936231 contribute to alternative conformations of the chromosome 17q12-q21, the asthma-associated haplotype (bearing the C allele of rs12936231) favoring 2- to 4-fold higher expression of GSDMB and ORMDL3 and 2-fold lower expression of ZPBP2 than the other common haplotype (Figure 4E). Genome-wide studies of CTCF binding in different cell lines (fibroblasts,58 CD4+ T cells, Jurkat, and HeLa cells59) have provided cell-type-specific maps of CTCF binding sites within the ZPBP2/GSDMB/ORMDL3 domain. Interestingly, rs12936231 is located within a region of weak CTCF binding in the CD4+ T cells (chr17:35282380-35282673).59 In addition, newly released Broad Chip-seq ENCODE data for CTCF revealed a binding site at the rs12936231 SNP in a heterozygous LCL sample (GM12878) (Figure S4).46 Although this region is not significantly associated with CTCF in other cell types, this may reflect the genotype specificity of CTCF binding at the rs12936231 SNP. The role of rs8067378, which also has suggestive functional data, is less clear. It may be part of a transcriptional regulatory element and/or involved in defining the architecture of chromatin loops in this domain. Our proposed mechanism is reminiscent of modified chromatin looping in the 4q35 region resulting from D4Z4 deletions in patients with facioscapulohumeral dystrophy.60,61 An important observation for the 17q12-q21 region is that changes in gene expression levels are subtle, which is consistent with probabilistic effects of mutations influencing epigenetic states.53,62 It is also possible that both chromatin conformations coexist in the cell population and environmental triggers may shift the equilibrium in favor of one of the conformations.
Our results suggest that the role of the 17q12-q21 chromosomal region in the predisposition to asthma may result from changes in expression of one of the genes in this chromosomal domain or a combined effect of changes in expression of all three transcripts. This same region was among the validated GWA hits for three autoimmune diseases: CD,9 T1D,10 and PBC.11 The top SNPs for this region are rs2872507 for CD, rs2290400 for T1D, and rs907092 for PBC, all of which are also associated with AE in CEU LCLs (p = 3.01 × 10⁻¹², p = 1.09 × 10⁻¹⁸, and p = 3.01 × 10⁻¹², respectively; Table 1). In contrast to the alleles implicated in the predisposition to asthma, the CD, T1D, and PBC risk alleles are found on the haplotype associated with decreased expression of GSDMB and ORMDL3. All the associated diseases are, in part, characterized by an abnormal inflammatory response, and because the allelic transcriptional effects were detected in cells of lymphoid origin, we speculate that the haplotype harboring rs12936231 and controlling gene expression in the 17q12-q21 region may have a general impact on inflammation. The gene product of GSDMB is an interesting candidate for the etiology of asthma and autoimmune disease. GSDMB is a 411 amino acid protein that is part of the gasdermin family, which is believed to play a role as a metabolic product involved in a secretory pathway and may also be involved in achieving and maintaining the final differentiation state of epithelial cells.63,64 Transcriptional and translational regulation of these alternatively spliced isoforms has been seen in the development and/or progression of gastrointestinal and hepatic cancers.63 GSDMB is highly expressed in T cells (CD8+ Tc and CD4+ Th) and moderately expressed in fetal lung, but it has low expression in bronchial epithelial cells.65 However, the pleiotropic effect of the closely linked SNPs on multiple diseases could suggest a more direct role on the control of immune system function rather than function in any specific target cell type. In parallel, with the opposite effects of the 17q12 haplotypes on the risk of developing asthma versus autoimmune disease, there is evidence of Th1 versus Th2 cell type inflammatory response predominance in allergic versus autoimmune disease66 warranting further studies of the potential regulatory role of GSDMB or other transcripts in the region. Interestingly, genotype-controlled expression of GSDMB is also observed in RNA panels derived from brain cortex and from peripheral blood mononuclear cells67 but not in osteoblasts (Figure S7), indicating that the allele-specific regulation observed, although tissue specific, is not restricted to EBV-transformed B cells. We note that a substantial proportion (>30%) of cis-variants discovered in immortalized LCLs are shared in primary cells of distinct lineage12 (B.G., D.K. Pokholok, T.K., E.G., L. Morcos, D.J.V., J. Le, V.K., K.C.L.L., V. Gagné, J.D., R.H., A. Montpetit, M.-M. Joly, E.J. Harvey, D.S., P. Beaulieu, R. Hamon, A. Graziani, K.D., E.H., J. Majewski, H.H.H. Göring, A.K.N., M. Blanchette, K.L. Gunderson, and T.P., unpublished data) similar to rates observed between different human tissues.68 Furthermore, given the influence of 17q12 region in multiple inflammatory/autoimmune traits, we believe that the lymphoid lineage represented by the LCL transcriptome is also directly relevant to these types of diseases.
In more general terms, our study highlights the challenges of dissecting the function of noncoding variants, where gene expression or chromatin changes observed in vivo may not be replicated by existing in vitro tools.69,70 Our approach was to use the AE genetic association data as the primary tool for prioritization of SNPs for further studies. It is remarkable that two completely independent allele-specific approaches in living cells converged to implicate rs12926231 as a key functional variant in the disease-associated haplotype. At the same time, the strongly positive EMSA results for rs8067378, which showed an equally strong link with AE, cannot be overlooked since at present, the rates of false negative results in chromatin assays in living cells are unknown.
In conclusion, we have presented a systematic approach for dissecting common regulatory variation in disease-linked haplotypes. This approach allowed us to uncover a domain-wide genetic cis-regulatory effect that is likely to result from genotype-dependent DNA-protein interactions, nucleosomes positioning, and CTCF binding. Our data brings us a step closer to elucidating the mechanism for genetic susceptibility to a common disease. This work demonstrates the power of model systems and cellular phenotypes to isolate causal noncoding variants, and more generally, highlights the diversity of tools and converging lines of evidence needed for characterization of noncoding disease variation.
Supplemental Data
Supplemental Data include seven figures and seven tables and can be found with this article online at http://www.ajhg.org/.
Supplemental Data
Web Resources
The URLs for data presented herein are as follows:
Database of Genomic Variants, http://projects.tcag.ca/variation/
ENCODE, http://www.genome.gov/ENCODE/
GRiD: Gene Regulators in Disease, http://www.regulatorygenomics.org
The HapMap project, http://www.hapmap.org
Ingenuity Systems, http://www.ingenuity.com
Online Mendelian Inheritance in Man (OMIM), http://www.ncbi.nlm.nih.gov/Omim/
Primer 3, http://frodo.wi.mit.edu/
Acknowledgments
The authors would like to thank all the participants of the asthmatic cohorts and P. Giresi for helpful suggestions regarding the FAIRE assay. The authors are grateful to Julie Boudreau and Donna Sinnett for performing the DNA sequencing assays at the McGill University and Genome Quebec Innovation Centre. This work is supported by Genome Quebec and Genome Canada and is part of the Gene Regulators in Disease (GRiD) project. T.P. holds a Canada Research Chair (Tier 2) in Human Genomics. D.S. holds the FKV research chair in Pediatric Oncogenomics. C.L. holds a Canada Research Chair (Tier 2) and is the director of the Inflammation and Remodeling Strategic Group of the Respiratory Health Network of the Fonds de la Recherche en Santé du Québec (FRSQ). D.J.V. and A.-M.M. are supported by the Canadian Institutes of Health Research (CIHR). We acknowledge the CAMP investigators and research team, supported by NHLBI, for collection of CAMP Genetic Ancillary Study data. All work on data collected from the CAMP Genetic Ancillary Study was conducted at the Channing Laboratory of the Brigham and Women's Hospital under appropriate CAMP policies and human subject protections. The CAMP Genetics Ancillary Study is supported by U01 HL075419, U01 HL65899, P01 HL083069, R01 HL 086601, and T32 HL07427 from the National Heart, Lung and Blood Institute, National Institutes of Health. The Genetics of Asthma in Costa Rica study was supported by NIH/NHLBI grants HL04370 and HL66289. The authors would also like to thank the ENCODE project and the Bradley E. Bernstein laboratory located at the Massachusetts General Hospital/Harvard Medical School for making available their CHIP-seq data generated at the ZPBP2-ORMDL3 locus. The ENCODE Histone Modifications project was funded by the NHGRI, the Burroughs Wellcome Fund, the Massachusetts General Hospital, and the Broad Institute.
References
- 1.American Lung Association. (2008). Asthma. In Lung Disease Data: 2008. (http://www.lungusa.org/site/c.dvLUK9O0E/b.4136273/k.16D5/Lung_Disease_Data_2008.htm).
- 2.Ober C., Hoffjan S. Asthma genetics 2006: The long and winding road to gene discovery. Genes Immun. 2006;7:95–100. doi: 10.1038/sj.gene.6364284. [DOI] [PubMed] [Google Scholar]
- 3.Vercelli D. Discovering susceptibility genes for asthma and allergy. Nat. Rev. Immunol. 2008;8:169–182. doi: 10.1038/nri2257. [DOI] [PubMed] [Google Scholar]
- 4.Moffatt M.F., Kabesch M., Liang L., Dixon A.L., Strachan D., Heath S., Depner M., von Berg A., Bufe A., Rietschel E. Genetic variants regulating ORMDL3 expression contribute to the risk of childhood asthma. Nature. 2007;448:470–473. doi: 10.1038/nature06014. [DOI] [PubMed] [Google Scholar]
- 5.Sleiman P.M., Annaiah K., Imielinski M., Bradfield J.P., Kim C.E., Frackelton E.C., Glessner J.T., Eckert A.W., Otieno F.G., Santa E. ORMDL3 variants associated with asthma susceptibility in North Americans of European ancestry. J. Allergy Clin. Immunol. 2008;122:1225–1227. doi: 10.1016/j.jaci.2008.06.041. [DOI] [PubMed] [Google Scholar]
- 6.Madore A.M., Tremblay K., Hudson T.J., Laprise C. Replication of an association between 17q21 SNPs and asthma in a French-Canadian familial collection. Hum. Genet. 2008;123:93–95. doi: 10.1007/s00439-007-0444-x. [DOI] [PubMed] [Google Scholar]
- 7.Galanter J., Choudhry S., Eng C., Nazario S., Rodriguez-Santana J.R., Casal J., Torres-Palacios A., Salas J., Chapela R., Watson H.G. ORMDL3 gene is associated with asthma in three ethnically diverse populations. Am. J. Respir. Crit. Care Med. 2008;177:1194–1200. doi: 10.1164/rccm.200711-1644OC. [DOI] [PMC free article] [PubMed] [Google Scholar]
- 8.Hirota T., Harada M., Sakashita M., Doi S., Miyatake A., Fujita K., Enomoto T., Ebisawa M., Yoshihara S., Noguchi E. Genetic polymorphism regulating ORM1-like 3 (Saccharomyces cerevisiae) expression is associated with childhood atopic asthma in a Japanese population. J. Allergy Clin. Immunol. 2008;121:769–770. doi: 10.1016/j.jaci.2007.09.038. [DOI] [PubMed] [Google Scholar]
- 9.Barrett J.C., Hansoul S., Nicolae D.L., Cho J.H., Duerr R.H., Rioux J.D., Brant S.R., Silverberg M.S., Taylor K.D., Barmada M.M. Genome-wide association defines more than 30 distinct susceptibility loci for Crohn's disease. Nat. Genet. 2008;40:955–962. doi: 10.1038/NG.175. [DOI] [PMC free article] [PubMed] [Google Scholar]
- 10.Barrett J.C., Clayton D.G., Concannon P., Akolkar B., Cooper J.D., Erlich H.A., Julier C., Morahan G., Nerup J., Nierras C. Genome-wide association study and meta-analysis find that over 40 loci affect risk of type 1 diabetes. Nat. Genet. 2009 doi: 10.1038/ng.381. in press. Published online May 10, 2009. [DOI] [PMC free article] [PubMed] [Google Scholar]
- 11.Hirschfield G.M., Liu X., Xu C., Lu Y., Xie G., Gu X., Walker E.J., Jing K., Juran B.D., Mason A.L. Primary biliary cirrhosis associated with HLA, IL12A, and IL12RB2 variants. N. Engl. J. Med. 2009;360:2544–2555. doi: 10.1056/NEJMoa0810440. [DOI] [PMC free article] [PubMed] [Google Scholar]
- 12.Verlaan D.J., Ge B., Grundberg E., Hoberman R., Lam K.C., Koka V., Dias J., Gurd S., Martin N.W., Mallmin H. Targeted screening of cis-regulatory variation in human haplotypes. Genome Res. 2009;19:118–127. doi: 10.1101/gr.084798.108. [DOI] [PMC free article] [PubMed] [Google Scholar]
- 13.Stranger B.E., Nica A.C., Forrest M.S., Dimas A., Bird C.P., Beazley C., Ingle C.E., Dunning M., Flicek P., Koller D. Population genomics of human gene expression. Nat. Genet. 2007;39:1217–1224. doi: 10.1038/ng2142. [DOI] [PMC free article] [PubMed] [Google Scholar]
- 14.Dixon A.L., Liang L., Moffatt M.F., Chen W., Heath S., Wong K.C., Taylor J., Burnett E., Gut I., Farrall M. A genome-wide association study of global gene expression. Nat. Genet. 2007;39:1202–1207. doi: 10.1038/ng2109. [DOI] [PubMed] [Google Scholar]
- 15.The International HapMap Consortium A haplotype map of the human genome. Nature. 2005;437:1299–1320. doi: 10.1038/nature04226. [DOI] [PMC free article] [PubMed] [Google Scholar]
- 16.Ge B., Gurd S., Gaudin T., Dore C., Lepage P., Harmsen E., Hudson T.J., Pastinen T. Survey of allelic expression using EST mining. Genome Res. 2005;15:1584–1591. doi: 10.1101/gr.4023805. [DOI] [PMC free article] [PubMed] [Google Scholar]
- 17.Pastinen T., Ge B., Gurd S., Gaudin T., Dore C., Lemire M., Lepage P., Harmsen E., Hudson T.J. Mapping common regulatory variants to human haplotypes. Hum. Mol. Genet. 2005;14:3963–3971. doi: 10.1093/hmg/ddi420. [DOI] [PubMed] [Google Scholar]
- 18.Serre D., Gurd S., Ge B., Sladek R., Sinnett D., Harmsen E., Bibikova M., Chudin E., Barker D.L., Dickinson T. Differential allelic expression in the human genome: A robust approach to identify genetic and epigenetic cis-acting mechanisms regulating gene expression. PLoS Genet. 2008;4:e1000006. doi: 10.1371/journal.pgen.1000006. [DOI] [PMC free article] [PubMed] [Google Scholar]
- 19.Hoberman R., Dias J., Ge B., Harmsen E., Mayhew M., Verlaan D.J., Kwan T., Dewar K., Blanchette M., Pastinen T. A probabilistic approach for SNP discovery in high-throughput human resequencing data. Genome Res. 2009 doi: 10.1101/gr.092072.109. in press. Published online August 5, 2009. [DOI] [PMC free article] [PubMed] [Google Scholar]
- 20.Iafrate A.J., Feuk L., Rivera M.N., Listewnik M.L., Donahoe P.K., Qi Y., Scherer S.W., Lee C. Detection of large-scale variation in the human genome. Nat. Genet. 2004;36:949–951. doi: 10.1038/ng1416. [DOI] [PubMed] [Google Scholar]
- 21.R Development Core Team . R Foundation for Statistical Computing; Vienna, Austria: 2008. R: A Language and Environment for Statistical Computing. [Google Scholar]
- 22.Giresi P.G., Kim J., McDaniell R.M., Iyer V.R., Lieb J.D. FAIRE (formaldehyde-assisted isolation of regulatory elements) isolates active regulatory elements from human chromatin. Genome Res. 2007;17:877–885. doi: 10.1101/gr.5533506. [DOI] [PMC free article] [PubMed] [Google Scholar]
- 23.Umlauf D., Goto Y., Feil R. Site-specific analysis of histone methylation and acetylation. Methods Mol. Biol. 2004;287:99–120. doi: 10.1385/1-59259-828-5:099. [DOI] [PubMed] [Google Scholar]
- 24.Heard E., Rougeulle C., Arnaud D., Avner P., Allis C.D., Spector D.L. Methylation of histone H3 at Lys-9 is an early mark on the X chromosome during X inactivation. Cell. 2001;107:727–738. doi: 10.1016/s0092-8674(01)00598-0. [DOI] [PubMed] [Google Scholar]
- 25.Bell A.C., Felsenfeld G. Methylation of a CTCF-dependent boundary controls imprinted expression of the Igf2 gene. Nature. 2000;405:482–485. doi: 10.1038/35013100. [DOI] [PubMed] [Google Scholar]
- 26.Belanger H., Beaulieu P., Moreau C., Labuda D., Hudson T.J., Sinnett D. Functional promoter SNPs in cell cycle checkpoint genes. Hum. Mol. Genet. 2005;14:2641–2648. doi: 10.1093/hmg/ddi298. [DOI] [PubMed] [Google Scholar]
- 27.Childhood Asthma Management Program Research Group The Childhood Asthma Management Program (CAMP) design, rationale, and methods. Control. Clin. Trials. 1999;20:91–120. [PubMed] [Google Scholar]
- 28.Childhood Asthma Management Program Research Group Long-term effects of budesonide or nedocromil in children with asthma. N. Engl. J. Med. 2000;343:1054–1063. doi: 10.1056/NEJM200010123431501. [DOI] [PubMed] [Google Scholar]
- 29.Hunninghake G.M., Soto-Quiros M.E., Avila L., Ly N.P., Liang C., Sylvia J.S., Klanderman B.J., Silverman E.K., Celedon J.C. Sensitization to Ascaris lumbricoides and severity of childhood asthma in Costa Rica. J. Allergy Clin. Immunol. 2007;119:654–661. doi: 10.1016/j.jaci.2006.12.609. [DOI] [PubMed] [Google Scholar]
- 30.Raby B.A., Silverman E.K., Kwiatkowski D.J., Lange C., Lazarus R., Weiss S.T. ADAM33 polymorphisms and phenotype associations in childhood asthma. J. Allergy Clin. Immunol. 2004;113:1071–1078. doi: 10.1016/j.jaci.2004.03.035. [DOI] [PubMed] [Google Scholar]
- 31.Escamilla M.A., Spesny M., Reus V.I., Gallegos A., Meza L., Molina J., Sandkuijl L.A., Fournier E., Leon P.E., Smith L.B. Use of linkage disequilibrium approaches to map genes for bipolar disorder in the Costa Rican population. Am. J. Med. Genet. 1996;67:244–253. doi: 10.1002/(SICI)1096-8628(19960531)67:3<244::AID-AJMG2>3.0.CO;2-N. [DOI] [PubMed] [Google Scholar]
- 32.Standards for the diagnosis and care of patients with chronic obstructive pulmonary disease (COPD) and asthma. This official statement of the American Thoracic Society was adopted by the ATS Board of Directors, November 1986. Am. Rev. Respir. Dis. 1987;136:225–244. doi: 10.1164/ajrccm/136.1.225. [DOI] [PubMed] [Google Scholar]
- 33.O'Connell J.R., Weeks D.E. PedCheck: A program for identification of genotype incompatibilities in linkage analysis. Am. J. Hum. Genet. 1998;63:259–266. doi: 10.1086/301904. [DOI] [PMC free article] [PubMed] [Google Scholar]
- 34.Spielman R.S., McGinnis R.E., Ewens W.J. Transmission test for linkage disequilibrium: the insulin gene region and insulin-dependent diabetes mellitus (IDDM) Am. J. Hum. Genet. 1993;52:506–516. [PMC free article] [PubMed] [Google Scholar]
- 35.Lake S.L., Blacker D., Laird N.M. Family-based tests of association in the presence of linkage. Am. J. Hum. Genet. 2000;67:1515–1525. doi: 10.1086/316895. [DOI] [PMC free article] [PubMed] [Google Scholar]
- 36.Nyholt D.R. A simple correction for multiple testing for single-nucleotide polymorphisms in linkage disequilibrium with each other. Am. J. Hum. Genet. 2004;74:765–769. doi: 10.1086/383251. [DOI] [PMC free article] [PubMed] [Google Scholar]
- 37.Kwan T., Benovoy D., Dias C., Gurd S., Provencher C., Beaulieu P., Hudson T.J., Sladek R., Majewski J. Genome-wide analysis of transcript isoform variation in humans. Nat. Genet. 2008;40:225–231. doi: 10.1038/ng.2007.57. [DOI] [PubMed] [Google Scholar]
- 38.Miller W., Rosenbloom K., Hardison R.C., Hou M., Taylor J., Raney B., Burhans R., King D.C., Baertsch R., Blankenberg D. 28-way vertebrate alignment and conservation track in the UCSC Genome Browser. Genome Res. 2007;17:1797–1808. doi: 10.1101/gr.6761107. [DOI] [PMC free article] [PubMed] [Google Scholar]
- 39.Paul J., Allan M., Gilmour S., Spandidos D., Montague P., Grindlay J., Vass K., Zhu J.D., Gow J. Distant sequences which regulate globin genes. Prog. Clin. Biol. Res. 1985;191:29–48. [PubMed] [Google Scholar]
- 40.Carr M.S., Yevtodiyenko A., Schmidt C.L., Schmidt J.V. Allele-specific histone modifications regulate expression of the Dlk1-Gtl2 imprinted domain. Genomics. 2007;89:280–290. doi: 10.1016/j.ygeno.2006.10.005. [DOI] [PMC free article] [PubMed] [Google Scholar]
- 41.Fournier C., Goto Y., Ballestar E., Delaval K., Hever A.M., Esteller M., Feil R. Allele-specific histone lysine methylation marks regulatory regions at imprinted mouse genes. EMBO J. 2002;21:6560–6570. doi: 10.1093/emboj/cdf655. [DOI] [PMC free article] [PubMed] [Google Scholar]
- 42.Xi H., Shulha H.P., Lin J.M., Vales T.R., Fu Y., Bodine D.M., McKay R.D., Chenoweth J.G., Tesar P.J., Furey T.S. Identification and characterization of cell type-specific and ubiquitous chromatin regulatory structures in the human genome. PLoS Genet. 2007;3:e136. doi: 10.1371/journal.pgen.0030136. [DOI] [PMC free article] [PubMed] [Google Scholar]
- 43.Xie X., Mikkelsen T.S., Gnirke A., Lindblad-Toh K., Kellis M., Lander E.S. Systematic discovery of regulatory motifs in conserved regions of the human genome, including thousands of CTCF insulator sites. Proc. Natl. Acad. Sci. USA. 2007;104:7145–7150. doi: 10.1073/pnas.0701811104. [DOI] [PMC free article] [PubMed] [Google Scholar]
- 44.Fu Y., Sinha M., Peterson C.L., Weng Z. The insulator binding protein CTCF positions 20 nucleosomes around its binding sites across the human genome. PLoS Genet. 2008;4:e1000138. doi: 10.1371/journal.pgen.1000138. [DOI] [PMC free article] [PubMed] [Google Scholar]
- 45.Wallace J.A., Felsenfeld G. We gather together: Insulators and genome organization. Curr. Opin. Genet. Dev. 2007;17:400–407. doi: 10.1016/j.gde.2007.08.005. [DOI] [PMC free article] [PubMed] [Google Scholar]
- 46.Birney E., Stamatoyannopoulos J.A., Dutta A., Guigo R., Gingeras T.R., Margulies E.H., Weng Z., Snyder M., Dermitzakis E.T., Thurman R.E. Identification and analysis of functional elements in 1% of the human genome by the ENCODE pilot project. Nature. 2007;447:799–816. doi: 10.1038/nature05874. [DOI] [PMC free article] [PubMed] [Google Scholar]
- 47.Helgason A., Palsson S., Thorleifsson G., Grant S.F., Emilsson V., Gunnarsdottir S., Adeyemo A., Chen Y., Chen G., Reynisdottir I. Refining the impact of TCF7L2 gene variants on type 2 diabetes and adaptive evolution. Nat. Genet. 2007;39:218–225. doi: 10.1038/ng1960. [DOI] [PubMed] [Google Scholar]
- 48.Dermitzakis E.T. From gene expression to disease risk. Nat. Genet. 2008;40:492–493. doi: 10.1038/ng0508-492. [DOI] [PubMed] [Google Scholar]
- 49.Long A.D., Langley C.H. The power of association studies to detect the contribution of candidate genetic loci to variation in complex traits. Genome Res. 1999;9:720–731. [PMC free article] [PubMed] [Google Scholar]
- 50.Georges S.A., Giebler H.A., Cole P.A., Luger K., Laybourn P.J., Nyborg J.K. Tax recruitment of CBP/p300, via the KIX domain, reveals a potent requirement for acetyltransferase activity that is chromatin dependent and histone tail independent. Mol. Cell. Biol. 2003;23:3392–3404. doi: 10.1128/MCB.23.10.3392-3404.2003. [DOI] [PMC free article] [PubMed] [Google Scholar]
- 51.Takeda S., Chen D.Y., Westergard T.D., Fisher J.K., Rubens J.A., Sasagawa S., Kan J.T., Korsmeyer S.J., Cheng E.H., Hsieh J.J. Proteolysis of MLL family proteins is essential for taspase1-orchestrated cell cycle progression. Genes Dev. 2006;20:2397–2409. doi: 10.1101/gad.1449406. [DOI] [PMC free article] [PubMed] [Google Scholar]
- 52.Labialle S., Yang L., Ruan X., Villemain A., Schmidt J.V., Hernandez A., Wiltshire T., Cermakian N., Naumova A.K. Coordinated diurnal regulation of genes from the Dlk1-Dio3 imprinted domain: implications for regulation of clusters of non-paralogous genes. Hum. Mol. Genet. 2008;17:15–26. doi: 10.1093/hmg/ddm281. [DOI] [PubMed] [Google Scholar]
- 53.Gabellini D., Green M.R., Tupler R. When enough is enough: Genetic diseases associated with transcriptional derepression. Curr. Opin. Genet. Dev. 2004;14:301–307. doi: 10.1016/j.gde.2004.04.010. [DOI] [PubMed] [Google Scholar]
- 54.Kerkel K., Spadola A., Yuan E., Kosek J., Jiang L., Hod E., Li K., Murty V.V., Schupf N., Vilain E. Genomic surveys by methylation-sensitive SNP analysis identify sequence-dependent allele-specific DNA methylation. Nat. Genet. 2008;40:904–908. doi: 10.1038/ng.174. [DOI] [PubMed] [Google Scholar]
- 55.Bushey A.M., Dorman E.R., Corces V.G. Chromatin insulators: regulatory mechanisms and epigenetic inheritance. Mol. Cell. 2008;32:1–9. doi: 10.1016/j.molcel.2008.08.017. [DOI] [PMC free article] [PubMed] [Google Scholar]
- 56.Zlatanova J., Caiafa P. CCCTC-binding factor: To loop or to bridge. Cell. Mol. Life Sci. 2009;66:1647–1660. doi: 10.1007/s00018-009-8647-z. [DOI] [PMC free article] [PubMed] [Google Scholar]
- 57.Kanduri C., Holmgren C., Pilartz M., Franklin G., Kanduri M., Liu L., Ginjala V., Ulleras E., Mattsson R., Ohlsson R. The 5′ flank of mouse H19 in an unusual chromatin conformation unidirectionally blocks enhancer-promoter communication. Curr. Biol. 2000;10:449–457. doi: 10.1016/s0960-9822(00)00442-5. [DOI] [PubMed] [Google Scholar]
- 58.Kim T.H., Abdullaev Z.K., Smith A.D., Ching K.A., Loukinov D.I., Green R.D., Zhang M.Q., Lobanenkov V.V., Ren B. Analysis of the vertebrate insulator protein CTCF-binding sites in the human genome. Cell. 2007;128:1231–1245. doi: 10.1016/j.cell.2006.12.048. [DOI] [PMC free article] [PubMed] [Google Scholar]
- 59.Cuddapah S., Jothi R., Schones D.E., Roh T.Y., Cui K., Zhao K. Global analysis of the insulator binding protein CTCF in chromatin barrier regions reveals demarcation of active and repressive domains. Genome Res. 2009;19:24–32. doi: 10.1101/gr.082800.108. [DOI] [PMC free article] [PubMed] [Google Scholar]
- 60.Petrov A., Pirozhkova I., Carnac G., Laoudj D., Lipinski M., Vassetzky Y.S. Chromatin loop domain organization within the 4q35 locus in facioscapulohumeral dystrophy patients versus normal human myoblasts. Proc. Natl. Acad. Sci. USA. 2006;103:6982–6987. doi: 10.1073/pnas.0511235103. [DOI] [PMC free article] [PubMed] [Google Scholar]
- 61.Pirozhkova I., Petrov A., Dmitriev P., Laoudj D., Lipinski M., Vassetzky Y. A functional role for 4qA/B in the structural rearrangement of the 4q35 region and in the regulation of FRG1 and ANT1 in facioscapulohumeral dystrophy. PLoS ONE. 2008;3:e3389. doi: 10.1371/journal.pone.0003389. [DOI] [PMC free article] [PubMed] [Google Scholar]
- 62.Rakyan V.K., Blewitt M.E., Druker R., Preis J.I., Whitelaw E. Metastable epialleles in mammals. Trends Genet. 2002;18:348–351. doi: 10.1016/s0168-9525(02)02709-9. [DOI] [PubMed] [Google Scholar]
- 63.Carl-McGrath S., Schneider-Stock R., Ebert M., Rocken C. Differential expression and localisation of gasdermin-like (GSDML), a novel member of the cancer-associated GSDMDC protein family, in neoplastic and non-neoplastic gastric, hepatic, and colon tissues. Pathology. 2008;40:13–24. doi: 10.1080/00313020701716250. [DOI] [PubMed] [Google Scholar]
- 64.Katoh M. Evolutionary recombination hotspot around GSDML-GSDM locus is closely linked to the oncogenomic recombination hotspot around the PPP1R1B-ERBB2–GRB7 amplicon. Int. J. Oncol. 2004;24:757–763. [PubMed] [Google Scholar]
- 65.Su A.I., Wiltshire T., Batalov S., Lapp H., Ching K.A., Block D., Zhang J., Soden R., Hayakawa M., Kreiman G. A gene atlas of the mouse and human protein-encoding transcriptomes. Proc. Natl. Acad. Sci. USA. 2004;101:6062–6067. doi: 10.1073/pnas.0400782101. [DOI] [PMC free article] [PubMed] [Google Scholar]
- 66.Rabin R.L., Levinson A.I. The nexus between atopic disease and autoimmunity: A review of the epidemiological and mechanistic literature. Clin. Exp. Immunol. 2008;153:19–30. doi: 10.1111/j.1365-2249.2008.03679.x. [DOI] [PMC free article] [PubMed] [Google Scholar]
- 67.Heinzen E.L., Ge D., Cronin K.D., Maia J.M., Shianna K.V., Gabriel W.N., Welsh-Bohmer K.A., Hulette C.M., Denny T.N., Goldstein D.B. Tissue-specific genetic control of splicing: implications for the study of complex traits. PLoS Biol. 2008;6:e1. doi: 10.1371/journal.pbio.1000001. [DOI] [PMC free article] [PubMed] [Google Scholar]
- 68.Emilsson V., Thorleifsson G., Zhang B., Leonardson A.S., Zink F., Zhu J., Carlson S., Helgason A., Walters G.B., Gunnarsdottir S. Genetics of gene expression and its effect on disease. Nature. 2008;452:423–428. doi: 10.1038/nature06758. [DOI] [PubMed] [Google Scholar]
- 69.Cirulli E.T., Goldstein D.B. In vitro assays fail to predict in vivo effects of regulatory polymorphisms. Hum. Mol. Genet. 2007;16:1931–1939. doi: 10.1093/hmg/ddm140. [DOI] [PubMed] [Google Scholar]
- 70.Wang D., Chen H., Momary K.M., Cavallari L.H., Johnson J.A., Sadee W. Regulatory polymorphism in vitamin K epoxide reductase complex subunit 1 (VKORC1) affects gene expression and warfarin dose requirement. Blood. 2008;112:1013–1021. doi: 10.1182/blood-2008-03-144899. [DOI] [PMC free article] [PubMed] [Google Scholar]
Associated Data
This section collects any data citations, data availability statements, or supplementary materials included in this article.