

Abstract
In our ongoing effort to identify genes influencing the biological pathways that underlie the metabolic disturbances associated with obesity, we performed genome-wide scanning in 2,209 individuals distributed over 507 Caucasian families to localize quantitative trait loci (QTLs), which affect variation of plasma lipids. Pedigree-based analysis using a quantitative trait variance component linkage method that localized a QTL on chromosome 7q35-q36, which linked to variation in levels of plasma triglyceride [TG, logarithm of odds (LOD) score = 3.7] and was suggestive of linkage to LDL-cholesterol (LDL-C, LOD = 2.2). Covariates of the TG linkage included waist circumference, fasting insulin, and insulin:glucose, but not body mass index or hip circumference. Plasma HDL-cholesterol (HDL-C) levels were suggestively linked to a second QTL on chromosome 12p12.3 (LOD = 2.6). Five other QTLs with lower LOD scores were identified for plasma levels of LDL-C, HDL-C, and total cholesterol. These newly identified loci likely harbor genetic elements that influence traits underlying lipid adversities associated with obesity.
Supplementary key words: linkage analysis, triglycerides, obesity, lipid profiles, high density lipoprotein cholesterol
Obesity, a highly prevalent and chronic disorder, which carries significant health and economic costs, is associated with decreased longevity and increased risks from such health hazards as insulin resistance and diabetes, elevated blood pressure, and heart disease. Obesity, and abdominal obesity in particular, is strongly associated with an adverse dyslipidemic profile and an increased risk for coronary artery disease (1, 2). While this relationship has been described in detail, its pathophysiological basis remains unclear. Several studies have suggested a biologic cascade in which enhanced plasma flux of free fatty acid (FFA) from highly lipolytic, insulin-resistant adipocytes of the visceral-abdominal region in the basal state, along with its poor suppressibility by insulin in the fed state, could lead to overproduction of triglyceride (TG) and apolipoprotein B (apoB), with their subsequent channeling into the small, dense subfractions of VLDL and LDL (1, 3–5). Furthermore, the compensatory hyperinsulinemia of insulin resistance may directly influence hepatic production of these lipid-lipoprotein subcomponents to augment this process. Prospective twin and familial segregation studies have also suggested the existence of strong genetic determinants for this abnormal lipid-lipoprotein profile (6, 7).
In our search for the genetic etiology of the obesity-related metabolic adversities, we performed phenotyping and genotyping of individuals from 507 Caucasian families recruited through an obese proband and identified quantitative trait loci (QTLs) on chromosomes 3 (3q27) and 17 (17p12), which were strongly linked to variation in total body adiposity, abdominal fat partitioning, and insulin resistance (8). The present study was undertaken to identify QTLs that affect the obesity-related plasma lipid profile.
METHODS
Study participants
Details of recruitment strategies, ascertainment, and phenotyping characteristics of the individuals and families studied have been presented previously (8). Briefly, families with at least two obese siblings [body mass index (BMI) > 30], availability of one (preferably both) parent, and one or more never-obese siblings (BMI < 27) were ascertained. These were recruited from the TOPS (Take Off Pounds Sensibly, Inc.) membership in 10 states of the midwestern region of the US (WI, IL, MI, IA, MN, OH, WV, MO, KY, and IN). A questionnaire garnered personal data on each individual detailing his/her health, including asthma, kidney or liver disease, hypertension, heart disease, stroke, thyroid disorders, diabetes, medications, menopausal status and hormonal therapy, weight history, and smoking history. Exclusion criteria included pregnancy, type 1 diabetes, history of cancer, renal or hepatic disease, severe coronary artery disease, substance abuse, corticosteroids or thyroid dosages above replacement dose, history of weight loss of more than 10% in the preceding 12 months, as well as individuals receiving lipid-lowering medications. Phenotypic measurements included BMI, waist and hip circumferences, fasting plasma levels of glucose, insulin, insulin/glucose ratio, cholesterol, LDL-cholesterol (LDL-C), HDL-cholesterol (HLD-C), and plasma TG. A total of 2,209 individuals distributed over 507 Caucasian families of predominantly northern European ancestry completed the ascertainment and phenotyping procedures. As reported previously (8), the pairwise relationships within this cohort represented a total of 5,399 relative pairs, with the majority being nuclear family (2,177 parent-to-offspring and 2,198 sibling) relationships. All protocols have been approved by the Institutional Review Board of the Medical College of Wisconsin and follow IRB guidelines for patient safety and confidentiality. All subjects have given informed consent prior to their participation in these studies.
Phenotyping procedures
BMI (kg/m2) was determined from body weight and height. Waist and hip circumferences (cm) were measured according to the World Health Organization criteria. With participants wearing light clothing, waist circumference was the minimal measurement at the navel region and hip circumference the widest measurement at the hip and buttocks. Fasting plasma TG and cholesterol levels were determined spectrophotometrically. TG assay kits were obtained from Stanbio Laboratory, Inc. (San Antonio, TX), and cholesterol kits from Roche-Boehringer (Indianapolis, IN). HDL-C was determined after phosphotungstic acid/MgCl2 precipitation, and LDL-C was measured directly after immunoseparation (Sigma Diagnostics, St. Louis, MO). All determinations were performed in triplicate. Quality controls were performed to assure stability and reliability of the assays. The respective intraassay and interassay coefficients of variation for the lipid analyses were 4.7% and 5.3% for TG, 5.5% and 6.7% for cholesterol, 5.7% and 6.1% for HDL-C, and 2.9% and 7.5% for LDL-C.
Genotyping procedures
Genomic DNA from all samples was prepared from whole blood with commercial reagents (Puregene, Gentra Systems, Minneapolis, MN) using a nonphenol-based approach. DNA was amplified by PCR and screened using fluorescently labeled primers (Weber screening set 9, Research Genetics, Huntsville, AL) at the Marshfield Medical Research Foundation. This set included 387 short tandem repeat polymorphism (STRP) markers, including 366 autosomal, 17 X-chromosomal, and 4 Y-linked markers (9), and yielded an average map density of approximately 10 centiMorgan (cM). Products were analyzed using automated high-throughput scanning fluorescence detectors, each simultaneously detecting three separate dyes as previously described (8). All reported family relationships between individuals were validated by calculating likelihoods of the relationships based upon the autosomal genotype data (10). Errors in the relations between individuals were ascertained, and as a result, data on eight proband families (70 individuals) were discarded. The genotypic data were examined for Mendelian inconsistencies, and those genotypes proven to be inconsistent were removed. The average heterozygosity of the markers used was 0.79 ± 0.06, and the sex-averaged genetic spacing was 9.1 ± 3.8 cM.
Variance components linkage analysis
A variance component model applied to extended family data was used to test for evidence of linkage with phenotypes related to the metabolic syndrome, using a 10 cM genome-wide map of STRP markers. As described previously (8), an extension of the strategy developed by Amos (10) was used to estimate the genetic variance attributable to a specific chromosomal location (11). This approach is based upon specifying the expected genetic covariances between arbitrary relatives as a function of the identity-by-descent (IBD) relationships at a given marker locus.
Basic variance component linkage analysis includes a QTL-specific component, which was used to test for linkage in our analysis. Using a variance component model (12), we tested the null hypothesis that the additive genetic variance due to a QTL (σq2) equals zero (no linkage) by comparing the likelihood of this restricted model with that of a model in which σq2 is estimated. The difference between the two log10 likelihoods produces a logarithm of odds (LOD) score that is the equivalent of the classical LOD score of linkage analysis. Twice the difference in loge likelihoods of these models yields a test statistic that is asymptotically distributed as a 1/2:1/2 mixture of a X2 variable and a point mass at zero (13). This quantitative trait linkage method has been implemented in the program package SOLAR (11), which determines whether genetic variation at a specific chromosomal location can explain the variation in the phenotype (10, 12, 14).
Prior to the linkage analysis, values for kurtosis, the distributional attribute most likely to contribute to inflation of type I error, were determined and found to range from 0.2 to 1.8 (8), well within the acceptable range for the analytical methods employed. Genetic heritabilities for all phenotypes were estimated, and linkage scores were calculated after adjusting the observed LOD scores using the estimated correction constants, as described by Blangero et al. (15, 16), and after adjusting for a standard set of covariates found to influence the phenotypes (8). The set of covariates for these analyses, incorporated into the SOLAR package, included age, sex, and interactions between sex and age, smoking, menstrual status, intake of estrogen or birth control steroids, and history of asthma or diabetes.
Simulation studies suggested that the likelihood ratio test yields expected nominal P values for a wide variety of trait distributions (17); however, as an added precaution, we also obtained an empirical distribution for the LOD scores for this sample by simulation of over 10,000 replicates (15, 16). This approach allows for the calculation of expected LOD scores that are then regressed on the observed LOD scores to obtain the appropriate correction constant. In addition, genome-wide P values were calculated by using a method that adjusts for variation in chromosome-specific marker densities (18).
The use of the variance component approach requires an estimate of the IBD matrix. For this TOPS cohort, a pairwise maximum likelihood-based procedure was used to estimate IBD probabilities (11). To permit multipoint analysis for QTL mapping, we employed an extension (13) of the technique of Fulker and colleagues (19). Estimates of the IBD probabilities were generated at any point on a chromosome by using a constrained linear function of observed IBD probabilities of markers at known locations within the region. This multipoint procedure, which yields substantially greater power to localize QTLs than two-point methods, enabled direct localization of the QTL and construction of confidence intervals. One-LOD unit support intervals were obtained by identifying the peak for the maximal LOD score on the plot of the multipoint results, dropping down one LOD unit, and finding the chromosomal region defined by the shoulders of the curve. For the current data set, a LOD-score evaluation was performed every centiMorgan along the chromosome, the distances between markers having been determined using CRI-MAP (20).
RESULTS
In our study cohort of 507 Caucasian families recruited through an obese proband, we aimed to localize QTLs that affect the complex alterations in plasma lipid profiles associated with obesity. Our data support the notion of a strong genetic determinant influencing variation in plasma lipid levels in our cohort. Table 1 shows the means, ranges, and additive genetic heritabilities of the lipid-lipoprotein phenotypes measured. The additive genetic heritabilities (h2), estimated after allowing for the effects of the covariates listed in Methods, ranged from 0.30 to 0.47.
TABLE 1.
Plasma concentration and genetic heritability for the lipid traits determined
| n | Mean | Range | Additive Genetic Heritability (h2) | |
|---|---|---|---|---|
| TG, mg/dl | 2,136 | 124.3 ± 62.1 | 40–357 | 0.30 ± 0.04 |
| Total-C, mg/dl | 2,136 | 197.2 ± 39.4 | 100–320 | 0.47 ± 0.06 |
| HDL-C, mg/dl | 2,139 | 38.6 ± 10.3 | 16–75 | 0.31 ± 0.05 |
| LDL-C, mg/dl | 2,137 | 119.1 ± 33.9 | 41–219 | 0.38 ± 0.06 |
TG, triglyceride; HDL-C, HDL-cholesterol; LDL-C, LDL-cholesterol; n, the number of subjects in whom each lipid trait was measured; total-C, total cholesterol. Values are given as mean ± SD.
Table 2 lists adjusted results of the linkage analysis of the total genome scan for fasting plasma TG, total cholesterol (total-C), LDL-C, and HDL-C. Seven QTLs with a LOD score of 1.9 or higher were localized. Most prominent among these is the QTL on chromosome 7 at position q35-q36 that is associated with both plasma TG and LDL-C. Figure 1 shows the multipoint linkage analysis plot of the TG phenotype on chromosome 7 (LOD = 3.7). The 1-LOD-unit support interval surrounding the QTL peak at 174 cM (near marker D7S3058) spanned from 166 cM to 182 cM. In an analysis performed independently from TG, plasma LDL-C level was suggestively linked (LOD = 2.2) at the same QTL.
TABLE 2.
Chromosomal locations of lipid-lipoprotein phenotypes
| Phenotype | Locus | Location | LOD | Flank Markers |
|---|---|---|---|---|
| cM | ||||
| TG | 7q35-7q36 | 174 | 3.7 | D7S3058 |
| LDL-C | 7q35-7q36 | 174 | 2.2 | D7S3058 |
| 6q21 | 148 | 2.2 | GATA184A08 D6S2436 | |
| HDL-C | 12p12.3 | 42 | 2.6 | D12S373 GATA91H06 |
| 15q14 | 39 | 2.3 | ACTC D15S643 | |
| 2p13.3 | 97 | 2.0 | D2S1394 | |
| Total-C | 7q11.23 | 96 | 2.3 | D7S820 |
| 16q13 | 20 | 2.1 | ATA41E04 D16S748 | |
cM, centiMorgan; LOD logarithm of odds. The multipoint linkage results for the lipid parameters determined were adjusted for the standard set of covariates described in Methods (variance components linkage analysis). The numbers of subjects for each determination are given in Table 1. Locations (cM) are given by peak LOD.
Fig. 1.

Multipoint linkage map and logarithm of odds (LOD) scores for triglyceride (blue) and LDL-cholesterol (red) on chromosome 7. The multipoint linkage results for the lipid parameters determined were adjusted for the standard set of covariates described in Methods (variance components linkage analysis).
QTLs for HDL-C were found at 2p13.3, 12p12.3, and 15q14 (Table 2). Figure 2 shows the multipoint linkage analysis plot for HDL-C on chromosome 12, the locus where HDL-C showed its strongest linkage signal. The 1-LOD-unit support interval surrounding the QTL peak at 42 cM (between markers D12S373 and GATA91H06) spanned from 30 cM to 60 cM. Also, as shown in Table 2, additional linkages were found for total-C at 7q11.23 and 16q13, and for LDL-C on chromosome 6q21.
Fig. 2.
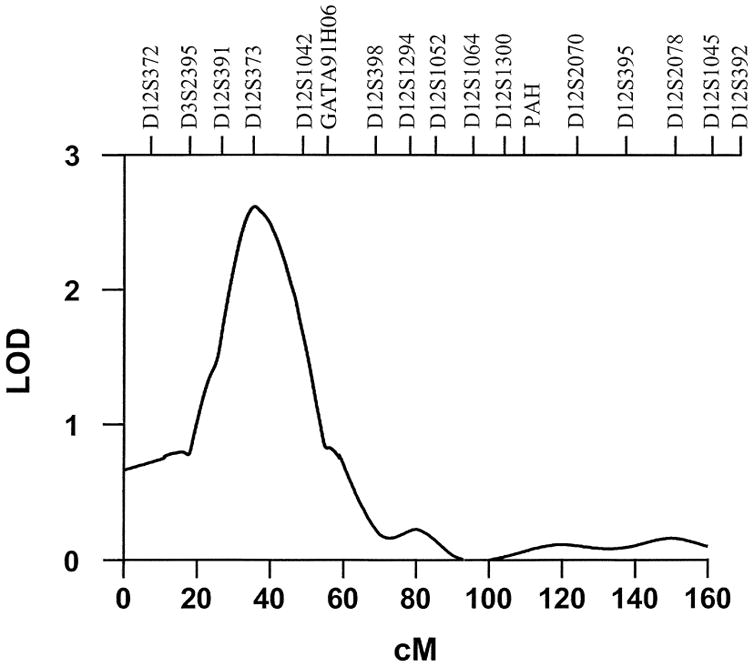
Multipoint linkage map and LOD scores for HDL-cholesterol on chromosome 12. The multipoint linkage results for the lipid parameters determined were adjusted for the standard set of covariates described in Methods.
Because of the known correlations between the plasma lipid profile and other features associated with obesity, linkage analyses were repeated to evaluate their contributions to the LOD score of the 7q35-q36 TG linkage. Inclusion of BMI or hip circumference measurements as an additional covariate only minimally influenced the linkage power for TG at this locus, the LOD score decreasing to 3.2 by the inclusion of either covariate. Inclusion of waist circumference, however, reduced this score to 2.7, while inclusion of insulin reduced it to 2.0 and inclusion of insulin:glucose to 1.7. The location of the maximal LOD score did not change during these evaluations, nor did the inclusion of these additional covariates affect the heritability estimate for TG.
DISCUSSION
We have localized a QTL on human chromosome 7q35-q36 that affects both plasma TG and LDL-C variation in Caucasian families of predominantly northern European ancestry. Several suggestive QTLs were also localized, including a region on chromosome 12p12.3, which affects plasma HDL-C variation. The large cohort of families studied, the selection of families including both obese and never-obese individuals, and the magnitude of the LOD scores identified emphasize the important contributions of these loci to the genetic architecture associated with the obesity-related lipid disorder.
The additive genetic heritability estimates for the lipid-lipoprotein phenotypes analyzed in our cohort range from 0.30 to 0.47 and strongly suggest the existence of genetic factors, which influence expression of this adverse lipid profile. Similar degrees of heritability influencing plasma levels of the same lipid components have previously been reported in twin, adoption, and family studies in nonobese normal subjects and individuals with established coronary artery disease (21–23). Our confidence in the stability of the QTL on chromosome 7 (7q35-q36) is also heightened by its replication in other studies. In a cohort of Mexican-Americans, Duggirala et al. (24) identified a locus harboring susceptibility genes for hypertriglyceridemia in this same region, while analysis of results from Caucasian families in the Framingham Heart Study provided evidence for a gene near this locus that affects the ratio of plasma TG and HDL-C (25). Moreover, a susceptibility locus for hereditary pancreatitis (26), a disorder frequently resulting in hypertriglyceridemia, has been mapped to this location.
Our analyses demonstrate that variation in plasma LDL-C within our population, analyzed independently from TG, is linked to the same QTL on chromosome 7q35-q36. This single QTL may impact variation on both phenotypes. Previous research has demonstrated a strong statistical correlation between plasma TG levels and alterations in the spectrum of LDL particles (27–29). Our linkage analysis provides support for a genetic origin to this correlation. Further studies to evaluate the LDL density spectra in our study cohort and their relationship to this reported linkage are in progress.
Reduced level of plasma HDL-C is a fundamental feature of the obesity-related lipid disorder, particularly that associated with abdominal obesity. The contribution of genetic factors to HDL-C plasma level variation has been reported previously (30, 31). The suggestive QTL on chromosome 12p12.3 that we identified in our analysis is known to include several candidate genes that could influence a broad spectrum of events regulating lipid-lipoprotein metabolism. One candidate gene is LOX-1 (OLR1), which encodes the human oxidized lipoprotein receptor 1 gene, a cell-surface receptor and a potent mediator of endothelial dysfunction (32). This receptor specifically binds, internalizes, and degrades oxidized LDL (33), which is essential to the development of atherosclerotic lesions (34, 35). A second candidate gene is the LDL-related protein 6, which participates in the clearance and intracellular processing of TG-rich lipoproteins (36). The 12p13 region includes the TNFRSF1 and TNFRSF7 genes, members of the tumor necrosis factor (TNF) receptor superfamily, which appear to influence lipoprotein metabolism and cardiovascular integrity (37, 38). Secretion of TNFα and other proinflammatory cytokines is now viewed as an important facet of obesity-related events leading toward the metabolic syndrome (39, 40). Another candidate near this region is the gene for the apoB mRNA editing enzyme (APOBEC1), which is involved in the catabolism of apoB-containing lipoproteins (41, 42).
Our linkage analyses have identified a number of additional suggestive QTLs to plasma variation in LDL-C, HDL-C, and total-C, some of which have been reported previously in other studies. In a Mexican-American population ascertained on a proband with type 2 diabetes mellitus, Duggirala et al. (24, 43) identified loci for susceptibility genes for hypertriglyceridemia on chromosomes 7 and 15. A significant linkage (LOD = 3.9) was identified with TG at 15q near 20 cM, while a suggestive linkage was found on chromosome 7 (near markers D7S506 and D7S653 at 90–100 cM). The latter linkage is close to our suggestive locus at 96 cM for total-C, while the linkage reported on chromosome 15 (between markers GABRB3 and D15S165 around 20–30 cM) is near the locus we report for HDL-C at 39 cM. Our suggestive linkage for HDL-C on chromosome 2 at 97 cM also replicates with a region linked to low HDL-C level at 91 cM in Finnish families (31). Whether these suggestive linkages are false positives or actually represent additional regions contributing to the complexity of the genetic architecture associated with obesity-related disorders remains to be evaluated.
The QTL on chromosome 7q35-q36 affects both TG and LDL-C, and the effect on TG is influenced by covariates representative of abdominal body fat topography (waist circumference) or insulin resistance (insulin and insulin:glucose). This suggests that this QTL harbors gene(s) that not only directly or indirectly affect plasma lipid levels, but also have a significant impact on other phenotypes associated with obesity and progression toward the metabolic syndrome. One potential candidate in this chromosomal region is the gene for endothelial nitric oxide synthase (eNOS). Among its many functions, nitric oxide (NO) mediates monocyte and leukocyte adhesion and smooth muscle cell proliferation, while many of the metabolic derangements associated with obesity and its associated metabolic syndrome, including hyperglycemia, elevated levels of plasma FFA, insulin resistance, and endothelial cell function, are influenced by levels of NO (44). NO production is stimulated through the activation of NF-κB through elevated levels of glucose, FFA, or insulin and by proinflammatory cytokines such as TNFα. In addition to its intrinsic actions, NO is a scavenger for reactive oxygen species and regulates expression of redox-regulated genes (45). Oxidative stress, which has been implicated in the development of insulin resistance and type 2 diabetes (46), may also contribute to the atherosclerotic process through the production of oxidized LDL. Several common polymorphisms in this gene influence susceptibility to atherosclerosis (47, 48), as well as hypertension (49, 50), insulin resistance, and type 2 diabetes (51, 52). To our knowledge, no association studies have been performed between eNOS and the obesity-related lipid profile. Further studies will need to investigate whether eNOS or its metabolites, possibly in conjunction with the products of LOX-1 and TNFRSF1 and/or TNFRSF7, contribute to the etiology of these lipid disturbances.
Our studies strongly suggest that these QTL areas contain gene(s) and/or regulatory elements that affect the adverse lipid profile associated with obesity and may play important roles in the subsequent development of cardiovascular complications.
Acknowledgments
This work was supported by Grants HL-34989, DK-54026, MH-59490, and RR-00058 from the National Institutes of Health. The genotyping was undertaken through the auspices of the Mammalian Genotyping Service of the NHLBI, with funds allocated to the Marshfield Medical Research Foundation. TOPS, Inc., provided funds for establishing the family database and provided some support for the phenotyping and linkage analysis.
Abbreviations
- apoB
apolipoprotein B
- BMI
body mass index
- cM
centiMorgan
- eNOS
endothelial nitric oxide synthase
- HDL-C
HDL-cholesterol
- IBD
identity-by-descent
- LDL-C
LDL-cholesterol
- LOD
logarithm of odds
- NO
nitric oxide
- QTLs
quantitative trait loci
- STRP
short tandem repeat polymorphism
- TG
triglyceride
- TNF
tumor necrosis factor
- total-C
total cholesterol
References
- 1.Kissebah AH, Krakower GR. Regional adiposity and morbidity. Physiol Rev. 1994;74:761–811. doi: 10.1152/physrev.1994.74.4.761. [DOI] [PubMed] [Google Scholar]
- 2.Lemieux S, Després JP. Metabolic complications of visceral obesity: contribution to the aetiology of type 2 diabetes and implications for prevention and treatment. Diabetes Metab. 1994;20:375–393. [PubMed] [Google Scholar]
- 3.Kissebah AH, Peiris AN. Biology of regional body fat distribution: relationship to non-insulin dependent diabetes mellitus. Diab Metab Rev. 1989;5:83–109. doi: 10.1002/dmr.5610050202. [DOI] [PubMed] [Google Scholar]
- 4.Björntorp P. Portal adipose tissue as a generator of risk factors for cardiovascular disease and diabetes. Arteriosclerosis. 1990;10:493–496. [PubMed] [Google Scholar]
- 5.Bergman RN, Van Citters GW, Mittelman SD, Dea MK, Hamilton-Wessler M, Kim SP, Ellmerer M. Central role of the adipocyte in the metabolic syndrome. J Investig Med. 2001;49:119–126. doi: 10.2310/6650.2001.34108. [DOI] [PubMed] [Google Scholar]
- 6.Després JP, Moorjani S, Lupien PJ, Tremblay A, Nadeau A, Bouchard C. Genetic aspects of susceptibility to obesity and related dyslipidemias. Mol Cell Biochem. 1992;113:151–169. doi: 10.1007/BF00231535. [DOI] [PubMed] [Google Scholar]
- 7.Mitchell BD, Kammerer CM, Mahaney MC, Blangero J, Comuzzie AG, Atwood LD, Haffner SM, Stern MP, Mac-Cluer JW. Genetic analysis of the IRS. Pleiotropic effects of genes influencing insulin levels on lipoprotein and obesity measures. Arterioscler Thromb Vasc Biol. 1996;16:281–288. doi: 10.1161/01.atv.16.2.281. [DOI] [PubMed] [Google Scholar]
- 8.Kissebah AH, Sonnenberg GE, Myklebust J, Goldstein M, Broman K, James RG, Marks JA, Krakower GR, Jacob HJ, Weber J, Martin L, Blangero J, Comuzzie AG. Quantitative trait loci on chromosomes 3 and 17 influence phenotypes of the metabolic syndrome. Proc Natl Acad Sci USA. 2000;97:14478–14483. doi: 10.1073/pnas.97.26.14478. [DOI] [PMC free article] [PubMed] [Google Scholar]
- 9.Amos CI. Robust variance-components approach for assessing genetic linkage in pedigrees. Am J Hum Genet. 1994;54:535–543. [PMC free article] [PubMed] [Google Scholar]
- 10.Boehnke M, Cox NJ. Accurate inference of relationships in sib-pair linkage studies. Am J Hum Genet. 1997;61:423–429. doi: 10.1086/514862. [DOI] [PMC free article] [PubMed] [Google Scholar]
- 11.Almasy L, Blangero J. Multipoint quantitative-trait linkage analysis in general pedigrees. Am J Hum Genet. 1998;62:1198–1211. doi: 10.1086/301844. [DOI] [PMC free article] [PubMed] [Google Scholar]
- 12.Blangero J, Almasy L. Multipoint oligogenic linkage analysis of quantitative traits. Genet Epidemiol. 1997;14:959–964. doi: 10.1002/(SICI)1098-2272(1997)14:6<959::AID-GEPI66>3.0.CO;2-K. [DOI] [PubMed] [Google Scholar]
- 13.Hopper JL, Mathews JD. Extensions to multivariate normal models for pedigree analysis. Ann Hum Genet. 1982;46:373–383. doi: 10.1111/j.1469-1809.1982.tb01588.x. [DOI] [PubMed] [Google Scholar]
- 14.Goldgar DE. Multipoint analysis of human quantitative genetic variation. Am J Hum Genet. 1990;47:957–967. [PMC free article] [PubMed] [Google Scholar]
- 15.Blangero J, Williams JT, Almasy L. Robust LOD scores for variance component-based linkage analysis. Genet Epidemiol. 2000;19:S8–S14. doi: 10.1002/1098-2272(2000)19:1+<::AID-GEPI2>3.0.CO;2-Y. [DOI] [PubMed] [Google Scholar]
- 16.Blangero J, Williams JT, Almasy L. Variance component methods for detecting complex trait loci. Adv Genet. 2001;42:151–181. doi: 10.1016/s0065-2660(01)42021-9. [DOI] [PubMed] [Google Scholar]
- 17.Allison DB, Heo M, Kaplan N, Martin ER. Sibling-based tests of linkage and association for quantitative traits. Am J Hum Genet. 1999;64:1754–1764. doi: 10.1086/302404. [DOI] [PMC free article] [PubMed] [Google Scholar]
- 18.Feingold E, Brown PO, Siegmund D. Gaussian models for genetic linkage analysis using complete high-resolution maps of identity by descent. Am J Hum Genet. 1993;53:234–251. [PMC free article] [PubMed] [Google Scholar]
- 19.Fulker DW, Cherny SS, Cardon LR. Multipoint interval mapping of quantitative trait loci, using sib pairs. Am J Hum Genet. 1995;56:1224–1233. [PMC free article] [PubMed] [Google Scholar]
- 20.Green P, Falls K, Crooks S. Documentation for CRI-MAP. Version 2.4. Department of Genetics, School of Medicine, Washington University; St. Louis: 1990. [Google Scholar]
- 21.Mahaney MC, Blangero J, Rainwater DL, Comuzzie AG, VandeBerg JL, Stern MP, MacCluer JW, Hixson JE. A major locus influencing plasma high-density lipoprotein cholesterol levels in the San Antonio Family Heart Study: segregation and linkage analyses. Arterioscler Thromb Vasc Biol. 1995;15:1730–1739. doi: 10.1161/01.atv.15.10.1730. [DOI] [PubMed] [Google Scholar]
- 22.Coon H, Leppert MF, Kronenberg F, Province MA, Myers RH, Arnett DK, Eckfeldt JH, Heiss G, Williams RR, Hunt SC. Evidence for a major gene accounting for mild elevation in LDL cholesterol: the NHLBI Family Heart Study. Ann Hum Genet. 1999;63:401–412. doi: 10.1046/j.1469-1809.1999.6350401.x. [DOI] [PubMed] [Google Scholar]
- 23.Klos KL, Kardia SLR, Ferrell RE, Turner ST, Boerwinkle E, Sing CF. Genome-wide linkage analysis reveals evidence of multiple regions that influence variation in plasma lipid and apolipoprotein levels associated with risk of coronary heart disease. Arterioscler Thromb Vasc Biol. 2001;21:971–978. doi: 10.1161/01.atv.21.6.971. [DOI] [PubMed] [Google Scholar]
- 24.Duggirala R, Stern MP, Mitchell BD, Reinhart LJ, Shipman PA, Uresandi OC, Chung WK, Leibel RL, Hales CN, O’Connell P, Blangero J. Quantitative variation in obesity-related traits and insulin precursors linked to the OB gene region on human chromosome 7. Am J Hum Genet. 1996;59:694–703. [PMC free article] [PubMed] [Google Scholar]
- 25.Shearman AM, Ordovas JM, Cupples LA, Schaefer EJ, Harmon MD, Shao Y, Keen JD, DeStefano AL, Joost O, Wilson PW, Housman DE, Myers RH. Evidence for a gene influencing the TG/HDL-C ratio on chromosome 7q32.3-qter: a genome-wide scan in the Framingham study. Hum Mol Genet. 2000;9:1315–1320. doi: 10.1093/hmg/9.9.1315. [DOI] [PubMed] [Google Scholar]
- 26.Whitcomb DC, Preston RA, Aston CE, Sossenheimer MJ, Barua PS, Zhang Y, Wong-Chong A, White GJ, Wood PG, Gates LK, Ulrich C, Martin SP, Post JC, Ehrlich GD. A gene for hereditary pancreatitis maps to chromosome 7q35. Gastroenterology. 1996;110:1975–1980. doi: 10.1053/gast.1996.v110.pm8964426. [DOI] [PubMed] [Google Scholar]
- 27.Haffner SM, Fong D, Hazuda HP, Pugh JA, Patterson JK. Hyperinsulinemia, upper-body adiposity and cardiovascular risk factors in non-diabetics. Metabolism. 1988;37:333–345. doi: 10.1016/0026-0495(88)90133-3. [DOI] [PubMed] [Google Scholar]
- 28.Austin MA, Breslow JL, Hennekens CH, Buring JE, Willett WC, Krauss RM. Low-density lipoprotein subclass patterns and risk of myocardial infarction. JAMA. 1988;260:1917–1921. [PubMed] [Google Scholar]
- 29.Griffin BA, Freeman DJ, Tait GW, Thomson J, Caslake MJ, Packard CJ, Shepherd J. Role of plasma triacylglycerol in the regulation of plasma low density lipoprotein (LDL) subfractions: relative contribution of small, dense LDL to coronary heart disease risk. Atherosclerosis. 1994;106:241–253. doi: 10.1016/0021-9150(94)90129-5. [DOI] [PubMed] [Google Scholar]
- 30.Peacock JM, Arnett DK, Atwood LD, Myers RH, Coon H, Rich SS, Province MA, Heiss G. Genome scan for quantitative trait loci linked to high-density lipoprotein cholesterol. The NHLBI Family Heart Study. Arterioscler Thromb Vasc Biol. 2001;21:1823–1828. doi: 10.1161/hq1101.097804. [DOI] [PubMed] [Google Scholar]
- 31.Soro A, Pajukanta P, Lilja HE, Ylitalo K, Hiekkalinna T, Perola M, Cantor RM, Viikari JSA, Taskinen MR, Peltonen L. Genome scans provide evidence for low-HDL-C loci on chromosomes 8q23, 16q24.1–24.2, and 20q13.11 in Finnish families. Am J Hum Genet. 2002;70:1333–1340. doi: 10.1086/339988. [DOI] [PMC free article] [PubMed] [Google Scholar]
- 32.Chen M, Masaki T, Sawamura T. LOX-1, the receptor for oxidized low-density lipoprotein identified from endothelial cells: implications in endothelial dysfunction and atherosclerosis. Pharmacol Ther. 2002;95:89–100. doi: 10.1016/s0163-7258(02)00236-x. [DOI] [PubMed] [Google Scholar]
- 33.Sawamura T, Kume N, Aoyama T, Moriwaki H, Hoshikawa H, Aiba Y, Tanaka T, Miwa S, Katsura Y, Kita T, Masaki T. An endothelial receptor for oxidized low-density lipoprotein. Nature. 1997;386:73–77. doi: 10.1038/386073a0. [DOI] [PubMed] [Google Scholar]
- 34.Holvoet P, Mertens A, Verhamme P, Bogaerts K, Beyens G, Verhaeghe R, Collen D, Muls E, Van der Werf F. Circulating oxidized LDL is a useful marker for identifying patients with coronary artery disease. Arterioscler Thromb Vasc Biol. 2001;21:844–848. doi: 10.1161/01.atv.21.5.844. [DOI] [PubMed] [Google Scholar]
- 35.Sigurdardottir V, Fagerberg B, Hulthe J. Circulating oxidized low-density lipoprotein (LDL) is associated with risk factors of the metabolic syndrome and LDL size in clinically healthy 58-year-old men (AIR study) J Intern Med. 2002;252:440–447. doi: 10.1046/j.1365-2796.2002.01054.x. [DOI] [PubMed] [Google Scholar]
- 36.Rohlmann A, Gotthardt M, Hammer RE, Herz J. Inducible inactivation of hepatic LRP gene by Cre-mediated recombination confirms role of LRP in clearance of chylomicron remnants. J Clin Invest. 1998;101:689–695. doi: 10.1172/JCI1240. [DOI] [PMC free article] [PubMed] [Google Scholar]
- 37.Moller DE. Potential role of TNF-α in the pathogenesis of insulin resistance and type 2 diabetes. Trends Endocrinol Metab. 2000;11:212–217. doi: 10.1016/s1043-2760(00)00272-1. [DOI] [PubMed] [Google Scholar]
- 38.van der Kallen CJH, Cantor RM, van Greevenbroek MMJ, Geurts JMW, Bouwman FG, Aouizerat BE, Allayee H, Buurman WA, Lusis AJ, Rotter JI, de Bruin TWA. Genome scan for adiposity in Dutch dyslipidemic families reveals novel quantitative trait loci for leptin, body mass index and soluble tumor necrosis factor receptor superfamily 1A. Int J Obes. 2000;24:1381–1391. doi: 10.1038/sj.ijo.0801412. [DOI] [PubMed] [Google Scholar]
- 39.Das UN. Obesity, metabolic syndrome X, and inflammation. Nutrition. 2002;18:430–432. doi: 10.1016/s0899-9007(01)00747-x. [DOI] [PubMed] [Google Scholar]
- 40.Fernández-Real JM, Ricart W. Insulin resistance and chronic cardiovascular inflammatory syndrome. Endocr Rev. 2003;24:278–301. doi: 10.1210/er.2002-0010. [DOI] [PubMed] [Google Scholar]
- 41.Davidson NO. Apolipoprotein B mRNA editing: a key controlling element targeting fats to proper tissue. Ann Med. 1993;25:539–543. [PubMed] [Google Scholar]
- 42.Morrison JR, Paszty C, Stevens ME, Hughes SD, Forte T, Scott J, Rubin EM. Apolipoprotein B RNA editing enzyme-deficient mice are viable despite alterations in lipoprotein metabolism. Proc Natl Acad Sci USA. 1996;93:7154–7159. doi: 10.1073/pnas.93.14.7154. [DOI] [PMC free article] [PubMed] [Google Scholar]
- 43.Duggirala R, Blangero J, Almasy L, Dyer TD, Williams KL, Leach RJ, O’Connell P, Stern MP. A major susceptibility locus influencing plasma triglyceride concentrations is located on chromosome 15q in Mexican Americans. Am J Hum Genet. 2000;66:1237–1245. doi: 10.1086/302849. [DOI] [PMC free article] [PubMed] [Google Scholar]
- 44.Creager MA, Lüscher TF, Cosentino F, Beckman JA. Diabetes and vascular disease. Pathophysiology, clinical consequences, and medical therapy: part 1. Circulation. 2003;108:1527–1532. doi: 10.1161/01.CIR.0000091257.27563.32. [DOI] [PubMed] [Google Scholar]
- 45.Ignarro LJ, Cirino G, Casini A, Napoli C. Nitric oxide as a signaling molecule in the vascular system: an overview. J Cardiovasc Pharmacol. 1999;34:879–886. doi: 10.1097/00005344-199912000-00016. [DOI] [PubMed] [Google Scholar]
- 46.Evans JL, I, Goldfine D, Maddux BA, Grodsky GM. Oxidative stress and stress-activated signaling pathways: a unifying hypothesis of type 2 diabetes. Endocr Rev. 2002;23:599–622. doi: 10.1210/er.2001-0039. [DOI] [PubMed] [Google Scholar]
- 47.Hingorani AD. Polymorphisms in endothelial nitric oxide synthase and atherogenesis. Atherosclerosis. 2000;154:521–527. doi: 10.1016/s0021-9150(00)00699-7. [DOI] [PubMed] [Google Scholar]
- 48.Colombo MG, Paradossi U, Andreassi MG, Botto N, Manfredi S, Masetti S, Biagini A, Clerico A. Endothelial nitric oxide synthase gene polymorphisms and risk of coronary artery disease. Clin Chem. 2003;49:389–395. doi: 10.1373/49.3.389. [DOI] [PubMed] [Google Scholar]
- 49.Jachymova M, Horky K, Bultas J, Kozich V, Jindra A, Peleska J, Martasek P. Association of the Glu298Asp polymorphism in the endothelial nitric oxide synthase gene with essential hypertension resistant to conventional therapy. Biochem Biophys Res Commun. 2001;284:426–430. doi: 10.1006/bbrc.2001.5007. [DOI] [PubMed] [Google Scholar]
- 50.Kobashi G, Yamada H, Ohta K, Kato E, Ebina Y, Fujimoto S. Endothelial nitric oxide synthase gene (NOS3) variant and hypertension in pregnancy. Am J Med Genet. 2001;103:241–244. [PubMed] [Google Scholar]
- 51.Ohtoshi K, Yamasaki Y, Gorogawa S, Hayaishi-Okano R, Node K, Matsuhisa M, Kajimoto Y, Hori M. Association of –786T-C mutation of endothelial nitric oxide synthase gene with insulin resistance. Diabetologia. 2002;45:1594–1601. doi: 10.1007/s00125-002-0922-6. [DOI] [PubMed] [Google Scholar]
- 52.Monti LD, Barlassina C, Citterio L, Galluccio E, Berzuini C, Setola E, Valsecchi G, Lucotti P, Pozza G, Bernardinelli L, Casari G, Piatti PM. Endothelial nitric oxide synthase polymorphisms are associated with type 2 diabetes and the insulin resistance syndrome. Diabetes. 2003;52:1270–1275. doi: 10.2337/diabetes.52.5.1270. [DOI] [PubMed] [Google Scholar]