Abstract
Purpose
Previous studies in children report reduced accommodative responses with minus lens stimulated demands compared to proximal demands. This study seeks to identify age-related changes in accommodative lag with minus lens stimulated demands in subjects from preschoolers to adults.
Methods
Accommodative responses were measured in 101 subjects (3-40 years) with at least 10 subjects in each 5 year age bin. Subjects monocularly viewed a high contrast target at 33.3 cm on the near-point rod of the Grand Seiko autorefractor. Measurements of refraction were taken as the subject viewed the target. Accommodative lag was defined as the difference between demand and measured response. Four additional demands were tested by introducing minus lenses (−1 to −4 D) in the spectacle plane of the viewing eye. Maximum accommodative amplitudes were determined by presenting additional lenses until the measured response plateaued or peaked. Accommodative demands and responses were adjusted to the corneal plane.
Results
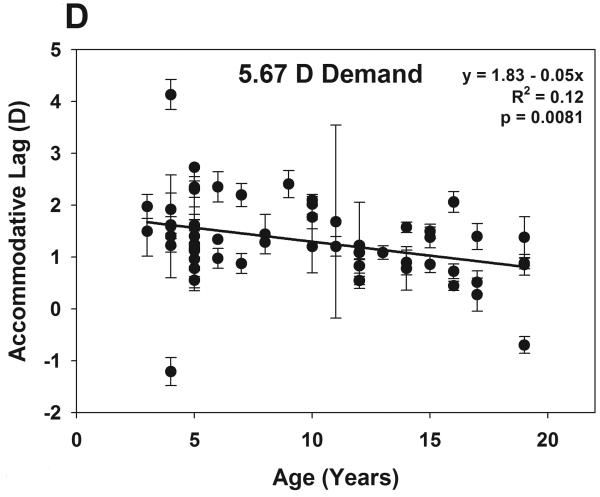
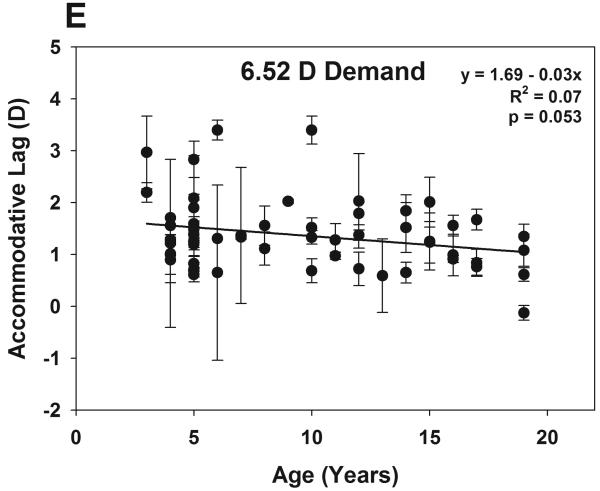
Accommodative lag showed a significant linear decrease with age for subjects 3 to 20 years for each of the first four demands (3 D, 3.92 D, 4.80 D, 5.67 D, p ≤ 0.013) and approached significance for the largest demand (6.52 D, p = 0.053). For the entire group, accommodative lag increased with increasing stimulus demand, with the largest increase occurring for subjects aged 30 to 40 years as stimulus demands approached the subjects' maximum amplitude. For subjects aged 3 to 20 years, multi-level modeling analysis revealed a significant relationship between age and lag (p < 0.0001) and a significant relationship between maximum amplitude and the increase in lag per unit increase in stimulus demand (p = 0.0032).
Conclusions
These findings suggest the accuracy of accommodation to minus lens stimulated accommodation improves throughout the school years and that the degree to which lag increases with increasing demand is related to maximum accommodative amplitude rather than age.
Keywords: accommodation, lag, children, lens blur, aging
Accommodative lag is the amount of under-accommodation of an accommodative response relative to the stimulus demand. Lag is reported to be large in young infants and decrease over the first few months of life.1-5 This developmental change in accommodative accuracy has been attributed to the decrease in depth of focus and the improvement in visual acuity that occurs during infancy.1,2 By the school age years, expected norms of accommodative lag measured in response to proximal targets by MEM and Nott dynamic retinoscopy range from plano to +1.00 D for near demands of 2 to 5 D and increase with closer viewing distances.6-8 The presence of age-related changes in lag beyond infancy remains unclear, as studies have reported both no change with age8,9 and an increase in lag with increasing age6 during the first two decades of life.
Studies in children in which accommodation is stimulated with minus lenses report increased accommodative lags in response to lens blur when compared to proximal stimulated accommodation.10,11 However, age-related changes in accommodative accuracy for minus lens stimuli have yet to be explored and it is unknown whether increased accommodative lags to minus lens blur as compared to proximal stimulated accommodation are present in both children and adults, or if the ability to respond to minus lens blur improves between childhood and adulthood. A recent study of objectively measured minus lens stimulated maximum accommodative amplitudes shows that accommodative amplitude is relatively stable from 3 to 20 years12. This is unlike the linear decrease reported for school aged children from studies that used the subjective push-up technique which overestimates true amplitudes.13 These more recent objectively measured data would suggest that accommodative amplitude should not impact the accuracy of the accommodative response in an age-dependent manner over this age range when stimulated with minus lenses; however, other factors such as depth of focus may change with age and result in differences in accommodative responses, just as they may impact maturation of accommodative responses in infants.
The aim of this study was to objectively measure accommodative lag to a near target viewed through increasing powered minus lenses in individuals over a large age range to identify any trends in accommodative accuracy with age, or accommodative accuracy with minus lens stimulated accommodative amplitude. A subset of subjects was also tested with proximal stimulated accommodation to determine if accommodative responses differed between minus lens versus proximal stimulated demands.
Methods
This study followed the tenets of the Declaration of Helsinki and was approved by the University of Houston Committee for the Protection of Human Subjects. Informed consent was obtained from all adult participants and parental consent and child assent obtained for all participants less than 18 years of age.
One hundred and one subjects from the University Eye Institute's staff, student, and patient populations were included in this study. Subjects included 60 females and 41 males ranging in age from 3 years to 40 years. For analysis, subjects were binned in age groups consisting of one interval from 3 to 5 years and then five year age intervals from 6-40. Each age-bin had at least 10 subjects. The inclusion criterion for the experiment was that subjects either had no correction, or were corrected with contact lenses or LASIK. Subjects wearing spectacles were not included due to the effect of spectacle lens effectivity on the accommodative stimulus demand, to ensure that demand varied by the same discrete steps in all subjects for inter-subject comparisons.
Subjects were excluded from participation if they had a history of significant eye or head injuries, a history of intraocular surgery, or were currently using any medications which are suspect for interfering with accommodation. In addition, subjects with a history of strabismus or amblyopia were excluded from participation in the study.
Study participants included 41 myopes (−1.75 D to −10.87 D spherical equivalent) and 60 emmetropes (−0.50 D to +0.75 D). Five adult myopic subjects had undergone LASIK prior to the study and the remaining 36 were corrected with contact lenses. Although subjects were not cyclopleged as part of the study protocol to screen for latent hyperopia, all subjects had age-expected unaided threshold visual acuities as reported below, making it unlikely that large amounts of uncorrected hyperopia were present in the emmetropic group. In addition, many of the subjects had previously received cycloplegic examinations in the university clinic (unrelated to the present study) and were documented as emmetropes.
Distance visual acuities were measured on all subjects using an age appropriate acuity task, either the Bailey-Lovie high contrast acuity chart14 for older subjects, or the Lea symbols acuity matching test15 for younger subjects. All subjects had monocular visual acuities of 20/20 in each eye, except for a few of the youngest subjects who were testable only to 20/25. This level of acuity is within the expected range for normal young children.16,17
Refraction of the eye was measured using the Grand Seiko WR-5100K® open-field Autorefractor (RyuSyo Industrial Co., Ltd. Kagawa, Japan). All measurements were taken on the subject's left eye with the right eye occluded in full room illumination while the subject wore their contact lens refractive correction if they had one. Subjects were first instructed to view a high-contrast target with pictures and letters positioned 11 meters across the room and three repeated distance measurements were taken over a period of seconds. The mean of these distance measurements represented the subjects' distance corrected residual refraction (over refraction) for those wearing contact lenses, or any small amounts of uncorrected refractive error for those subjects considered emmetropic. This measurement will be termed “distance residual autorefraction” for the remainder of the discussion of this study.
Next a high contrast target with both letters and pictures was suspended from the near-point rod of the Grand Seiko autorefractor at 33.33 cm (3D). The letters on the target ranged in size from 0.8 mm to 2.4 mm (approximately 20/32 to 20/100 Snellen equivalent at a 33 cm viewing distance) while the overall vertical size of the pictures was 13 mm and included multiple fine detail components as small as 0.8 mm in size. The subjects were instructed to look at the target and keep it clear while three repeated refraction measurements were taken over a series of seconds and then averaged. Accommodative demand was then increased by an examiner inserting minus lenses in the spectacle plane (13 mm) of the viewing eye of the subject in 1 D steps from −1 to −4 D in sequential order. For each minus lens, three repeated refraction measurements of the eye plus lens were taken through the lens and averaged.
The autorefractor was set to output both the spherical and cylindrical components of the refraction. For data analysis, all measurements were converted to the spherical equivalent (sphere + 1/2*cylinder). All demand and response values were referenced to the corneal plane using the effectivity formula presented by Mutti et al. (2000)18 for reconciling the effect of spectacle lenses on autorefractor readings.
Stimulus demands were determined by:
Autorefractor responses were determined by:
In the above formulas, 0.013 is the vertex distance in meters of lenses placed in front of the eye, DTE is the distance in meters of the target to the eye, Lens Power is the power of the minus lens place in front of the eye, REcornea is uncorrected distance refractive error at the corneal plane, and RawAR is the spherical equivalent of the accommodated autorefractor measurement of the eye plus lens set for the corneal plane.
After corrections were made for vertex distance, the demands tested were effectively: 3, 3.92, 4.80, 5.67, and 6.52 D. For each subject, the vertex corrected autorefractor response represented the point of focus of the eye for each stimulus demand and was termed the accommodative response. Lag was calculated as the difference between the stimulus demand and the effectivity adjusted autorefractor response. For the analysis of accommodative lag, individual subject accommodative response measurements were not corrected for the distance residual autorefraction measurements because the measurement of interest for the present study was the point of focus of the eye relative to the stimulus demand, rather than the total amount of accommodative effort exerted for each demand. Thus it should be noted that the term “accommodative response” does not include corrections for distance residual autorefraction measurements between subjects. However, distance residual autorefraction measurements were not ignored, but were considered in later analysis of factors accounting for differences in accommodative lag between subjects.
To measure maximum accommodative amplitude, minus lenses of increasing power beyond the -4 D lens were introduced in 1 D steps until each subject's accommodative response peaked or plateaued. Responses were adjusted for lens effectivity and the maximum accommodative amplitude was defined as the greatest amount of effectivity corrected autorefractor response combined with the distance residual autorefraction measurement. This technique has been previously described in detail in a study of maximum accommodative amplitude measured in response to minus lens blur as a function of age.12
To make comparisons between the accuracy of accommodative responses stimulated by minus lens blur versus proximal blur, a subset of the youngest subjects (aged 3 to 5 years) and a subset of young adults (aged 24 – 30 years) was tested first with the minus lens protocol described above, and then subsequently by viewing the same real, proximal target at decreasing distances of 33 cm to 16.67 cm in 1 D steps without the addition of minus lenses.
In this study, a range of print sizes and a picture were all presented on the near target which could potentially result in differences in measured lag depending on which part of the target each subject viewed. Previous studies have reported differences in accommodative responses related to the spatial frequency of the accommodative target; however, the findings of these studies are varied with conflicting ideas as to the ideal stimulus size for accurate accommodative responses.19-21 In the present study, adult subjects were not specifically instructed which part of the target to view; however, the youngest subjects were primarily encouraged to look at the pictures in an attempt to maintain their attention to the task, so it is likely that adult subjects and young children were viewing different parts of the target. If accommodative accuracy varies with the print sizes presented on the target in this study, differences in accommodative lag between subjects may be observed related to which part of the target each subject viewed.
To investigate this potential variable, nine young children (ages 3 to 7 years) and nine adults (ages 23 to 29 years) were tested and instructed precisely which part of the target to view. The measurements were obtained in the same manner as the minus lens-stimulated measurements described above, although for each stimulus demand, the subject was instructed to view each of the specific sizes of print (i.e., small 20/32 letters, large 20/100 letters, and the picture target) in random order. The first four stimulus demands were tested and the fifth demand (−4 D lens) was eliminated due to poor subject cooperation on the part of the youngest subjects whose attention to the task diminished after having completed the first 12 measurement conditions.
Data Analysis
First, accommodative lags were binned by age for all subjects (aged 3 to 38 years) and the averages plotted as a function of age for each stimulus demand to identify differences and trends in accommodative lag by age and demand. Next, accommodative lags from individual subjects aged 3 to 20 years were plotted as a function of age for each demand tested and fit with a linear regression to identify significant changes with age. The subgroup from 3 to 20 years was of interest because individuals in this age range have previously been reported to have similar maximum accommodative amplitudes when measured in response to minus lens stimulation12 and individuals in this age group would therefore not be predicted to have differences in accommodative lag attributable to differences in maximum accommodative amplitude.
A multi-level modeling technique was used to identify significant effects of four factors that might be predictive for differences of accommodative lag in subjects aged 3 to 20 years. The four factors tested were age, refractive error classification (myope versus emmetrope), distance residual autorefraction, and maximum accommodative amplitude. The multi-level modeling approach was selected due to the nested observations design of the study (i.e. the same subjects were tested at each stimulus demand and thus observations at each stimulus demand are related). This approach assures the correct standard errors are used despite the correlated observations from the nested observations. The statistical analysis was performed with the commercial analysis software SAS version 9.1.3 (SAS Institute, 2003) using the Proc Mixed analysis tool for the multi-level modeling technique as described by Singer (1998).22
To compare responses to lens stimulated accommodation versus proximal stimulated accommodation (in those subjects in whom both tests were performed) the stimulus response function for each subject was plotted for both the lens stimulus and the proximal stimulus. The accommodative error index (AEI) was then calculated for each subject. The AEI was chosen for the analysis due to the difference in effective demands tested between the lens stimulated and proximal stimulated conditions. The AEI avoids the complication of comparing different discrete demands by providing one value representing accommodative accuracy over a range of demands. This is calculated from the area between the 1:1 stimulus demand line and the linear regression fit to the subject's accommodative responses, divided by the coefficient of determination.23 A positive AEI indicates a lag of accommodation. The AEI was used to quantify the lag of accommodation for the two different conditions. It is expressed in diopters and is calculated using the formula:
where, m is the slope of the linear regression of the subject's accommodative responses, b is the intercept of the linear regression, x1 is the smallest demand tested, x2 is the largest demand tested, and R2 is the coefficient of determination which was greater than 0.98 for all of the linear fits used in the analysis. For the present study, the AEIs of the subjects were stratified by age group (preschool versus adult) and the lens stimulated and proximal stimulated conditions compared using a one-way ANOVA analysis.
RESULTS
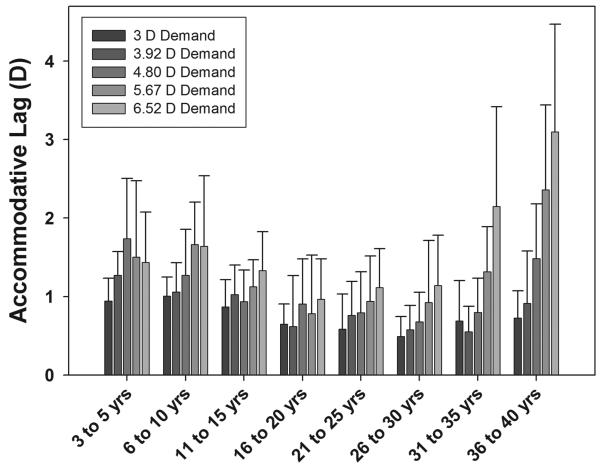
Accommodative lag from all subjects for each demand tested was averaged for each age-bin and the means plotted in figure 1. For the 3 D demand, the smallest lags were observed in subjects aged 26 to 30 and the largest lags were observed in the younger subjects (Figure 1). As stimulus demand increased, accommodative lags increased dramatically for the older subjects, as would be expected due to lower accommodative amplitudes in these subjects. However, for subjects aged 3 – 20 years over which accommodative amplitude was relatively constant and should not limit the magnitude of the response to the stimulus demands tested, accommodative lag actually decreased with increasing age for all stimulus demands.
Figure 1.
Mean accommodative lags for each 5 year age-bin (3-5 yrs n = 22, 6-10 yrs n = 12, 11-15 yrs n = 13, 16-20 yrs n = 10, 21-25 yrs n = 10, 26-30 yrs n = 15, 31-35 yrs n = 10, 36-40 yrs n = 10). Error bars show ±1 SD of average group responses. In general, lags increased with an increasing stimulus demand. Lags decreased with increasing age from 3 to 20 years.
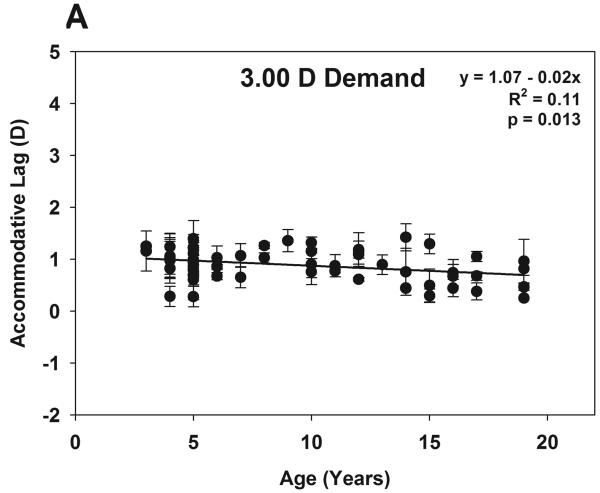
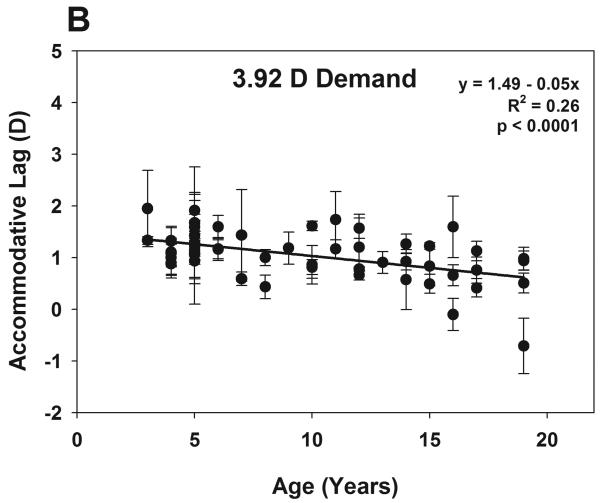
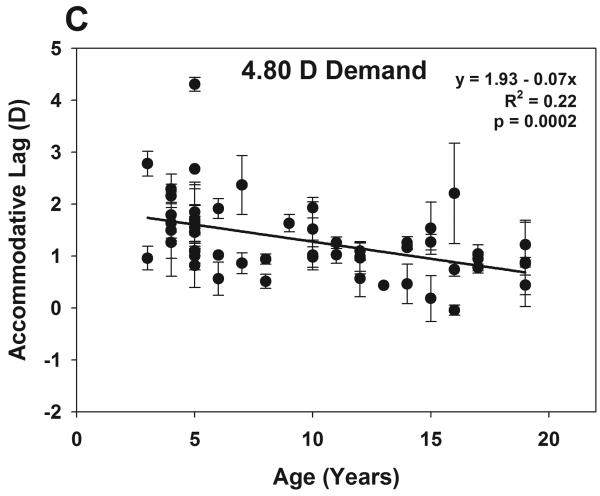
To investigate the trend observed in subjects aged 3 to 20 years, figure 2 (A-E) shows accommodative lags for each stimulus demand tested as a function of age for individual subjects aged 3 to 20 years (n = 57) with the mean and standard deviations of repeated measures shown. A linear regression fit to each set of data showed a significant decrease in accommodative lag with increasing age for the first four demands tested (p ≤ 0.013) and a linear decrease which approaches significance (p=0.053) for the greatest demand tested (6.52 D).
Figure 2.
Individual subjects' data (aged 3 to 20 yrs) for each stimulus demand tested (A-E). Error bars show ±1 SD for each subject for three repeated measurements. Accommodative lag showed a significant linear decrease with increasing age for the first four demands tested (p < 0.02) and approaches significance at the largest demand (p = 0.053).
In addition to age, refractive error classification, distance residual autorefraction, and maximum accommodative amplitude were considered as factors to explain variability in the 3 to 20 year old subjects' accommodative lags using the multi-level modeling approach.22 To perform the analysis, the nature of the relationship between accommodative lag and stimulus demand (linear or non-linear) must first be identified for the entire group. As a group, a significant linear fit described the accommodative stimulus vs accommodative lag functions of the subjects (p < 0.001), and a curvilinear fit approached significance (p = 0.067). Individual subjects' linear and curvilinear fits were then inspected and it was found that the curvilinear relationship observed for the entire group (p = 0.067) was driven by only four subjects (aged 5, 5, 16, & 19 years) who had significant curvilinear fits due to large variability in their lag measurements and a lack of a linear relationship. These four subjects were eliminated from further analysis as their responses were not in agreement with the significant linear trend observed for the overall group model. The remaining 53 subjects included 12 myopes and 41 emmetropes. The mean distance residual autorefraction for these subjects was 0.10 D ± 0.37 and there was no significant relationship with age or refractive error classification. The mean maximum accommodative amplitude was 7.24 D ± 1.16 and there was also no significant relationship with age or refractive error classification.
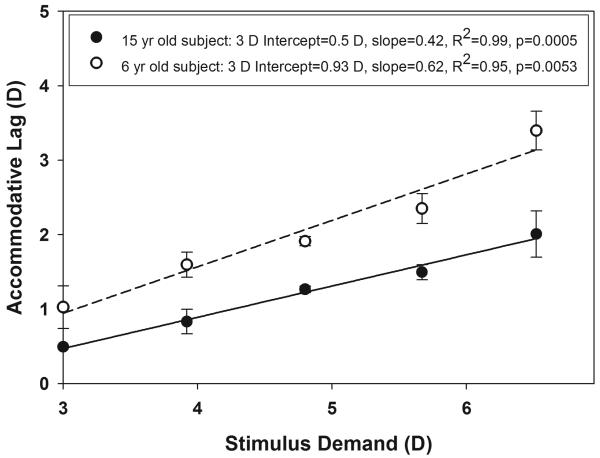
To continue the multi-level modeling analysis, an accommodative stimulus vs accommodative lag function was plotted for each individual subject with 3 D set as the start point of the x-axis (Figure 3). Using this approach, the 3 D intercept of each subject's linear function is equal to their lag for the 3 D demand, and the slope of the function represents the rate of increase in lag with increasing demand. The mean intercept and slope, or fixed effects are calculated for the group as a whole, and then the variances of both the 3 D intercepts and slopes of the individual subject linear functions, or random effects were estimated across subjects and models run to evaluate which factors might account for inter-subject variability. For predictions of slope, which is itself a description of the association between lag and demand, this is accomplished by using interaction terms which allow modeling of the variability in slopes as a function of the predictive factor of interest (i.e. age, refractive error classification, distance residual autorefraction, or maximum accommodative amplitude).
Figure 3.
An example of a single 15 year old subject's stimulus-lag function and a single 6 year old subject's stimulus-lag function used in the multi-level modeling analysis of factors predicting differences in lag among subjects aged 3 to 20 years.
Table 1 a and b show the results of the effect of age, refractive error classification, distance residual autorefraction, and maximum accommodative amplitude on the variability in the 3 D intercept and slope of the accommodative stimulus versus accommodative lag functions. Table 1A lists the effects of all four of the factors tested, while Table 1B shows the results when the non-significant factors are eliminated from the model. In Table 1B any factors which have significant interactions with demand (i.e. maximum amplitude) must also remain in the model for other comparisons to properly account for their portion of the estimate on variability. The results from the latter model provide the most accurate estimate of each factor's effect on subject variability. The outcome of the multi-level modeling analysis revealed a significant relationship between the 3 D intercept (lag at the 3 D demand) and subject age (p < 0.001) for subjects aged 3 to 20 years. As age increased from 3 years, lag at the 3 D demand decreased at a rate of −0.034 D per year. For example, the model predicts a 3 year old would have a lag of 1.16 D when viewing the 3 D demand, whereas a 20 year old would have a lag of 0.59 D (lag = 1.16 − 0.034 * (20-3)). There was no significant relationship between the 3 D intercept and refractive error classification, distance residual autorefraction, or maximum accommodative amplitude. For the entire group, the mean slope of the accommodative stimulus vs accommodative lag function was 0.146 indicating that lag increased by 0.146 D per diopter increase in stimulus demand. Inter-subject variability in slope for the first four minuses lenses was only significantly related to objectively measured, trial-lens stimulated maximum accommodative amplitude and not to the other three factors tested (p < 0.001). As maximum accommodative amplitude decreased from the group mean of 7.24 D, the slope of the accommodative stimulus vs accommodative lag function increased by 0.068 D per diopter decrease in maximum amplitude from the group mean. This indicates that lags increased at a greater rate with increasing stimulus demands for subjects with accommodative amplitudes lower than the mean. From the model, a subject with a maximum accommodative amplitude of 7.24 D would be predicted to have a slope of 0.146, whereas a subject with a maximum amplitude of 5.24 D would be predicted to have a slope of 0.282 (slope = [0.146 + {7.24 – 5.24 * (0.068)}]).
Table 1a.
Results of the multi-level modeling analysis to predict the factors which account for variability in the slope and intercept of the stimulus-lag functions for subjects aged 3 to 20 years.
| Factor | Estimate | SE | DF | t | p | |
|---|---|---|---|---|---|---|
|
Lag for 3 year old at 3D demand |
Intercept | 1.13 | 0.076 | 48 | 14.82 | <0.0001 |
|
Mean Slope |
Demand | 0.170 | 0.046 | 207 | 3.70 | 0.0003 |
|
Inter-Subject Variability in Intercept (Lag at 3 D demand) |
Age (centered at 3) | −0.037 | 0.0123 | 48 | −2.99 | 0.0044 |
| Max Amplitude (centered at 7.24 D) | −0.022 | 0.040 | 48 | −0.56 | 0.5812 | |
| Refractive Error (myope vs emmetrope) | 0.178 | 0.148 | 48 | 1.20 | 0.2358 | |
| Distance Residual AR | 0.027 | 0.120 | 48 | 0.23 | 0.8202 | |
| Inter-Subject Variability in Slope | Demand * Age (centered at 3) | −0.001 | 0.007 | 207 | −0.12 | 0.9042 |
| Demand * Max Amplitude (centered at 7.24 D) | −0.081 | 0.024 | 207 | −3.38 | 0.0009 | |
| Demand * Refractive Error (myope vs emmetrope) | −0.103 | 0.089 | 207 | −1.15 | 0.2506 | |
| Demand * Dist Residual AR | 0.048 | 0.072 | 207 | 0.66 | 0.5123 | |
Table 1b.
Results of the multi-level modeling analysis when all non-significant factors are eliminated.
| Factor | Estimate | SE | DF | t | p | |
|---|---|---|---|---|---|---|
|
Lag for 3 year old at 3D demand |
Intercept | 1.16 | 0.063 | 50 | 18.49 | <0.0001 |
|
Mean Slope |
Demand | 0.146 | 0.026 | 210 | 5.55 | <0.0001 |
|
Inter-Subject Variability in Intercept (Lag at 3 D demand) |
Age (centered at 3) | −0.034 | 0.007 | 50 | −4.83 | <0.0001 |
| Max Amplitude (centered at 7.24 D) | −0.039 | 0.039 | 50 | −1.02 | 0.313 | |
|
Inter-Subject Variability in Slope |
Demand * Max Amplitude (centered at 7.24 D) | −0.068 | 0.023 | 210 | −2.98 | 0.0032 |
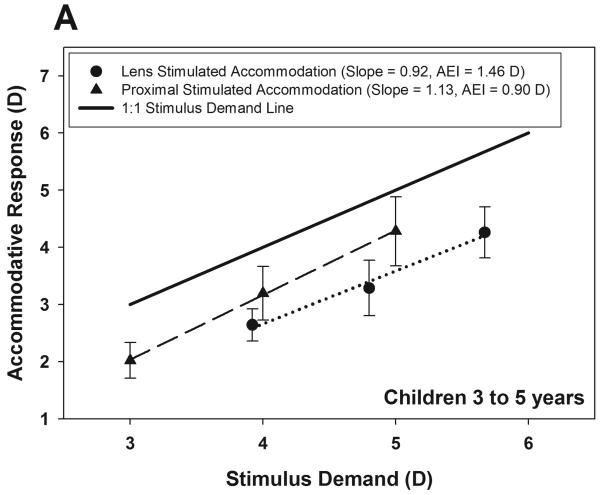
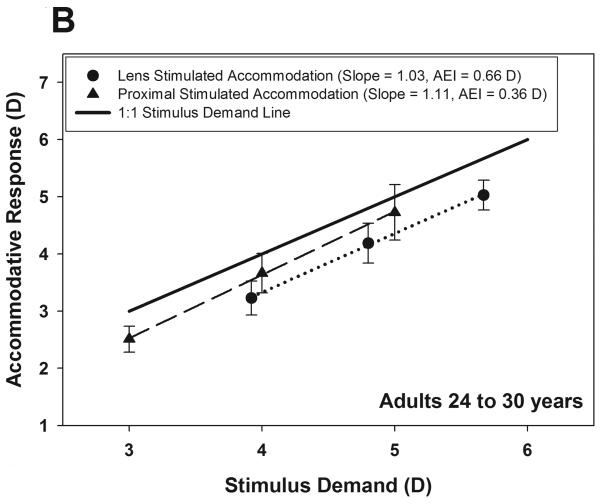
The comparison of proximal stimulated accommodation versus lens stimulated accommodation included 13 subjects aged 3 to 5 years and 10 subjects aged 24 to 30 years. The mean stimulus response functions of the two groups are shown in figures 4 A&B with the calculated AEI for each condition indicated. The AEI was largest for children with the lens stimulus condition (AEI = 1.46 D) and smallest for adults with the proximal stimulus condition (AEI = 0.36 D). Both children and adults had a larger AEI with the lens stimulus condition, and children had a larger average AEI than adults with both the lens and proximal conditions. One-way ANOVA analysis indicated significant differences between AEI when compared for the two age groups and testing conditions (F = 22.4, df = 3, 42, p < 0.0001). A post-hoc Scheffe's test indicated that AEI comparisons were significantly different between all conditions and ages (calculated F statistic > Fcrit = 2.83).
Figure 4.
Stimulus response functions for children (A) and adults (B) obtained by lens blur versus proximal blur. The AEI is the calculated accommodative error index and represents the area between the 1:1 line and the stimulus response curve divided by the coefficient of determination.
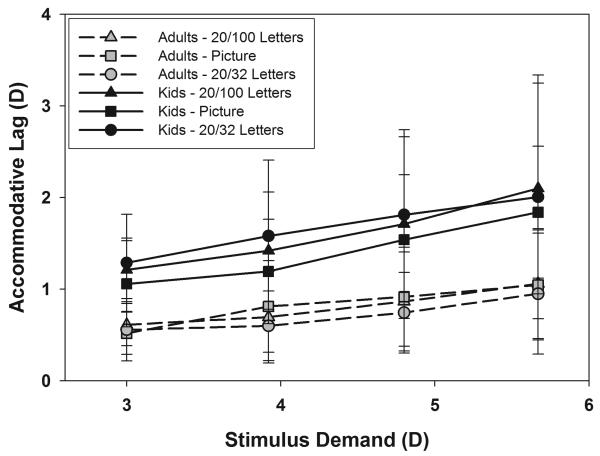
The results from the comparison of the target components (small print, large print, and the picture) are shown in figure 5. The accommodative lags of the young children were always greater than that of the adults, regardless of which target was viewed. This is consistent with the results shown in figure 2. These differences in lag were statistically significant for all target comparisons between young children and adults by Bonferonni adjusted one-way ANCOVA analysis (p ≤ 0.00005, F ≥ 20.66, df = 1.69). For the adults, mean accommodative lags were smallest when viewing the small letter size and largest when viewing the picture, although the differences in lag between targets were not statistically significant (Bonferonni adjusted one-way ANCOVA, p ≥ 0.32, F ≤ 1.01, df = 1, 69). For the young children, accommodative lags were smallest when viewing the picture and largest when viewing the small letter size, although the differences in lag between targets were also not statistically significant (Bonferonni adjusted one-way ANCOVA, p ≥ 0.15, F ≤ 2.15, df = 1, 69). These findings indicate that the age-related differences in accommodative lag observed in this study were unrelated to which portion of the target the subject viewed.
Figure 5.
Accommodative lag measured when subjects were given specific instructions on which part of the target to view. Group means ±1 SD are shown for 9 children aged 3 to 7 years and 9 adults aged 23 to 29 years.
DISCUSSION
The primary finding of interest from this study is that in the subjects from 3 to 20 years of age in whom minus lens stimulated maximum accommodative amplitude did not vary significantly, accommodative lag showed a significant linear decrease with increasing age. From the multi-level modeling analysis used in this study, accommodative lag was found to decrease at a rate of −0.034 D per year for the 3 to 20 year old subjects viewing the 3 D stimulus demand. However, the individual subjects' rate of change in accommodative lag with increasing stimulus demand (slope) did not vary significantly with subject age. Therefore since the lag for the 3 D demand varied as a function of age, but the rate of change in lag with increasing demand (slope) did not vary as a function of age, accommodative lag decreased with increasing age for all stimulus demands presented in subjects aged 3 to 20 years. It is important to note that these results were obtained under monocular viewing conditions and may not be predictive of results obtained under binocular viewing conditions.
Although the rate of change in lag with increasing demand (slope) did not vary as a function of subject age, slope did decrease significantly with decreasing maximum accommodative amplitude for subjects aged 3 to 20 years. The group mean accommodative amplitude for the subjects included in the model was 7.24 D and inter-subject variability in amplitude was unrelated to age. The slopes calculated for the model were based upon responses to stimulus demands ranging from 3 D to 6.52 D, and thus it is likely that the significant relationship observed between slope and maximum amplitude is due to the subjects whose maximum amplitudes were approached by the 6.52 D stimulus demand.
Prior studies have shown poorer accommodative responses to minus lens stimulated demands than proximally stimulated demands in preschool and school aged children using a distance target viewed through minus lenses.10,11 The present study found that adults also responded more accurately to proximal targets than minus lens blur (Figure 4B), although the differences were not as great as those of the young children. Thus it is possible that a portion of the age-related differences in accommodative lag observed in this study (Figure 2) might be explained by differences between young children and adults' abilities to accommodate accurately to minus lens stimulated demands. However, comparisons of accommodative lag between young children and adults were significantly different for both the minus lens and the proximal stimulus conditions with children always having larger average accommodative lags for both forms of stimulation (Figure 4A&B). Thus it is unlikely that the experimental method of stimulating accommodation with minus lenses can completely explain the age related differences in lags observed in this study.
It has recently been reported that there are small, but systematic measurement errors when using the Grand Seiko autorefractor combined with lenses in front of the subject's eye.24 Added lenses cause measurement errors which varied depending upon the lens power and the refractive status of the subject's eye (which was left uncorrected for study measurements).24 However, for all refractive groups, the measurement errors for minus lenses from −1 to −6 D were small (± 0.30 D).24 In the present study, all subjects were either emmetropic, or ammetropes corrected with contact lenses, with the exception that a few subjects could have been undetected low level hyperopes. In addition to limited uncorrected refractive errors, all subjects also had measurements recorded through the same minus lenses (−1 to −4 D), thus it is unlikely that the observed age-related differences in accommodative lag could be accounted for by between subject differences in measurement error. Additionally, age-related differences in accommodative lag were still present between the small subset of preschoolers and young adults who were tested with proximal targets only, a testing condition which would be free from measurement errors induced by lenses.
Accommodative lag to near stimuli, despite sufficient accommodative amplitude, is believed to be due in part to the depth of focus of the eye, or possibly ocular aberrations. The depth of focus of the eye is the amount of change in retinal image focus that can be tolerated without a perceptible change in blur of the retinal image. This is closely related to the depth of field of the eye which is the range over which a target can be moved in space without a perceptible change in blur of the image.25 Thus one might presume that differences in accommodative lag with age may be related to differences in depth of focus (or depth of field) with age. Unfortunately current techniques for measuring depth of field require good cooperation from the subjects and thus no known studies have been performed with young children, preventing this theory from being investigated directly. However, it is known that pupil diameter is one of the significant factors that impact depth of focus of the human eye,26-28 and so it is possible to make predictions about depth of field from pupil diameter.
In the present study, pupil diameter was not measured, which represents a limitation of the study; however, previous studies have reported increases in pupil diameter of approximately 1 to 2 mm from infancy to the teenage years.29,30 If a similar increase in pupil diameter with age occurred in the subjects in the present study, it would correlate with a decrease in depth of field with increasing age and a decrease in accommodative lag with increasing age that was observed in this study. Based on studies of pupil size and depth of field in adults; however, the impact of a 2 mm change in pupil size on the depth of field would not be large enough to account for the age-related differences in accommodative lag observed in this study (greatest difference = 0.83 D) given that the pupil would have to change from 1 to 8 mm to attain a predicted decrease in depth of field of approximately 0.70 D.26,27,31
The relationship between accommodative lag and higher order ocular wavefront aberrations has previously been explored32,33 and may provide another explanation for the age-related differences in accommodative lag observed in this study. Studies report that higher order aberrations change with increasing accommodation and also with increasing age.32,33 It has been suggested that an individual's lag of accommodation may maximize retinal image quality by balancing the defocus from higher order aberrations that increase with increasing accommodation.32 Thus, if age-related changes in higher order aberrations occur between the years of 3 – 20, this may offer an explanation for the differences in accommodative lag observed in these subjects. However, the role that pupil diameter plays must be considered, as it has also been shown that the pupil constriction associated with an increase in accommodation may decrease the impact of higher order aberrations during accommodation.33
As shown in figure 5, the age-related differences in accommodative lag could not be accounted for by differences in the various components of the printed target (text versus picture). In addition, all subjects were cooperative at placing their chin in the chinrest and fixating the target; however, it is possible that there were individual differences in subject motivation to bring the target into sharp focus. If differences in subject motivation and voluntary effort varied systematically with age, it could offer a possible explanation for some of the observed changes in accommodative lag with age.
This study did not find significant differences in accommodative lag between emmetropes and myopes between the ages of 3 to 20 years. However, previous studies have reported differences between these refractive groups.10,34,35 The subjects in the current study were not recruited specifically to compare differences between refractive groups and thus the number of myopes included in the refractive error analysis was small (n = 12) and may not have provided the power to detect differences between groups. In addition, analysis was performed across a wide range of ages (3 to 20) in which the distribution of refractive errors is not balanced due to the emergence of myopia in the school age years. The analysis of refractive error was included in this study to account for any potential impact of refractive error on the differences in accommodative lag observed with increasing age; however, the study was not designed specifically to investigate the question of accommodative lag and its relationship to refractive error.
CONCLUSIONS
Accommodative lag measured in response to minus lens stimulated blur decreased with increasing age from 3 to 20 years. The rate of increase of accommodative lag with increasing demand was significantly related to the maximum accommodative amplitude. These findings suggest that the accuracy of accommodation improves throughout the school aged years when stimulated with minus lenses. Both young preschool subjects and adult subjects responded more accurately to proximal blur than minus-lens stimulation; however, adult subjects had more accurate accommodative responses than preschool subjects for both proximal stimulated and lens stimulated demands, suggesting that age related improvement in accommodative accuracy may also occur for proximal stimuli.
ACKNOWLEDGMENTS
This work was funded by the Houston Area Vision Training Center Fellowship (NEI T35 EY007024) and an American Optometric Foundation William C. Ezell Fellowship. The results have previously been presented as a poster at the Association for Research in Vision and Ophthalmology Annual Meeting, April 2008 in Fort Lauderdale, Florida.
References
- 1.Braddick O, Atkinson J, French J, Howland HC. A photorefractive study of infant accommodation. Vision Res. 1979;19:1319–30. doi: 10.1016/0042-6989(79)90204-9. [DOI] [PubMed] [Google Scholar]
- 2.Banks MS. The development of visual accommodation during early infancy. Child Dev. 1980;51:646–66. [PubMed] [Google Scholar]
- 3.Howland HC, Dobson V, Sayles N. Accommodation in infants as measured by photorefraction. Vision Res. 1987;27:2141–52. doi: 10.1016/0042-6989(87)90128-3. [DOI] [PubMed] [Google Scholar]
- 4.Brookman KE. Ocular accommodation in human infants. Am J Optom Physiol Opt. 1983;60:91–9. doi: 10.1097/00006324-198302000-00001. [DOI] [PubMed] [Google Scholar]
- 5.Aslin RN, Shea SL, Metz HS. Use of the Canon R-1 autorefractor to measure refractive errors and accommodative responses in infants. Clin Vis Sci. 1990;5:61–70. [Google Scholar]
- 6.Rouse MW, Hutter RF, Shiftlett R. A normative study of the accommodative lag in elementary school children. Am J Optom Physiol Opt. 1984;61:693–7. doi: 10.1097/00006324-198411000-00008. [DOI] [PubMed] [Google Scholar]
- 7.Jackson TW, Goss DA. Variation and correlation of clinical tests of accommodative function in a sample of school-age children. J Am Optom Assoc. 1991;62:857–66. [PubMed] [Google Scholar]
- 8.McClelland JF, Saunders KJ. Accommodative lag using dynamic retinoscopy: age norms for school-age children. Optom Vis Sci. 2004;81:929–33. [PubMed] [Google Scholar]
- 9.Chen AH, O'Leary DJ. Are there age differences in the accommodative response curve between 3 and 14 years of age? Ophthalmic Physiol Opt. 2002;22:119–25. doi: 10.1046/j.1475-1313.2002.00015.x. [DOI] [PubMed] [Google Scholar]
- 10.Gwiazda J, Thorn F, Bauer J, Held R. Myopic children show insufficient accommodative response to blur. Invest Ophthalmol Vis Sci. 1993;34:690–4. [PubMed] [Google Scholar]
- 11.Chen AH, O'Leary DJ. Free-space accommodative response and minus lens-induced accommodative response in pre-school children. Optometry. 2000;71:454–8. [PubMed] [Google Scholar]
- 12.Anderson HA, Hentz G, Glasser A, Stuebing KK, Manny RE. Minus-lens-stimulated accommodative amplitude decreases sigmoidally with age: a study of objectively measured accommodative amplitudes from age 3. Invest Ophthalmol Vis Sci. 2008;49:2919–26. doi: 10.1167/iovs.07-1492. [DOI] [PMC free article] [PubMed] [Google Scholar]
- 13.Hofstetter HW. A comparison of Duane's and Donder's tables of the amplitude of accommodation. Am J Optom and Arch Am Acad Optom. 1944;21:345–62. [Google Scholar]
- 14.Bailey IL, Lovie JE. New design principles for visual acuity letter charts. Am J Optom Physiol Opt. 1976;53:740–5. doi: 10.1097/00006324-197611000-00006. [DOI] [PubMed] [Google Scholar]
- 15.Hyvarinen L, Nasanen R, Laurinen P. New visual acuity test for pre-school children. Acta Ophthalmol (Copenh) 1980;58:507–11. doi: 10.1111/j.1755-3768.1980.tb08291.x. [DOI] [PubMed] [Google Scholar]
- 16.Bowman RJC, Williamson TH, Andrews RGL, Atchison TC, Dutton GN. An inner city preschool visual screening programme: long term visual results. Br J Ophthalmol. 1998;82:543–8. doi: 10.1136/bjo.82.5.543. [DOI] [PMC free article] [PubMed] [Google Scholar]
- 17.Ellemberg D, Lewis TL, Liu CH, Maurer D. Development of spatial and temporal vision during childhood. Vision Res. 1999;39:2325–33. doi: 10.1016/s0042-6989(98)00280-6. [DOI] [PubMed] [Google Scholar]
- 18.Mutti DO, Jones LA, Moeschberger ML, Zadnik K. AC/A ratio, age, and refractive error in children. Invest Ophthalmol Vis Sci. 2000;41:2469–78. [PubMed] [Google Scholar]
- 19.Charman WN, Tucker J. Dependence of accommodation response on the spatial frequency spectrum of the observed object. Vision Res. 1977;17:129–39. doi: 10.1016/0042-6989(77)90211-5. [DOI] [PubMed] [Google Scholar]
- 20.Owens DA. A comparison of accommodative responsiveness and contrast sensitivity for sinusoidal gratings. Vision Res. 1980;20:159–67. doi: 10.1016/0042-6989(80)90158-3. [DOI] [PubMed] [Google Scholar]
- 21.Tan RK, O'Leary DJ. Steady-state accommodation response to different Snellen letter sizes. Am J Optom Physiol Opt. 1985;62:751–4. doi: 10.1097/00006324-198511000-00005. [DOI] [PubMed] [Google Scholar]
- 22.Singer JD. Using SAS PROC MIXED to fit multilevel models, hierarchical models, and individual growth models. J Educ Behav Stat. 1998;23:323–55. [Google Scholar]
- 23.Chauhan K, Charman WN. Single figure indices for the steady-state accommodative response. Ophthalmic Physiol Opt. 1995;15:217–21. doi: 10.1016/0275-5408(95)90573-k. [DOI] [PubMed] [Google Scholar]
- 24.Kimura S, Hasebe S, Ohtsuki H. Systematic measurement errors involved in over-refraction using an autorefractor (Grand-Seiko WV-500): is measurement of accommodative lag through spectacle lenses valid? Ophthalmic Physiol Opt. 2007;27:281–6. doi: 10.1111/j.1475-1313.2007.00466.x. [DOI] [PubMed] [Google Scholar]
- 25.Glasser A, Kaufman PL. Accommodation and presbyopia. In: Kaufman PL, Alm A, editors. Adler's Physiology of the Eye: Clinical Application. 10th ed. Mosby; St. Louis, MO: 2003. pp. 197–233. [Google Scholar]
- 26.Campbell FW. The depth of field of the human eye. Optica Acta. 1957;4:157–64. [Google Scholar]
- 27.Charman WN, Whitefoot H. Pupil diameter and the depth-of-field of the human eye as measured by laser speckle. Optica Acta. 1977;24:1211–6. [Google Scholar]
- 28.Ogle KN, Schwartz JT. Depth of focus of the human eye. J Opt Soc Am. 1959;49:273–80. doi: 10.1364/josa.49.000273. [DOI] [PubMed] [Google Scholar]
- 29.MacLachlan C, Howland HC. Normal values and standard deviations for pupil diameter and interpupillary distance in subjects aged 1 month to 19 years. Ophthalmic Physiol Opt. 2002;22:175–82. doi: 10.1046/j.1475-1313.2002.00023.x. [DOI] [PubMed] [Google Scholar]
- 30.Kohnen EM, Zubcov AA, Kohnen T. Scotopic pupil size in a normal pediatric population using infrared pupillometry. Graefes Arch Clin Exp Ophthalmol. 2004;242:18–23. doi: 10.1007/s00417-003-0735-4. [DOI] [PubMed] [Google Scholar]
- 31.Atchison DA, Charman WN, Woods RL. Subjective depth-of-focus of the eye. Optom Vis Sci. 1997;74:511–20. doi: 10.1097/00006324-199707000-00019. [DOI] [PubMed] [Google Scholar]
- 32.Buehren T, Collins MJ. Accommodation stimulus-response function and retinal image quality. Vision Res. 2006;46:1633–45. doi: 10.1016/j.visres.2005.06.009. [DOI] [PubMed] [Google Scholar]
- 33.Lopez-Gil N, Fernandez-Sanchez V, Legras R, Montes-Mico R, Lara F, Nguyen-Khoa JL. Accommodation-related changes in monochromatic aberrations of the human eye as a function of age. Invest Ophthalmol Vis Sci. 2008;49:1736–43. doi: 10.1167/iovs.06-0802. [DOI] [PubMed] [Google Scholar]
- 34.Nakatsuka C, Hasebe S, Nonaka F, Ohtsuki H. Accommodative lag under habitual seeing conditions: comparison between myopic and emmetropic children. Jpn J Ophthalmol. 2005;49:189–94. doi: 10.1007/s10384-004-0175-7. [DOI] [PubMed] [Google Scholar]
- 35.Mutti DO. Spectacle prescriptions for preschool children. J Aapos. 2005;9:299. doi: 10.1016/j.jaapos.2005.01.004. [DOI] [PubMed] [Google Scholar]


