

Abstract
Post-mortem morphometric studies report reductions in the average density and size of cortical neurons in the dorsolateral prefrontal cortex (dlPFC) and orbitofrontal cortex (ORB) in major depressive disorder (MDD). The contribution of specific neuronal phenotypes to this general pathology in depression is still unclear. Post-mortem sections from the dlPFC and ORB regions of 14 subjects with MDD and 11 controls were immunostained to visualize calbindin-immunoreactive (CB-IR) and parvalbumin-immunoreactive (PV-IR) presumptive GABAergic neurons. A three-dimensional cell counting probe was used to assess the cell packing density and size of CB-IR neurons in layers II + IIIa and PV-IR neurons in layers III–VI. The density of CB-IR neurons was significantly reduced by 50% in depression in the dlPFC and there was a trend toward reduction in the ORB. The size of CB-IR somata was significantly decreased (18%) in depression in the dlPFC with a trend toward reduction in the ORB. In contrast, there was no difference in the density of PV-IR neurons between the depressed and control groups in the dlPFC. The size of PV-IR neuronal soma was unchanged in depressed compared to control subjects in either dlPFC or ORB. In depression, subpopulations of GABAergic neurons may be affected differently in dlPFC and ORB. A significant reduction in the density and size of GABAergic interneurons immunoreactive for calcium binding proteins was found predominantly in the dlPFC region. These cellular changes are consistent with recent neuroimaging studies revealing a reduction in the cortical levels of GABA in depression.
Keywords: post-mortem, morphometry, interneurons, dorsolateral prefrontal cortex, orbitofrontal cortex
Introduction
Morphometric studies in post-mortem tissue have demonstrated reductions in the average density and size of Nissl-stained neurons in the dorsolateral prefrontal cortex (dlPFC) and orbitofrontal cortex (ORB) in major depressive disorder (MDD) (Cotter et al, 2002b, 2005; Rajkowska et al, 1999). The neuronal pathology was most prominent in layer II of ORB and in layers II, III, V, and VI of dlPFC. However, the specific neuronal cell types contributing to this general pathology in depression are unclear.
Our recent study on presumably glutamatergic pyramidal neurons in layer III stained with a specific antibody against neurofilament protein NF200 revealed no significant change in this subpopulation of neurons in dlPFC of subjects with MDD as compared to nonpsychiatric controls or subjects with schizophrenia (Miguel-Hidalgo et al, 2005). By contrast, in another study on elderly depressed subjects, our observation of a significant reduction in the density of neurons with pyramidal morphology in the ORB suggests a deficit in glutamatergic neurons (Rajkowska et al, 2005).
Other studies of post-mortem human and primate cerebral cortex have identified three distinct subpopulations of nonpyramidal GABAergic neurons that can be identified with antibodies specific to calcium binding proteins: calbindin-D28k (CB), parvalbumin (PV), and calretinin (Beasley et al, 2002; Conde et al, 1994; Cotter et al, 2002a; DeFelipe, 1997; Uylings et al, 2002; Zaitsev et al, 2005). Only two human post-mortem studies have investigated these neuronal subpopulations in depression (Beasley et al, 2002; Cotter et al, 2002a). Both studies were carried out in the same cohort of psychiatric subjects, one in the dlPFC (Beasley et al, 2002) and the other in the anterior cingulate cortex (Cotter et al, 2002a). The low number of subjects studied (per each cerebral hemisphere) and the use of two-dimensional counting techniques were limitations in both of these studies. No significant differences in the density of calbindin-immunoreactive (CB-IR) or parvalbumin-immunoreactive (PV-IR) GABAergic neurons were found between MDD and control groups in either cortical region. However, clinical evidence is emerging to suggest that MDD is associated with reduced levels of GABA in the plasma, cerebrospinal fluid, and neocortex (Petty, 1995; Sanacora et al, 1999, 2000, 2004). A proton magnetic resonance spectroscopy study revealed a large, 52% reduction in GABA levels in the occipital cortex of 14 medication-free depressed subjects as compared to 18 healthy control subjects (Sanacora et al, 1999). Later studies by the same investigators demonstrated that low levels of GABA in the occipital cortex in depressed patients can be reversed by treatment with selective serotonin reuptake inhibitors (SSRIs) or ECT (Sanacora et al, 2002, 2003a). Interestingly, in the occipital cortex of healthy controls, SSRI treatment also results in the acute elevation of GABA (Bhagwagar et al, 2004b).
In light of clinical observations of altered GABA levels in depression and the limitations in studies of GABAergic neurons in post-mortem tissue, the goal of this study was to re-examine the pathology of subpopulations of GABAergic neurons in a new cohort of subjects with MDD. Immunohistochemistry and a three-dimensional (3-D) cell counting technique were used to assess the cell packing density and size of CB-IR and PV-IR GABAergic neurons in depression. Either one or both of these neuronal subtypes are altered in the frontal cortex in schizophrenia (Beasley and Reynolds, 1997; Beasley et al, 2002; Cotter et al, 2002a; Daviss and Lewis, 1995; Iritani et al, 1999; Kalus et al, 1997; Reynolds and Beasley, 2001) or bipolar disorder (Beasley et al, 2002; Benes and Berretta, 2001; Cotter et al, 2002a). Previous studies have not identified significant changes in the density of calretinin-IR neurons either in MDD or schizophrenia (Daviss and Lewis, 1995; Reynolds and Beasley, 2001). Therefore, as we had a limited number of prefrontal sections available per subject we chose not to include calretinin in our study.
It was hypothesized that the density and size of CB-IR and PV-IR neurons would be altered in depression in prefrontal cortex (dlPFC and ORB), as reductions in the neuronal density and size of the Nissl-stained general population of neurons have previously been reported in these regions in MDD (Cotter et al, 2002b; Rajkowska et al, 1999, 2005). It was also hypothesized that alterations in features of CB-IR and PV-IR neurons would differ between the two prefrontal regions, in light of the distinct laminar distribution for each of the two types of neuron.
Materials and Methods
Human Subjects
Post-mortem brain samples were collected at autopsy from 25 subjects at the Cuyahoga County Coroner's Office in Cleveland, OH. Informed written consent was collected from the legal next-of-kin of all subjects. Next-of-kin were interviewed and retrospective psychiatric assessments were conducted in accordance with Institutional Review Board policies as described previously (Rajkowska et al, 1999; Stockmeier et al, 2004). Fourteen subjects met clinical criteria for MDD, and 11 subjects did not meet criteria for an Axis I disorder (termed normal controls) based on the Diagnostic and Statistic Manual of Mental Disorders— Revised DSM-IV (see Tables 1 and 2). A trained interviewer administered one of two structured clinical interviews to next-of-kin of subjects in the study. Diagnoses for Axis I disorders were assessed independently by a clinical psychologist and a psychiatrist, and consensus diagnosis was reached in conference, using all available information from the knowledgeable informants, the coroner's office, and previous hospitalizations and doctors' records. Kelly and Mann (1996) have validated the use of the so-called psychiatric autopsy by demonstrating good agreement between informant-based retrospective psychiatric assessments of deceased subjects and chart diagnoses generated by clinicians treating the same subjects before death. Subjects met diagnostic criteria for MDD within the last month of life. Among 14 depressed individuals, nine were suicide victims, whereas the other five died of natural causes (two), homicide (one), or as a result of a car accident (two), (Table 2). Six of depressed subjects had a recent or past diagnosis of a psychoactive substance use disorder (Table 2). Removal of these subjects from the analysis did not significantly alter the results or conclusions of this study.
Table 1.
Summary of Subject Groups
| A9 calbindin | A9 parvalbumin | A47 calbindin | A47 parvalbumin | |||||
|---|---|---|---|---|---|---|---|---|
| Variables | Control | MDD | Control | MDD | Control | MDD | Control | MDD |
| Age/years (mean±SD) | 49.1±17.9 | 55.7±18.3 | 49.1±17.9 | 56.5±18.8 | 41.2±12.7 | 48.9±11.7 | 49.1±17.9 | 55.7±18.3 |
| Gender | 8M, 3F | 8M, 6F | 8M, 3F | 7M, 6F | 2M, 6F | 4M, 6F | 8M, 3F | 8M, 6F |
| Suicide/nonsuicide | 11N | 9S, 5N | 11N | 8S, 5N | 8N | 4S, 6N | 11N | 9S, 5N |
| PMI/h (mean±SD) | 19.4±5.8 | 21.6±4.8 | 19.4±5.8 | 21±4.5 | 17.6±7.6 | 22.6±3.7 | 19.4±5.8 | 21.6±4.8 |
| TF/months (mean±SD) | 23.8±15.7 | 10.97±3.9 | 23.8±15.7 | 10.7±3.9 | 25.4±13.4 | 18.7±14.7 | 28.8±19.8 | 15.8±13.3 |
| Time in ethanol/months (mean±SD) | 35.1±22.8 | 46.2±27.5 | 64.9±17.7 | 75.3±11.7 | 43.7±25.2 | 56.6±18.6 | 72.7±13.4 | 75.2±17.7 |
| pH (mean±SD) | 6.73±0.19 | 6.53±0.26 | 6.73±0.19 | 6.5±0.25 | 6.82±0.14 | 6.49±0.24 | 6.73±0.19 | 6.53±0.26 |
Table 2.
Characteristics of Individual Subjects
| MDD | Age (years)/ gender/race |
PMI | pH | Cause of death |
Medicationa | Toxicology | Drugs/ alcohb |
Comorbid diagnosis |
Family history |
Duration of illness (years)c |
Hospitald | Smoker |
|---|---|---|---|---|---|---|---|---|---|---|---|---|
| 1 | 34/F/C | 27.0 | 6.27 | S | Trazodone, ALPRAZOLAM, risperidone, AMOXICILLIN, VALPROIC ACID, NITROFURINTOIN | CO, EtOH-blood, alprazolam | None | None | NA | 20 | Several | No |
| 2 | 30/M/AAm | 18.0 | 6.91 | S | NA | EtOH-blood | Hx AA | Borderline personality disorder | AD, MD, S, SA | 3 | 3 | Yes |
| 3 | 40/F/C | 25.0 | 6.32 | N+Ac | TEMAZEPAM, FLUOXETINE, HYDROCODONE, etodolac | Morphine, codeine, hydrocodone, diphenhydramine | DA | None | AD, DA | 5 | 0 | No |
| 4 | 42/F/C | 24.0 | 6.62 | S | FLUOXETINE, AMITRIP, PAROXETINE, PROPOXY, DIAZEPAM, FUROSEMIDE | Propoxyphene, acetaminophen | PS, DA | Bulimia nervosa | AD | 26 | 2 | No |
| 5 | 42/M/C | 20.0 | 6.64 | S | SERTRALINE | Sertraline, diphenhydramine | None | None | MD, SA | 0.25 | 0 | No |
| 6 | 46/M/AAm | 17.0 | 6.26 | H | None | Clean | NA | None | SA | 1 | 0 | No |
| 7 | 54/M/C | 23.0 | 6.24 | Ac | SERTRALINE | CO, phenobarbital, phenytoin | None | None | AD | 3 | 6 | Hx |
| 8 | 63/F/C | 24.0 | 6.32 | N | CHLORPROMAZINE, CLONAZEPAM, AMITRIP, AMANTIDINE | Amitrip., chlorpromazine, amantadine, lidocaine | PS, DA, AD | AD, I | 30 | 8 | Yes | |
| 9 | 73/M/C | 10.0 | 6.57 | S | NORTRIPTYLINE | Nortriptyline | None | OCPD | None | 5 | 0 | Yes |
| 10 | 73/F/C | 17.0 | 6.57 | N | Lithium carbonate, NORTRIP, restoril, CLONAZEPAM, levothyroxine | Clean | Hx AD | Panic attacks | AD, MD, SA | 50 | 35 | Yes |
| 11 | 86/M/C | 21.0 | 6.23 | S | FLUOXETINE, ATENOLOL, leuprolide acetate | Clean | None | None | S | 20 | 3 | Quit in 1929 |
| 12 | 74/M/C | 25.0 | 6.67 | S | Chlorpromazine, trazodone, clorazepate, methylphenidate, pentazocine, quinapril, diphenoxylate, hydrosine, dyazide, captopril, alupent, betamethazone, prednisone | Diazepam, acetominophen | None | None | AA | 24 | 1 | |
| 13 | 78/F/C | 25.0 | 6.94 | S | Lorazepam | Clean | NA | Pathological gambling | None | 5 | 0 | No |
| 14 | 45/M/C | 29.0 | 6.86 | S | Methylphenidate | EtOH 0.11 blood | AA, DA | AA, PS | 7 | 0 | Hx | |
| CNTL | Age (years)/gender/race | PMI | pH | Cause of death | Medication | Toxicology | Drugs/alcohb | Comorbid diagnosis | Family history | Duration of illness (years) | Hospitald | Smoker |
| 1 | 24/M/AAm | 15.0 | 6.84 | H | None | Clean | None | AD | No | |||
| 2 | 27/F/C | 15.0 | 7.01 | N | Enalapril, metoprolol, captopril, lopressor | Clean | None | None | No | |||
| 3 | 30/F/C | 9.0 | 6.75 | N | None | Clean | NA | NA | NA | |||
| 4 | 47/M/C | 17.0 | 6.89 | N | None | Clean | None | AA | Yes | |||
| 5 | 71/M/C | 24.0 | 6.82 | N | None | Clean | ADe | AA | Yes | |||
| 6 | 42/M/C | 20.0 | 6.82 | N | None | Clean | None | MDD | Hx | |||
| 7 | 50/F/C | 27.0 | 6.74 | N | None | Clean | None | None | Yes | |||
| 8 | 51/M/C | 28.0 | 6.64 | N | None | Clean | None | AD, MDD, SA | Yes | |||
| 9 | 52/M/C | 17.0 | 6.87 | N | Cholesterol-lowering drug | Clean | None | None | No | |||
| 10 | 69/M/C | 18.0 | 6.70 | N | None | Clean | None | AA, MDD | No | |||
| 11 | 77/M/C | 24.0 | 6.56 | N | Glyburide, maxide, atenolol | Clean | None | DA | No | |||
AA = alcohol abuse; AAm = African American; Ac = accident; AD = alcohol dependence; Amitrip. = amitriptyline; C = Caucasian; CNTL = control; DA = drug abuse; EtOH = ethanol; H = homicide; Hx = history; I = institutionalized; MDD = major depressive disorder; N = natural; NA = not available; Nortrip = nortripyline; OCPD = obsessive compulsive personality disorder; PD = polysubstance dependence; PMI = post-mortem interval (h); defined as the time between the time of death and the beginning of the formalin-fixation process; PS = polysubstance abuse; S = suicide; SA = suicide attempt; TF = time in formalin (months).
Capitalized drugs were prescribed in last month of life.
Defined as psychoactive substance use disorder.
The duration of illness covers the time between the first display (and not necessarily diagnosis) of symptoms of a depressive illness and the time of death.
The number of recorded hospitalizations related to depression.
History of alcohol dependence 32 years before death.
The control subjects were matched with the depressed subjects for age, gender, ethnicity, post-mortem interval (PMI), time in formalin (TF), and brain tissue pH (Tables 1 and 2).
Limited numbers of sections in area 9 permitted analysis of PV-IR in 13 of the 14 depressed subjects. In the analysis of CB-IR in area 47, only eight control and 10 depressed subjects were used owing to a limited number of sections available.
Tissue Preparation
Tissue was collected at autopsy and fixed in phosphate-buffered formalin (10%) as described previously (Rajkowska et al, 1999). Blocks of tissue from the left prefrontal cortex of each subject were embedded in 12% celloidin. Morphometric parameters (cell density and cell size) were measured in two prefrontal regions, ORB (Brodmann's area 47) and dlPFC (Brodmann's area 9), see middle picture on Figure 1. The tissue blocks were sectioned at a thickness of 40 μm, and stained with either Nissl substance or stained immunohistochemically using antibodies to calbindin-D28K or PV. Nissl-stained sections were used to identify areas 9 and 47 and their individual cortical layers according to cytoarchitectonic criteria described previously (Rajkowska and Goldman-Rakic, 1995a, b; Uylings et al, 2006). Nissl-stained sections were then used to draw the boundaries between individual cortical layers. These laminar boundaries were imposed as guides on the immunostained sections to determine the laminar distribution of immunoreactive cells. These boundaries were transferred to the immunostained sections by first obtaining images of the region of interest in both the Nissl and the immunostained sections and then outlining the cortical surface and the border between layer VI and the white matter (this border is easily visible both in Nissl and immunostained sections). Then the boundaries between cortical layers in the Nissl sections were drawn and at five points along the cortical surface line, the perpendicular distance to each of the boundaries between layers was measured. Accounting for the thickness of the cortex in each of the immunostained sections, we then marked the borders between cortical layers and obtained the boundaries between layers in the immunostained section by linking the points at each border. These laminar boundaries were then used to identify the borders between superficial cortical layers II + IIIa on the sections immunoreactive for CB, and layers III–VI on the sections immunoreactive for PV. The majority (12 MDD and seven controls) of subjects investigated in our 1999 study (Rajkowska et al, 1999) were also included in the present study.
Figure 1.
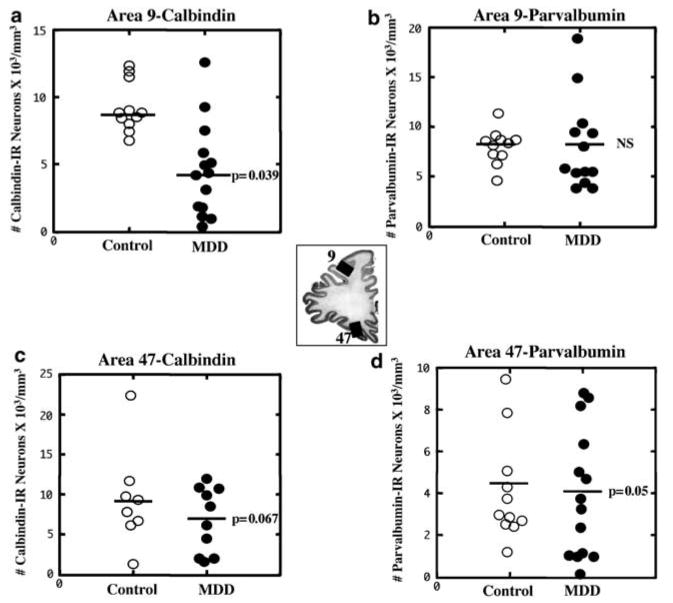
Comparison of the cell packing density of CB-IR (a and c) and PV-IR (b and d) neurons in Brodmann's areas 9 and 47 (see the middle picture for the localization of these areas) of control subjects and subjects with MDD. A significant 50% reduction in the density of CB-IR neurons in Brodmann's area 9 in MDD subjects (a) and a 27% trend toward a reduction in CB-IR (c) and PV-IR neurons (d) in Brodmann's area 47 are illustrated. Values for the individual subjects (circles) and mean values (horizontal lines) are given without the adjustment for the covariates.
Immunocytochemistry
Originally celloidin-embedded tissue was immunostained after the removal of celloidin (Miguel-Hidalgo and Rajkowska, 1999). The sections were incubated with a rabbit polyclonal anti-calbindin-D28K antibody at 1 : 750 dilution (Chemicon International Inc., AB1778), or a mouse monoclonal anti-PV antibody at 1 : 1000 dilution (Sigma, S-5768). Binding of these antibodies was detected with a secondary antibody according to the ABC method (ABC kit, Vector Laboratories, CA).
The immunostained sections were adjacent to or within 200 μm of the Nissl stained sections used for the identification of the relevant areas. To minimize the variability in the intensity of staining, each staining experiment included simultaneously processed sections from both groups of subjects. For each subject, three coronal sections per area and per marker were used for morphometric analyses.
Morphometric Analyses
The counting and size measurements of CB-IR and PV-IR neurons were carried out by two investigators (GO and ZT), naive to the diagnoses. Owing to differences in the laminar distribution of CB-IR as compared to PV-IR interneurons described in monkey and human prefrontal cortex (Conde et al, 1994; Miguel-Hidalgo and Rajkowska, 1999), CB-IR neurons were analyzed in superficial layer II and upper part of layer III, the sites of greatest prominence. PV-IR neurons were counted in layers III–VI where they are present in the highest density.
The density of CB–IR and PV-IR neurons was estimated with a × 40 oil immersion objective (1.0 numerical aperture) using the ‘Optical Fractionator’ probe of Stereo Investigator software (5.00 Beta 2, MicroBrightField Inc.). For the study of CB-IR neurons, 40–60 3-D counting boxes (120 × 100 × 15 μm; 1 μm guard zone from the top surface of the section) were placed in each section randomly within the contour outlining layers II + IIIa. For the analysis of PV-IR neurons, 100–130 3-D counting boxes (75 × 51 × 15 μm; 1 μm guard zone from the top) were placed within the outline combining layers III, IV, V, and VI. The packing density of immunoreactive cells was calculated in each section by dividing the total cell count in all the counting boxes by the combined volume of all the counting boxes. The size of CB-IR and PV-IR neurons was estimated by measuring the volume of immunoreactive cell bodies with the ‘Nucleator’ probe of the Stereo Investigator software.
Statistical Analyses
Mean values for cell density and neuronal size (somal volume) obtained from the three sections per brain/per marker were compared between the groups using analysis of covariance (ANCOVA) with age, PMI, storage TF, storage time in ethanol, and brain tissue pH as covariates. Pearson correlation matrices were used to define the influence of confounding variables (age, PMI, TF, time in ethanol, pH) on neuronal density and size.
Results
Area 9
CB-IR neurons
The density of CB-IR neurons was significantly reduced by 50% in the group of depressed subjects (mean ± SD without adjusting for the covariates: 4.6 ± 3.4) as compared to the age-matched control group (9.3 ± 1.7) (ANCOVA with post-mortem delay, TF, time in ethanol, age at the time of death, and tissue pH as covariates; F(1, 18) = 4.948, p = 0.039; Figures 1a and 2a, b). The average size of CB-IR cell bodies was also smaller by 18% in the depressed subjects (461.0 ± 113.6) as compared to the controls (565.2 ± 69.3; ANCOVA F(1, 18) = 5.745, p = 0.028). Comparison of neuronal density and size of CB-IR neurons between a subgroup of depressed suicide victims and depressed nonsuicide subjects revealed no significant differences in any of these parameters between the two subgroups. However, both of these subgroups of depressed subjects had significantly lower values of neuronal density (ANOVA: F(2, 22) = 8.305, p = 0.002; post hoc Tukey's test for comparison between suicides and controls: p = 0.008; nonsuicides vs controls: p = 0.007) and size (ANOVA: F(2, 22) = 3.454, p = 0.05; post hoc Tukey's test for suicides vs controls: p = 0.106; nonsuicides vs controls: p = 0.09) than the normal control subjects.
Figure 2.
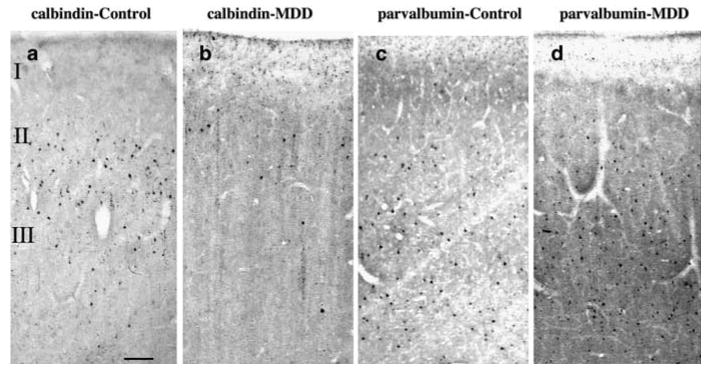
Photomicrographs of one pair of age-matched control and MDD subjects showing CB (a and b) and PV (c and d) immunoreactive neurons in the upper two-thirds of the cortical width in Brodmann's area 9 of the dlPFC. Note that CB-IR neurons are localized in upper cortical layers II + IIIa (a and b), whereas PV-IR neurons are more numerous and have a wider distribution across middle and lower cortical layers III–VI (c and d). Although adjacent sections from area 9 were used for each of the markers, there is a 50% reduction in CB-IR neurons in MDD as compared to control subjects, whereas no differences in PV-IR neurons were observed between the groups. Images were obtained using the × 4 objective, scale bar = 125 μm.
The density as well as size of CB-IR neurons was negatively correlated with age in the depressed subjects only (density: r = −0.561, p = 0.037; size: r = −0.563, p = 0.036) and not in the control group Figure 3 (density: r = −0.256, p = 0.447; size: r = −0.568, p = 0.068). However, when we split the depressed group into suicide (n = 9) and nonsuicide subgroups (n = 5) this correlation remain nearly significant only in the depressed suicide subgroup (suicides: neuronal density: r = −0.638, p = 0.065; neuronal size: r = −0.654, p = 0.056; nonsuicides: neuronal density: r = −0.280, p = 0.648; neuronal size: r = −0.458, p = 0.438). Moreover, there was a nonsignificant trend (r = −0.477, p = 0.085) for an inverse correlation between the density of CB neurons in area 9 and the duration of depression. The longer the duration of illness, the lower the density. The three subjects with the shortest duration (3 months, 1 year, and 5 years, respectively) had the highest density values.
Figure 3.
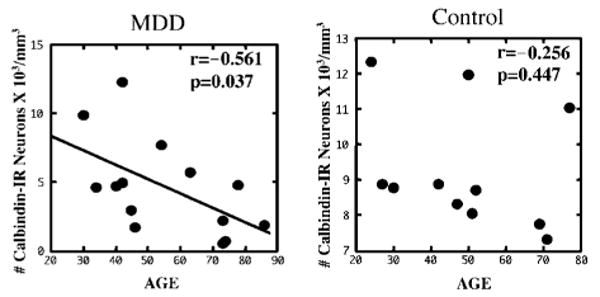
Scatter plot illustrating the relationship between the density of CB-IR neurons in area 9 and age at the time of death. Note that the density of CB-IR neurons was significantly inversely correlated with age in the MDD group but not in the control group.
The size of CB-IR neurons was negatively correlated with TF in control subjects (r = −0.619, p = 0.042). However, none of the above-mentioned correlations were statistically significant after applying the Bonferroni correction for multiple comparisons. There were no other significant correlations between the density or size of CB-IR neurons and other confounding variables such as post-mortem delay, TF, time in ethanol, and tissue pH in any of the cohorts.
PV-IR neurons
The packing density of PV-IR neurons in area 9 in the depressed subjects (mean ± SD: 8.0 ± 4.4) was nearly identical to that of the control group (8.0 ± 1.9, Figures 1b and 2c, d) (ANCOVA: F(1, 17) = 0.270, p = 0.610). Likewise, the size of PV-IR cell bodies was similar between the depressed (652.770 ± 121.692) and control groups (700.4 ± 86.1) (ANCOVA: F(1, 17) = 0.030, p = 0.865).
Area 47
CB-IR neurons
There were no significant differences between depressed and control groups in the packing density (mean ± SD, MDD: 6.9 ± 4.1; controls: 9.3 ± 6.0) or size (mean ± SD, MDD: 448.2 ± 57.5; controls: 517.9 ± 64.6) of CB-IR neurons. Nonetheless, the high variability in the density of CB neurons suggests that there was insufficient statistical power to either support or reject actual differences between the groups. There was a trend in depressed subjects for lower density (27%), (ANCOVA: F(1, 11) = 4.132, p = 0.067) and smaller size (13%) (ANCOVA: F(1, 11) = 3.483, p = 0.089) of CB-IR neurons (Figure 1c). In the depressed subjects, no significant correlations were observed between the density or size of CB-IR neurons and post-mortem delay, TF, time in ethanol, or tissue pH. However, in the control group, a significant correlation was detected between the size of CB-IR and age (r = 0.828, p = 0.011) or post-mortem delay (r = 0.757, p = 0.03).
PV-IR neurons
In area 47, the packing density of PV-IR neurons in the MDD group (mean ± SD: 4.0 ± 2.9) was modestly reduced below the control values (4.1 ± 2.5) when compared after adjusting for the covariates; Figure 1d (ANCOVA: F(1, 18) = 4.420, p = 0.05). There was no significant difference between the two groups in the size of PV-IR cells (MDD: 715.9 ± 133.8; control: 738.4 ± 136.2; ANCOVA: F(1, 18) = 0.265, p = 0.613).
The density but not size of PV-IR neurons was positively correlated with tissue pH in the depressed group (r = 0.722, p = 0.004) but not in the control group (r = 0.453, p = 0.161) (Figure 4). Moreover, the size of PV-IR neurons was positively correlated with age (r = 0.630, p = 0.016) in the MDD group. In contrast, in the control group the size of PV-IR neurons was positively correlated with TF (r = 0.732, p = 0.01).
Figure 4.

Scatter plots demonstrating the significant positive correlation between density of PV-IR neurons in area 47 and tissue pH in the MDD group. Similar correlation was not observed in the control group.
Discussion
The present study provides evidence for a reduction in the density and size of GABAergic interneurons immunoreactive for calbindin-D28K in the prefrontal cortex of subjects with MDD as compared to matched nonpsychiatric controls. The density of CB-IR neurons in layers II + IIIa was significantly reduced by 50% in dlPFC of depressed subjects, with a trend for a reduction in the ORB. The size of CB-IR somata was also decreased by 18% in depression in the dlPFC, with a trend for a reduction in size in the ORB. In contrast, the density of PV-IR neurons in layers IIIb–VI was not significantly different between the depressed and control groups in either the dlPFC or in the ORB. Likewise, soma size of PV-IR neurons was unchanged in depressed subjects in either dlPFC or ORB. The above findings suggest that different GABAergic local circuit neurons may be selectively affected in each of these prefrontal regions. We did not examine the third subpopulation of GABAergic neurons immunoreactive for calretinin as previous studies have not identified significant changes in the density of calretinin-immunoreactive neurons in MDD and we had a limited number of prefrontal sections.
Primate studies reveal that GABAergic inhibitory non-pyramidal neurons can be divided into nonoverlapping subpopulations based on the calcium binding protein, CB, PV or calretinin, they express (Conde et al, 1994; Lund and Lewis, 1993). These three subgroups together account for virtually all GABAergic neurons. CB-IR and PV-IR prefrontal neurons belong to two distinct subpopulations of GABA interneurons (Conde et al, 1994; Zaitsev et al, 2005). These cells differ by morphology, type of contacts with pyramidal neurons, pattern of firing, and monoaminergic innervation. PV-IR interneurons correspond to basket or chandelier cells, make contacts on somata and axonal initial segments of pyramidal neurons and regulate cortical output activity (Baimbridge et al, 1992; Cauli et al, 1997; Conde et al, 1994; Cruz et al, 2003; DeFelipe, 1989, 1997; Gabbott et al, 1997; Lewis and Lund, 1990; Lund and Lewis, 1993; Somogyi et al, 1998). PV-IR neurons have physiological properties characteristic of fast-spiking interneurons (Kawaguchi and Kubota, 1993, 1997; Zaitsev et al, 2005). In contrast, CB-IR interneurons have a double bouquet morphology, form characteristic dense axonal collaterals in layer I, make synapses on the dendrites and dendritic spines of pyramidal neurons, and have physiological features consistent with nonfast spiking interneurons (Cauli et al, 1997; DeFelipe, 1997; Gabbott et al, 1997; Kawaguchi and Kubota, 1993, 1997; Lund and Lewis, 1993; Zaitsev et al, 2005). In addition, CB and PV cortical neurons differ by specific serotoninergic and dopaminergic innervation (Freund et al, 1990; Hornung, 2003; Hornung and Celio, 1992; Sesack et al, 1995). For example, cortical GABAergic interneurons containing CB (but not PV) receive terminal arborizations of the large varicose serotoninergic axons coming from the median raphe (Freund et al, 1990; Hornung, 2003; Hornung and Celio, 1992; Smiley and Goldman-Rakic, 1996; Trottier et al, 1996). Thus, these two different subtypes of prefrontal interneurons may contribute to different prefrontal functions mediated by circuits of the dlPFC and ORB. For example, GABA-mediated inhibition in the dlPFC has been shown to be an important element of working memory (Constantinidis and Goldman-Rakic, 2002; Rao et al, 2000; Sawaguchi et al, 1989; Wilson et al, 1994). GABAergic abnormalities in the ORB have been suggested to be involved in psychomotor retardation, disinhibition, and obsessive-compulsive behavior (Bechara et al, 2000; Cummings, 1993; Volkow and Fowler, 2000). These behavioral disturbances are associated with dysfunctions of the prefrontal cortex and are among the signs and symptoms exhibited by depressed patients.
The present observations of reductions in specific subpopulations of neurons immunoreactive for calcium binding proteins in MDD are in good agreement with earlier reports of reductions in the neuronal density and/or size of the Nissl-stained general population of neurons in the dlPFC and ORB regions in MDD (Cotter et al, 2002b, 2005; Rajkowska et al, 1999). In those studies, neuronal pathology was observed in the same cortical layers (II–VI) as in the present study. It is also noteworthy that the majority (12 MDD and seven controls) of subjects investigated by Rajkowska et al (1999) were included in the present study. It is of further interest that our present observations on the deficit in GABA neurons found predominantly in the dlPFC and not in the ventrolateral ORB cortex are in agreement with the findings of Merali et al (2004) on region-specific reductions in the mRNA expression of GABA receptor subunits in depressed suicide victims. In this study, reductions in various subunits of GABAA receptors were found in the frontopolar cortex but not in the ventrolateral or dorsomedial prefrontal cortex.
Our present findings, however, are in disagreement with two other post-mortem studies where no changes were observed in CB-IR and PV-IR interneurons in MDD in either the dlPFC (Beasley et al, 2002) or anterior cingulate (Cotter et al, 2002a) cortex. The previous studies were both carried out in the same cohort of subjects in which alternate (left and right) hemispheres were used whereas in the present study, only the left hemisphere was analyzed. In addition, thicker (40 μm) celloidin-embedded sections were used in the current study, permitting the application of 3-D cell counting. These factors coupled with a relatively short PMI (21 ± 4 h) and the inclusion of older subjects in our study may largely account for the discrepancies between the present and previous studies.
A deficit in GABAergic interneurons in the frontal cortex of subjects with manic-depressive illness and schizophrenia has been reported (Beasley and Reynolds, 1997; Beasley et al, 2002; Benes and Berretta, 2001; Benes et al, 1998; Cotter et al, 2002a; Kalus et al, 1997; Reynolds and Beasley, 2001). Our recent unpublished observations also reveal a reduction in the density of CB-IR interneurons in dlPFC of subjects with schizophrenia (Rajkowska et al, 2002). Moreover, reductions in immunoreactivity for glutamic acid decarboxylase (GAD65) (the GABA synthesizing enzyme; Benes et al, 2000), mRNA for GAD (Akbarian et al, 1995; Hashimoto and Lewis, 2006; Hashimoto et al, 2003; Volk et al, 2000), and the GABA membrane transporter, GAT-1 (Pierri et al, 1999; Woo et al, 1998) have been observed in dlPFC and anterior cingulate cortex in manic-depressive disorder and schizophrenia. Whether similar reductions in GAD or GAT-1 mRNA and protein are present in our cohort of depressed subjects is yet to be determined. Other recent reports suggest that alterations in GABA receptor subunits may be involved in the genetic pathophysiology of depression and suicide (Choudary et al, 2005; Henkel et al, 2004; Sen et al, 2004; Merali et al, 2004). Our preliminary observations of reduced mRNA for GABA receptor subunits in the dlPFC of the same subjects as studied here (Duman RS et al, unpublished observations) are in accord with our present findings on reduced density of GABA interneurons immunoreactive for CB.
The observations presented here, suggesting a deficit in GABAergic neurons in depression, are supported by recent clinical reports of reduced GABA levels in plasma and cerebrospinal fluid in mood disorder patients (Brambilla et al, 2003; Petty, 1995; Sanacora et al, 1999, 2004). A proton magnetic resonance spectroscopy study in live patients shows a highly significant 52% reduction in GABA levels in the occipital cortex of 14 medication-free depressed subjects (Sanacora et al, 1999). Later studies by the same group demonstrate that low levels of GABA in the occipital cortex can be reversed by treatment with SSRIs or ECT (Sanacora et al, 2002, 2003a). The ability of an SSRI to normalize GABA levels in depression and even increase it in healthy subjects (Bhagwagar et al, 2004b) suggests close interactions between these systems. Immunohistochemical studies reveal the presence of serotonin-1A (Aznar et al, 2003) and serotonin-2A (Jakab and Goldman-Rakic, 2000; Pazos et al, 1987b) receptors on nearly all CB-IR and PV-IR neurons. Moreover, serotonin-1A receptors are preferentially found in layer II of human prefrontal cortex (Burnet et al, 1995; Pazos et al, 1987a; Varnas et al, 2004) and PET studies show a significant reduction in radioligand binding to serotonin-1A receptors in depressed subjects (Bhagwagar et al, 2004a; Sargent et al, 2000).
Reductions in the density of CB-IR and PV-IR neurons observed in the present study in MDD are most likely attributable to the disorder itself, as significant differences in the density of these cells between control and depressed groups remain after controlling for confounding variables such as duration of PMI, TF, tissue pH, and age and suicide. Among these confounding variables, there was a small (4%) but significant difference between the groups for brain pH and a larger (45%) difference for tissue fixation time. TF is unlikely to have influenced the reductions in the density of CB-IR and PV-IR neurons in the MDD group as the average length of TF for the MDD group was less than half of that of the control group.
There was a significant positive correlation between pH and the density of PV-IR neurons in the ORB region in subjects with MDD but not in control subjects. Similar correlations between pH and the density of CB-IR and PV-IR neurons were reported in two other post-mortem studies (Beasley et al, 2002; Cotter et al, 2002a). However, it is not specified in these studies whether the correlation was found only in the group of mood disorder patients or in the entire cohort of subjects studied. Several other studies which observed reductions in CB-IR or PV-IR neurons in manic-depressive illness or schizophrenia did not include pH as a covariate in their analyses (Beasley and Reynolds, 1997; Benes et al, 2000; Daviss and Lewis, 1995; Iritani et al, 1999; Kalus et al, 1997; Pierri et al, 1999; Reynolds and Beasley, 2001; Woo et al, 1997, 1998). The intriguing correlation between pH and cell density observed in the present study was also noted in three other analyses on our post-mortem brain samples (Karolewicz et al, 2004; Rajkowska et al, 2005; Van Otterloo et al, 2005). The exact mechanisms by which tissue pH and neuronal density may influence each other are not known yet. Changes in the physiological parameters of neurons and glial cells, and alterations in glutamate uptake and calcium metabolism, have been associated with changes in the intracellular or extracellular tissue pH (Balestrino and Somjen, 1988; Caspers and Speckmann, 1972; Dipolo and Beauge, 1982; Goldman et al, 1989; Gruol et al, 1980; Pappas et al, 1994; Robello et al, 1994; Takahashi et al, 1995). It is also known that changes in tissue pH are associated with certain pathological conditions such as ischemia or head injury (Billups and Attwell, 1996; Cadoux-Hudson et al, 1990; Smith et al, 1986). Prolonged agonal state related to hypoxia may also lower brain tissue pH (Tomita et al, 2004). This is, however, unlikely to be the case in our subjects as all of them were victims of sudden death (either by suicide, or due to accidental causes). Our observations of a correlation between pH and cell density or protein level found predominantly in the MDD but not control subjects suggest an association between brain pH and depressive states which might be related to glial damage (possibly astrocytes) or metabolic disturbances in glutamate levels reported in MDD (reviewed by Rajkowska (2003) and Sanacora et al (2003b).
In MDD, there was a negative correlation between age and density of CB-IR and between age and size of PV-IR. The older the subjects, the lower the density or size of immunoreactive neurons. This would suggest an age-related decline in calcium binding GABA interneurons. The influence of age of depressed subjects on the density and size of GABA interneurons may also be related to the cause of death as we observed nearly significant correlations between these parameters in the depressed suicide subgroup (n = 9), whereas they were nonsignificant in the nonsuicide subgroup (n = 5). However, this issue has to be further explored as we did not have many elderly (over 60 years of age) subjects in the studied cohort (six MDD and three controls), and only five depressed subjects died by causes other than suicide. Thus, we did not have enough statistical power to establish the full magnitude of this relationship.
The actions of serotoninergic antidepressant drugs, antipsychotic drugs, and ethanol may be partially mediated by GABA neurotransmission within circuits in the frontal cortex (Cummings, 1995). A deficit in cortical GABA activity may contribute to the etiology of drug and alcohol dependence (Behar et al, 1999; Ke et al, 2004; Lingford-Hughes et al, 1998). It is, however, unlikely that the reductions observed in the density and size of CB- and PV-IR neurons were influenced by psychotropic medications. Antidepressant drugs were detected post-mortem in only two of the eight depressed subjects with a recent prescription for an antidepressant drug and in one depressed subject with a prescription for antipsychotic medications. Ethanol was present in the blood of only three of the 14 MDD subjects. Neuronal density values were comparable between all depressed subjects regardless of medication history.
In summary, this is the first observation of reductions in the density and size of GABAergic interneurons immunoreactive for calcium binding proteins in the prefrontal cortex of subjects with MDD. This observation in post-mortem tissue is consistent with recent neuroimaging reports of an antidepressant-reversible deficit in GABA levels in MDD and with microarray studies (including our own preliminary observations) on alterations in GABA-related gene expression in depression. The present study, however, has some limitations. We have not yet investigated whether cell loss of GABAergic neurons or decrease in the concentration of calcium binding proteins within individual cells account for the observed reductions in the density of cells expressing calcium binding proteins. It is also unknown whether the expression of GAD or other GABA- and/or GABA receptor-related proteins is altered in our cohort of depressed subjects. Further immunohistochemical and in situ hybridization studies may answer these questions.
Acknowledgments
We gratefully acknowledge the assistance of Drs James C Overholser, George Jurjus, Herbert Y Meltzer, and Ginny Dilley and Lisa Konick, MA, in the establishment of retrospective psychiatric diagnoses. The excellent assistance of the Cuyahoga County Coroner's Office, Cleveland, OH, is greatly appreciated. We thank the next-of-kin for their participation and support. This study was supported by grants from the National Institute of Mental Health (MH61578, MH60451, MH63187, MH67996) and from the National Center for Research Resources (NCRR, RR17701), a component of NIH.
References
- Akbarian S, Kim JJ, Potkin SG, Hagman JO, Tafazzoli A, Bunney WE, et al. Gene expression for glutamic acid decarboxylase is reduced without loss of neurons in prefrontal cortex of schizophrenics. Arch Gen Psychiatry. 1995;52:258–266. doi: 10.1001/archpsyc.1995.03950160008002. [DOI] [PubMed] [Google Scholar]
- Aznar S, Qian Z, Shah R, Rahbek B, Knudsen GM. The 5-HT1A serotonin receptor is located on calbindin- and parvalbumin-containing neurons in the rat brain. Brain Res. 2003;959:58–67. doi: 10.1016/s0006-8993(02)03727-7. [DOI] [PubMed] [Google Scholar]
- Baimbridge KG, Celio MR, Rogers JH. Calcium-binding proteins in the nervous system. Trends Neurosci. 1992;15:303–308. doi: 10.1016/0166-2236(92)90081-i. [DOI] [PubMed] [Google Scholar]
- Balestrino M, Somjen GG. Concentration of carbon dioxide, interstitial pH and synaptic transmission in hippocampal formation of the rat. J Physiol. 1988;396:247–266. doi: 10.1113/jphysiol.1988.sp016961. [DOI] [PMC free article] [PubMed] [Google Scholar]
- Beasley C, Reynolds G. Parvalbumin-immunoreactive neurons are reduced in the prefrontal cortex of schizophrenics. Schizophr Res. 1997;24:349–355. doi: 10.1016/s0920-9964(96)00122-3. [DOI] [PubMed] [Google Scholar]
- Beasley CL, Zhang ZJ, Patten I, Reynolds GP. Selective deficits in prefrontal cortical GABAergic neurons in schizophrenia defined by the presence of calcium-binding proteins. Biol Psychiatry. 2002;52:708–715. doi: 10.1016/s0006-3223(02)01360-4. [DOI] [PubMed] [Google Scholar]
- Bechara A, Damasio H, Damasio AR. Emotion, decision making and the orbitofrontal cortex. Cereb Cortex. 2000;10:295–307. doi: 10.1093/cercor/10.3.295. [DOI] [PubMed] [Google Scholar]
- Behar KL, Rothman DL, Petersen KF, Hooten M, Delaney R, Petroff OA, et al. Preliminary evidence of low cortical GABA levels in localized 1H-MR spectra of alcohol-dependent and hepatic encephalopathy patients. Am J Psychiatry. 1999;156:952–954. doi: 10.1176/ajp.156.6.952. [DOI] [PubMed] [Google Scholar]
- Benes FM, Berretta S. GABAergic interneurons: implications for understanding schizophrenia and bipolar disorder. Neuropsychopharmacology. 2001;25:1–27. doi: 10.1016/S0893-133X(01)00225-1. [DOI] [PubMed] [Google Scholar]
- Benes FM, Kwok EW, Vincent SL, Todtenkopf MS. A reduction of nonpyramidal cells in sector CA2 of schizophrenics and manic depressives. Biol Psychiatry. 1998;44:88–97. doi: 10.1016/s0006-3223(98)00138-3. [DOI] [PubMed] [Google Scholar]
- Benes FM, Todtenkopf MS, Logiotatos P, Williams M. Glutamate decarboxylase(65)-immunoreactive terminals in cingulate and prefrontal cortices of schizophrenic and bipolar brain. J Chem Neuroanat. 2000;20:259–269. doi: 10.1016/s0891-0618(00)00105-8. [DOI] [PubMed] [Google Scholar]
- Bhagwagar Z, Rabiner EA, Sargent PA, Grasby PM, Cowen PJ. Persistent reduction in brain serotonin1A receptor binding in recovered depressed men measured by positron emission tomography with [11C]WAY-100635. Mol Psychiatry. 2004a;9:386–392. doi: 10.1038/sj.mp.4001401. [DOI] [PubMed] [Google Scholar]
- Bhagwagar Z, Wylezinska M, Taylor M, Jezzard P, Matthews PM, Cowen PJ. Increased brain GABA concentrations following acute administration of a selective serotonin reuptake inhibitor. Am J Psychiatry. 2004b;161:368–370. doi: 10.1176/appi.ajp.161.2.368. [DOI] [PubMed] [Google Scholar]
- Billups B, Attwell D. Modulation of non-vesicular glutamate release by pH. Nature. 1996;379:171–174. doi: 10.1038/379171a0. [DOI] [PubMed] [Google Scholar]
- Brambilla P, Perez J, Barale F, Schettini G, Soares JC. GABAergic dysfunction in mood disorders. Mol Psychiatry. 2003;8:721–737. 715. doi: 10.1038/sj.mp.4001362. [DOI] [PubMed] [Google Scholar]
- Burnet PW, Eastwood SL, Lacey K, Harrison PJ. The distribution of 5-HT1A and 5-HT2A receptor mRNA in human brain. Brain Res. 1995;676:157–168. doi: 10.1016/0006-8993(95)00104-x. [DOI] [PubMed] [Google Scholar]
- Cadoux-Hudson TA, Wade D, Taylor DJ, Rajagopalan B, Ledingham JG, Briggs M, et al. Persistent metabolic sequelae of severe head injury in humans in vivo. Acta Neurochir (Wiener) 1990;104:1–7. doi: 10.1007/BF01842884. [DOI] [PubMed] [Google Scholar]
- Caspers H, Speckmann EJ. Cerebral pO2, pCO2 and pH: changes during convulsive activity and their significance for spontaneous arrest of seizures. Epilepsia. 1972;13:699–725. doi: 10.1111/j.1528-1157.1972.tb04403.x. [DOI] [PubMed] [Google Scholar]
- Cauli B, Audinat E, Lambolez B, Angulo MC, Ropert N, Tsuzuki K, et al. Molecular and physiological diversity of cortical nonpyramidal cells. J Neurosci. 1997;17:3894–3906. doi: 10.1523/JNEUROSCI.17-10-03894.1997. [DOI] [PMC free article] [PubMed] [Google Scholar]
- Choudary PV, Molnar M, Evans SJ, Tomita H, Li JZ, Vawter MP, et al. Altered cortical glutamatergic and GABAergic signal transmission with glial involvement in depression. Proc Natl Acad Sci USA. 2005;102:15653–15658. doi: 10.1073/pnas.0507901102. [DOI] [PMC free article] [PubMed] [Google Scholar]
- Conde F, Lund JS, Jacobowitz DM, Baimbridge KG, Lewis DA. Local circuit neurons immunoreactive for calretinin, calbindin D-28k or parvalbumin in monkey prefrontal cortex: distribution and morphology. J Comp Neurol. 1994;341:95–116. doi: 10.1002/cne.903410109. [DOI] [PubMed] [Google Scholar]
- Constantinidis C, Goldman-Rakic PS. Correlated discharges among putative pyramidal neurons and interneurons in the primate prefrontal cortex. J Neurophysiol. 2002;88:3487–3497. doi: 10.1152/jn.00188.2002. [DOI] [PubMed] [Google Scholar]
- Cotter D, Hudson L, Landau S. Evidence for orbitofrontal pathology in bipolar disorder and major depression, but not in schizophrenia. Bipolar Disord. 2005;7:358–369. doi: 10.1111/j.1399-5618.2005.00230.x. [DOI] [PubMed] [Google Scholar]
- Cotter D, Landau S, Beasley C, Stevenson R, Chana G, MacMillan L, et al. The density and spatial distribution of gabaergic neurons, labelled using calcium binding proteins, in the anterior cingulate cortex in major depressive disorder, bipolar disorder, and schizophrenia. Biol Psychiatry. 2002a;51:377–386. doi: 10.1016/s0006-3223(01)01243-4. [DOI] [PubMed] [Google Scholar]
- Cotter D, Mackay D, Chana G, Beasley C, Landau S, Everall IP. Reduced neuronal size and glial cell density in area 9 of the dorsolateral prefrontal cortex in subjects with major depressive disorder. Cereb Cortex. 2002b;12:386–394. doi: 10.1093/cercor/12.4.386. [DOI] [PubMed] [Google Scholar]
- Cruz DA, Eggan SM, Lewis DA. Postnatal development of pre- and postsynaptic GABA markers at chandelier cell connections with pyramidal neurons in monkey prefrontal cortex. J Comp Neurol. 2003;465:385–400. doi: 10.1002/cne.10833. [DOI] [PubMed] [Google Scholar]
- Cummings JL. Frontal–subcortical circuits and human behavior. Arch Neurol. 1993;50:873–880. doi: 10.1001/archneur.1993.00540080076020. [DOI] [PubMed] [Google Scholar]
- Cummings JL. Anatomic and behavioral aspects of frontal–subcortical circuits. Ann NY Acad Sci. 1995;769:1–13. doi: 10.1111/j.1749-6632.1995.tb38127.x. [DOI] [PubMed] [Google Scholar]
- Daviss S, Lewis D. Local circuit neurons of the prefrontal cortex in schizophrenia: selective increase in the density of calbindin-immunoreactive neurons. Psychiatry Res. 1995;59:81–96. doi: 10.1016/0165-1781(95)02720-3. [DOI] [PubMed] [Google Scholar]
- DeFelipe J. Types of neurons, synaptic connections and chemical characteristics of cells immunoreactive for calbindin-D28K, parvalbumin and calretinin in the neocortex. J Chem Neuroanat. 1997;14:1–19. doi: 10.1016/s0891-0618(97)10013-8. [DOI] [PubMed] [Google Scholar]
- DeFelipe J, Hendry SH, Jones EG. Visualization of chandelier cell axons by parvalbumin immunoreactivity in monkey cerebral cortex. Proc Natl Acad Sci USA. 1989;86:2093–2097. doi: 10.1073/pnas.86.6.2093. [DOI] [PMC free article] [PubMed] [Google Scholar]
- Dipolo R, Beauge L. The effect of pH on Ca2+ extrusion mechanisms in dialyzed squid axons. Biochim Biophys Acta. 1982;688:237–245. doi: 10.1016/0005-2736(82)90599-5. [DOI] [PubMed] [Google Scholar]
- Freund TF, Gulyas AI, Acsady L, Gorcs T, Toth K. Serotonergic control of the hippocampus via local inhibitory interneurons. Proc Natl Acad Sci USA. 1990;87:8501–8505. doi: 10.1073/pnas.87.21.8501. [DOI] [PMC free article] [PubMed] [Google Scholar]
- Gabbott PL, Dickie BG, Vaid RR, Headlam AJ, Bacon SJ. Local-circuit neurones in the medial prefrontal cortex (areas 25, 32 and 24b) in the rat: morphology and quantitative distribution. J Comp Neurol. 1997;377:465–499. doi: 10.1002/(sici)1096-9861(19970127)377:4<465::aid-cne1>3.0.co;2-0. [DOI] [PubMed] [Google Scholar]
- Goldman SA, Pulsinelli WA, Clarke WY, Kraig RP, Plum F. The effects of extracellular acidosis on neurons and glia in vitro. J Cereb Blood Flow Metab. 1989;9:471–477. doi: 10.1038/jcbfm.1989.70. [DOI] [PMC free article] [PubMed] [Google Scholar]
- Gruol DL, Barker JL, Huang LY, MacDonald JF, Smith TG., Jr Hydrogen ions have multiple effects on the excitability of cultured mammalian neurons. Brain Res. 1980;183:247–252. doi: 10.1016/0006-8993(80)90138-9. [DOI] [PubMed] [Google Scholar]
- Hashimoto T, Lewis DA. BDNF Val66Met polymorphism and GAD67 mRNA expression in the prefrontal cortex of subjects with schizophrenia. Am J Psychiatry. 2006;163:534–537. doi: 10.1176/appi.ajp.163.3.534. [DOI] [PubMed] [Google Scholar]
- Hashimoto T, Volk DW, Eggan SM, Mirnics K, Pierri JN, Sun Z, et al. Gene expression deficits in a subclass of GABA neurons in the prefrontal cortex of subjects with schizophren ia. J Neurosci. 2003;23:6315–6326. doi: 10.1523/JNEUROSCI.23-15-06315.2003. [DOI] [PMC free article] [PubMed] [Google Scholar]
- Henkel V, Baghai TC, Eser D, Zill P, Mergl R, Zwanzger P, et al. The gamma amino butyric acid (GABA) receptor alpha-3 subunit gene polymorphism in unipolar depressive disorder: a genetic association study. Am J Med Genet B Neuropsychiatr Genet. 2004;126:82–87. doi: 10.1002/ajmg.b.20137. [DOI] [PubMed] [Google Scholar]
- Hornung JP. The human raphe nuclei and the serotonergic system. J Chem Neuroanat. 2003;26:331–343. doi: 10.1016/j.jchemneu.2003.10.002. [DOI] [PubMed] [Google Scholar]
- Hornung JP, Celio MR. The selective innervation by serotoninergic axons of calbindin-containing interneurons in the neocortex and hippocampus of the marmoset. J Comp Neurol. 1992;320:457–467. doi: 10.1002/cne.903200404. [DOI] [PubMed] [Google Scholar]
- Iritani S, Kuroki N, Ikeda K, Kazamatsuri H. Calbindin immunoreactivity in the hippocampal formation and neocortex of schizophrenics. Prog Neuropsychopharmacol Biol Psychiatry. 1999;23:409–421. doi: 10.1016/s0278-5846(99)00005-6. [DOI] [PubMed] [Google Scholar]
- Jakab RL, Goldman-Rakic PS. Segregation of serotonin 5-HT2A and 5-HT3 receptors in inhibitory circuits of the primate cerebral cortex. J Comp Neurol. 2000;417:337–348. doi: 10.1002/(sici)1096-9861(20000214)417:3<337::aid-cne7>3.0.co;2-o. [DOI] [PubMed] [Google Scholar]
- Kalus P, Senitz D, Beckmann H. Altered distribution of parvalbumin-immunoreactive local circuit neurons in the anterior cingulate cortex of schizophrenic patients. Psychiatry Res. 1997;75:49–59. doi: 10.1016/s0925-4927(97)00020-6. [DOI] [PubMed] [Google Scholar]
- Karolewicz B, Szebeni K, Stockmeier CA, Konick L, Overholser JC, Jurjus G, et al. Low nNOS protein in the locus coeruleus in major depression. J Neurochem. 2004;91:1057–1066. doi: 10.1111/j.1471-4159.2004.02792.x. [DOI] [PMC free article] [PubMed] [Google Scholar]
- Kawaguchi Y, Kubota Y. Correlation of physiological subgroupings of nonpyramidal cells with parvalbumin- and calbindinD28k-immunoreactive neurons in layer V of rat frontal cortex. J Neurophysiol. 1993;70:387–396. doi: 10.1152/jn.1993.70.1.387. [DOI] [PubMed] [Google Scholar]
- Kawaguchi Y, Kubota Y. GABAergic cell subtypes and their synaptic connections in rat frontal cortex. Cereb Cortex. 1997;7:476–486. doi: 10.1093/cercor/7.6.476. [DOI] [PubMed] [Google Scholar]
- Ke Y, Streeter CC, Nassar LE, Sarid-Segal O, Hennen J, Yurgelun-Todd DA, et al. Frontal lobe GABA levels in cocaine dependence: a two-dimensional, J-resolved magnetic resonance spectroscopy study. Psychiatry Res. 2004;130:283–293. doi: 10.1016/j.pscychresns.2003.12.001. [DOI] [PubMed] [Google Scholar]
- Kelly TM, Mann JJ. Validity of DSM-III-R diagnosis by psychological autopsy: a comparison with clinician ante-mortem diagnosis. Acta Psychiatr Scand. 1996;94:337–343. doi: 10.1111/j.1600-0447.1996.tb09869.x. [DOI] [PubMed] [Google Scholar]
- Lewis DA, Lund JS. Heterogeneity of chandelier neurons in monkey neocortex: corticotropin-releasing factor- and parvalbumin-immunoreactive populations. J Comp Neurol. 1990;293:599–615. doi: 10.1002/cne.902930406. [DOI] [PubMed] [Google Scholar]
- Lingford-Hughes AR, Acton PD, Gacinovic S, Suckling J, Busatto GF, Boddington SJ, et al. Reduced levels of GABA-benzodiazepine receptor in alcohol dependency in the absence of grey matter atrophy. Br J Psychiatry. 1998;173:116–122. doi: 10.1192/bjp.173.2.116. [DOI] [PubMed] [Google Scholar]
- Lund JS, Lewis DA. Local circuit neurons of developing and mature macaque prefrontal cortex: Golgi and immunocytochemical characteristics. J Comp Neurol. 1993;328:282–312. doi: 10.1002/cne.903280209. [DOI] [PubMed] [Google Scholar]
- Merali Z, Du L, Hrdina P, Palkovits M, Faludi G, Poulter MO, et al. Dysregulation in the suicide brain: mRNA expression of corticotropin-releasing hormone receptors and GABA(A) receptor subunits in frontal cortical brain region. J Neurosci. 2004;24:1478–1485. doi: 10.1523/JNEUROSCI.4734-03.2004. [DOI] [PMC free article] [PubMed] [Google Scholar]
- Miguel-Hidalgo JJ, Dubey P, Shao Q, Stockmeier C, Rajkowska G. Unchanged packing density but altered size of neurofilament immunoreactive neurons in the prefrontal cortex in schizophrenia and major depression. Schizophr Res. 2005;76:159–171. doi: 10.1016/j.schres.2005.02.015. [DOI] [PMC free article] [PubMed] [Google Scholar]
- Miguel-Hidalgo JJ, Rajkowska G. Immunohistochemistry of neural markers for the study of the laminar cytoarchitecture in celloidin sections from the human cerebral cortex. J Neurosci Meth. 1999;93:69–79. doi: 10.1016/s0165-0270(99)00114-4. [DOI] [PubMed] [Google Scholar]
- Pappas CA, Ullrich N, Sontheimer H. Reduction of glial proliferation by K+ channel blockers is mediated by changes in pHi. Neuroreport. 1994;6:193–196. doi: 10.1097/00001756-199412300-00049. [DOI] [PubMed] [Google Scholar]
- Pazos A, Probst A, Palacios J. Serotonin receptors in the human brain—III. Autoradiographic mapping of serotonin-1 receptors. Neuroscience. 1987a;21:97–122. doi: 10.1016/0306-4522(87)90326-5. [DOI] [PubMed] [Google Scholar]
- Pazos A, Probst A, Palacios JM. Serotonin receptors in the human brain—IV. Autoradiographic mapping of serotonin-2 receptors. Neuroscience. 1987b;21:123–139. doi: 10.1016/0306-4522(87)90327-7. [DOI] [PubMed] [Google Scholar]
- Petty F. GABA and mood disorders: a brief review and hypothesis. J Affect Disord. 1995;34:275–281. doi: 10.1016/0165-0327(95)00025-i. [DOI] [PubMed] [Google Scholar]
- Pierri JN, Chaudry AS, Woo TU, Lewis DA. Alterations in chandelier neuron axon terminals in the prefrontal cortex of schizophrenic subjects. Am J Psychiatry. 1999;156:1709–1719. doi: 10.1176/ajp.156.11.1709. [DOI] [PubMed] [Google Scholar]
- Rajkowska G. Depression: what we can learn from postmortem studies. The Neuroscientist. 2003;9:273–284. doi: 10.1177/1073858403252773. [DOI] [PubMed] [Google Scholar]
- Rajkowska G, Goldman-Rakic PS. Cytoarchitectonic definition of prefrontal areas in the normal human cortex: I. Quantitative criteria for distinguishing areas 9 and 46. Cereb Cortex. 1995a;4:307–322. doi: 10.1093/cercor/5.4.307. [DOI] [PubMed] [Google Scholar]
- Rajkowska G, Goldman-Rakic PS. Cytoarchitectonic definition of prefrontal areas in the normal human cortex: II. Variability in locations of areas 9 and 46. Cereb Cortex. 1995b;4:323–337. doi: 10.1093/cercor/5.4.323. [DOI] [PubMed] [Google Scholar]
- Rajkowska G, Miguel-Hidalgo JJ, Dubey P, Stockmeier CA, Krishnan KR. Prominent reduction in pyramidal neurons density in the orbitofrontal cortex of elderly depressed patients. Biol Psychiatry. 2005;58:297–306. doi: 10.1016/j.biopsych.2005.04.013. [DOI] [PMC free article] [PubMed] [Google Scholar]
- Rajkowska G, Miguel-Hidalgo JJ, Wei J, Dilley G, Pittman SD, Meltzer HY, et al. Morphometric evidence for neuronal and glial prefrontal cell pathology in major depression. Biol Psychiatry. 1999;45:1085–1098. doi: 10.1016/s0006-3223(99)00041-4. [DOI] [PubMed] [Google Scholar]
- Rajkowska G, O'Dwyer G, Shao Q, Stockmeier CA, Miguel-Hidalgo JJ. Program No 49720 2002 Abstract Viewer/Itinerary Planner. Society for Neuroscience; Washington, DC: 2002. Calbindin immunoreactive non-pyramidal neurons are reduced in the dorsolateral prefrontal cortex in major depression and schizophrenia. 2002 CD-ROM. [Google Scholar]
- Rao SG, Williams GV, Goldman-Rakic PS. Destruction and creation of spatial tuning by disinhibition: GABA(A) blockade of prefrontal cortical neurons engaged by working memory. J Neurosci. 2000;20:485–494. doi: 10.1523/JNEUROSCI.20-01-00485.2000. [DOI] [PMC free article] [PubMed] [Google Scholar]
- Reynolds GP, Beasley CL. GABAergic neuronal subtypes in the human frontal cortex—development and deficits in schizophrenia. J Chem Neuroanat. 2001;22:95–100. doi: 10.1016/s0891-0618(01)00113-2. [DOI] [PubMed] [Google Scholar]
- Robello M, Baldelli P, Cupello A. Modulation by extracellular pH of the activity of GABAA receptors on rat cerebellum granule cells. Neuroscience. 1994;61:833–837. doi: 10.1016/0306-4522(94)90406-5. [DOI] [PubMed] [Google Scholar]
- Sanacora G, Gueorguieva R, Epperson CN, Wu YT, Appel M, Rothman DL, et al. Subtype-specific alterations of gamma-aminobutyric acid and glutamate in patients with major depression. Arch Gen Psychiatry. 2004;61:705–713. doi: 10.1001/archpsyc.61.7.705. [DOI] [PubMed] [Google Scholar]
- Sanacora G, Mason GF, Krystal JH. Impairment of GABAergic transmission in depression: new insights from neuroimaging studies. Crit Rev Neurobiol. 2000;14:23–45. doi: 10.1615/critrevneurobiol.v14.i1.20. [DOI] [PubMed] [Google Scholar]
- Sanacora G, Mason GF, Rothman DL, Behar KL, Hyder F, Petroff OA, et al. Reduced cortical gamma-aminobutyric acid levels in depressed patients determined by proton magnetic resonance spectroscopy. Arch Gen Psychiatry. 1999;56:1043–1047. doi: 10.1001/archpsyc.56.11.1043. [DOI] [PubMed] [Google Scholar]
- Sanacora G, Mason GF, Rothman DL, Hyder F, Ciarcia JJ, Ostroff RB, et al. Increased cortical GABA concentrations in depressed patients receiving ECT. Am J Psychiatry. 2003a;160:577–579. doi: 10.1176/appi.ajp.160.3.577. [DOI] [PubMed] [Google Scholar]
- Sanacora G, Mason GF, Rothman DL, Krystal JH. Increased occipital cortex GABA concentrations in depressed patients after therapy with selective serotonin reuptake inhibitors. Am J Psychiatry. 2002;159:663–665. doi: 10.1176/appi.ajp.159.4.663. [DOI] [PubMed] [Google Scholar]
- Sanacora G, Rothman DL, Mason G, Krystal JH. Clinical studies implementing glutamate neurotransmission in mood disorders. Ann NY Acad Sci. 2003b;1003:292–308. doi: 10.1196/annals.1300.018. [DOI] [PubMed] [Google Scholar]
- Sargent PA, Kjaer KH, Bench CJ, Rabiner EA, Messa C, Meyer J, et al. Brain serotonin1A receptor binding measured by positron emission tomography with [11C]WAY-100635: effects of depression and antidepressant treatment. Arch Gen Psychiatry. 2000;57:174–180. doi: 10.1001/archpsyc.57.2.174. [DOI] [PubMed] [Google Scholar]
- Sawaguchi T, Matsumura M, Kubota K. Delayed response deficits produced by local injection of bicuculline into the dorsolateral prefrontal cortex in Japanese macaque monkeys. Exp Brain Res. 1989;75:457–469. doi: 10.1007/BF00249897. [DOI] [PubMed] [Google Scholar]
- Sen S, Villafuerte S, Nesse R, Stoltenberg SF, Hopcian J, Gleiberman L, et al. Serotonin transporter and GABAA alpha 6 receptor variants are associated with neuroticism. Biol Psychiatry. 2004;55:244–249. doi: 10.1016/j.biopsych.2003.08.006. [DOI] [PubMed] [Google Scholar]
- Sesack SR, Snyder CL, Lewis DA. Axon terminals immunolabeled for dopamine or tyrosine hydroxylase synapse on GABA-immunoreactive dendrites in rat and monkey cortex. J Comp Neurol. 1995;363:264–280. doi: 10.1002/cne.903630208. [DOI] [PubMed] [Google Scholar]
- Smiley JF, Goldman-Rakic PS. Serotonergic axons in monkey prefrontal cerebral cortex synapse predominantly on interneurons as demonstrated by serial section electron microscopy. J Comp Neurol. 1996;367:431–443. doi: 10.1002/(SICI)1096-9861(19960408)367:3<431::AID-CNE8>3.0.CO;2-6. [DOI] [PubMed] [Google Scholar]
- Smith ML, von Hanwehr R, Siesjo BK. Changes in extra- and intracellular pH in the brain during and following ischemia in hyperglycemic and in moderately hypoglycemic rats. J Cereb Blood Flow Metab. 1986;6:574–583. doi: 10.1038/jcbfm.1986.104. [DOI] [PubMed] [Google Scholar]
- Somogyi P, Tamas G, Lujan R, Buhl EH. Salient features of synaptic organisation in the cerebral cortex. Brain Res Brain Res Rev. 1998;26:113–135. doi: 10.1016/s0165-0173(97)00061-1. [DOI] [PubMed] [Google Scholar]
- Stockmeier CA, Mahajan GJ, Konick LC, Overholser JC, Jurjus GJ, Meltzer HY, et al. Cellular changes in the postmortem hippocampus in major depression. Biol Psychiatry. 2004;56:640–650. doi: 10.1016/j.biopsych.2004.08.022. [DOI] [PMC free article] [PubMed] [Google Scholar]
- Takahashi M, Kovalchuk Y, Attwell D. Pre- and postsynaptic determinants of EPSC waveform at cerebellar climbing fiber and parallel fiber to Purkinje cell synapses. J Neurosci. 1995;15:5693–5702. doi: 10.1523/JNEUROSCI.15-08-05693.1995. [DOI] [PMC free article] [PubMed] [Google Scholar]
- Tomita H, Vawter MP, Walsh DM, Evans SJ, Choudary PV, Li J, et al. Effect of agonal and postmortem factors on gene expression profile: quality control in microarray analyses of postmortem human brain. Biol Psychiatry. 2004;55:346–352. doi: 10.1016/j.biopsych.2003.10.013. [DOI] [PMC free article] [PubMed] [Google Scholar]
- Trottier S, Evrard B, Vignal JP, Scarabin JM, Chauvel P. The serotonergic innervation of the cerebral cortex in man and its changes in focal cortical dysplasia. Epilepsy Res. 1996;25:79–106. doi: 10.1016/0920-1211(96)00033-2. [DOI] [PubMed] [Google Scholar]
- Uylings HB, Sanz-Arigita EJ, de Vos K, Pool CW, Zilles K, Rajkowska G. 3-D cytoarchitectonic parcellation of human orbitofrontal cortex. Correlation with postmortem MRI. Eur J Neurosci. 2006 doi: 10.1016/j.pscychresns.2010.04.012. under review. [DOI] [PMC free article] [PubMed] [Google Scholar]
- Uylings HBM, Delalle I, Petanjek Z, Koenderink MJT. Structural and immunocytochemical differentiation of neurons in prenatal and postnatal human prefrontal cortex. Neuroembryology. 2002;1:176–186. [Google Scholar]
- Van Otterloo ES, Miguel-Hidalgo JJ, Stockmeier CA, Rajkowska G. Program No 9152 2005 Abstract Viewer/Itinerary Planner. Society for Neuroscience; Washington, DC: 2005. Microglia immunoreactivity is unchanged in the white matter of orbitofrontal cortex in elderly depressed patients. (Online) [Google Scholar]
- Varnas K, Halldin C, Hall H. Autoradiographic distribution of serotonin transporters and receptor subtypes in human brain. Hum Brain Mapp. 2004;22:246–260. doi: 10.1002/hbm.20035. [DOI] [PMC free article] [PubMed] [Google Scholar]
- Volk DW, Austin MC, Pierri JN, Sampson AR, Lewis DA. Decreased glutamic acid decarboxylase67 messenger RNA expression in a subset of prefrontal cortical gamma-aminobutyric acid neurons in subjects with schizophrenia. Arch Gen Psychiatry. 2000;57:237–245. doi: 10.1001/archpsyc.57.3.237. [DOI] [PubMed] [Google Scholar]
- Volkow ND, Fowler JS. Addiction, a disease of compulsion and drive: involvement of the orbitofrontal cortex. Cereb Cortex. 2000;10:318–325. doi: 10.1093/cercor/10.3.318. [DOI] [PubMed] [Google Scholar]
- Wilson FAW, Scalaidhe SPO, Goldman-Rakic PS. Functional synergism between putative a-aminobutyrate-containing neurons and pyramidal neurons in prefrontal cortex. Proc Natl Acad Sci. 1994;91:4009–4013. doi: 10.1073/pnas.91.9.4009. [DOI] [PMC free article] [PubMed] [Google Scholar]
- Woo TU, Miller JL, Lewis DA. Schizophrenia and the parvalbumin-containing class of cortical local circuit neurons. Am J Psychiatry. 1997;154:1013–1015. doi: 10.1176/ajp.154.7.1013. [DOI] [PubMed] [Google Scholar]
- Woo TU, Whitehead RE, Melchitzky DS, Lewis DA. A subclass of prefrontal gamma-aminobutyric acid axon terminals are selectively altered in schizophrenia. Proc Natl Acad Sci USA. 1998;95:5341–5346. doi: 10.1073/pnas.95.9.5341. [DOI] [PMC free article] [PubMed] [Google Scholar]
- Zaitsev AV, Gonzalez-Burgos G, Povysheva NV, Kroner S, Lewis DA, Krimer LS. Localization of calcium-binding proteins in physiologically and morphologically characterized interneurons of monkey dorsolateral prefrontal cortex. Cereb Cortex. 2005;15:1178–1186. doi: 10.1093/cercor/bhh218. [DOI] [PubMed] [Google Scholar]