Abstract
Purpose: The purpose of this study is to develop a computer-aided detection (CAD) system that combined a dual system approach with a two-view fusion method to improve the accuracy of mass detection on mammograms.
Methods: The authors previously developed a dual CAD system that merged the decision from two mass detection systems in parallel, one trained with average masses and another trained with subtle masses, to improve sensitivity without excessively increasing false positives (FPs). In this study, they further designed a two-view fusion method to combine the information from different mammographic views. Mass candidates detected independently by the dual system on the two-view mammograms were first identified as potential pairs based on a regional registration technique. A similarity measure was designed to differentiate TP-TP pairs from other pairs (TP-FP and FP-FP pairs) using paired morphological features, Hessian feature, and texture features. A two-view fusion score for each object was generated by weighting the similarity measure with the cross correlation measure of the object pair. Finally, a linear discriminant analysis classifier was trained to combine the mass likelihood score of the object from the single-view dual system and the two-view fusion score for classification of masses and FPs. A total of 2332 mammograms from 735 subjects including 800 normal mammograms from 200 normal subjects was collected with Institutional Review Board (IRB) approval.
Results: When the single-view CAD system that was trained with average masses only were applied to the test sets, the average case-based sensitivities were 50.6% and 63.6% for average masses on current mammograms and 22.6% and 36.2% for subtle masses on prior mammograms at 0.5 and 1 FPs∕image, respectively. With the new two-view dual system approach, the average case-based sensitivities were improved to 67.4% and 83.7% for average masses and 44.8% and 57.0% for subtle masses at the same FP rates.
Conclusions: The improvement with the proposed method was found to be statistically significant (p<0.0001) by JAFROC analysis.
Keywords: computer-aided detection, breast mass, false positive reduction
INTRODUCTION
In screening mammography, two mammographic views, craniocaudal (CC) and mediolateral oblique (MLO) views, are routinely performed for each breast. During mammographic interpretation, the radiologist combines the information from the two views and evaluates the changes from available prior examinations to confirm true positives (TPs) and to reduce false positives (FPs). It has been reported that screening mammography using two views per breast rather than one view can increase cancer detection sensitivity, while decreasing the recall rate.1, 2 Two-view screening mammography has become the most common and standard method for breast cancer screening in developed countries.
Investigators have attempted to implement multiple image techniques in computer-aided detection (CAD) systems to improve the accuracy of lesion analysis on mammograms. Kita et al.3 developed a method to find correspondences between CC and MLO views of the same breast. Their method was based on modeling the deformation of the breast caused by compression in different views. For a data set of 37 lesions, their method could predict the location in the second view with an average minimum distance of 6.78±5.85 mm between the correct position and an epipolar line.3 Paquerault et al.4 investigated a two-view fusion scheme to improve the performance of a CAD system for mass detection. In their preliminary study, the computer-detected object pairs in two views were first identified by using the distance between the nipple and the detected objects.5 A trained correspondence classifier was then used to differentiate the TP-TP pairs from other pairs using extracted image features. Finally, a fusion scheme that combined ranking and averaging of the prescreening and correspondence scores was used to estimate a final mass score for each prescreened object. Using 169 pairs of mammograms, they found that the two-view fusion system achieved a significant improvement compared to their single-view CAD system.
In a recent study, van Engeland et al.6 investigated a method in which a two-view classifier was trained with both single-view and two-view features to classify the TP from normal structures instead of training a classifier to differentiate the object pairs. They evaluated the method using 948 cases and found that the method mainly improved the image-based free response ROC (FROC) curve in the high specificity range. However, no improvement was found in the case-based FROC curve and they also pointed out that their method may be less relevant when a CAD system is merely used to prompt regions at a high false positive rate. Sahiner et al.7 investigated the use of joint two-view information to improve computerized microcalcification detection. The two-view fusion method was trained and tested on a total of 486 paired mammograms. The improvement in detection with their method was found to be statistically significant for both malignant and benign clusters. Zheng et al.8 proposed a two-view CAD system for masses which aimed to reduce the FP rate on a given sensitivity level. It was found that at a 74.4% case-based sensitivity, their two-view approach reduced the FP rate by 23.7%. Qian et al.9 designed a method for fusing detection results and image features from two views. On a data set of 200 normal mammograms and 200 mammograms containing small (<10 mm) masses, they obtained a significantly improved detection performance when they used their two-view mammogram analysis method. Recently, Velikova et al.10 proposed a Bayesian network framework that used the dependences between MLO and CC views to obtain a single measure for estimating whether the mammographic view, the breast, and the case contains a cancerous lesion. With the use of the Bayesian network, they obtained a statistically significant improvement compared to single-view analysis for estimating whether the view contains a malignant mass. Furthermore, when the view-based results were combined using logistic regression to estimate whether the breast or the case contains a malignant mass, the improvement was again statistically significant.
The detection of masses on mammograms is a challenging task because the overlapping fibroglandular tissue may mimick a mass or obscures the lesion. Although researchers have devoted extensive efforts to the development of CAD systems for mass detection, the performances of current CAD systems are far from ideal. We have been developing various new techniques to improve the accuracy of mass detection.11, 12 In our previous study, we proposed a dual CAD system approach that combined two mass detection systems in parallel, one was trained with masses of average subtlety and the other with subtle masses. The dual system approach achieved significant improvement in the detection of both average and subtle masses compared to the conventional single system approach.13 We have also demonstrated the feasibility of a new two-view analysis method for fusion of information from different mammographic views.14 In this study, our purpose is to further improve the two-view fusion method and to develop a CAD system which combines the dual system approach with the two-view approach. The effectiveness of the new two-view dual CAD system is evaluated with a relatively large data set.
MATERIALS AND METHODS
Image data sets
All mammograms in this study were collected retrospectively from patient files of the Department of Radiology at the University of Michigan with Institutional Review Board (IRB) approval. The mammograms were digitized with a LUMISYS 85 laser film scanner with a pixel size of 50×50 μm2 and 4096 gray levels. The full resolution mammograms were first smoothed with 2×2 box filter and subsampled by a factor of 2, resulting in 100×100 μm2 images. The images at a pixel size of 100×100 μm2 were used as the input to the CAD system.
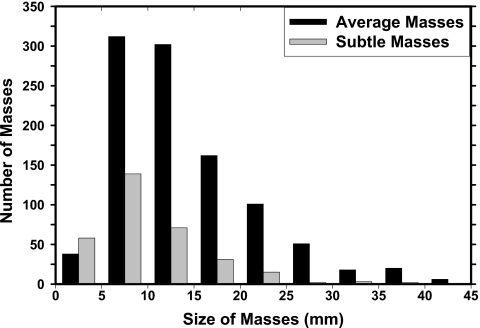
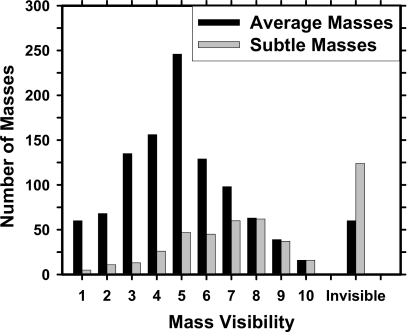
Two independent data sets of mammograms were collected for this study: A mass set with biopsy-proven malignant or benign masses and a normal set containing bilateral mammograms. The mass set contained 535 cases with 535 biopsy-proven masses in which 345 cases included only current mammograms and 190 cases included both the current and the prior mammograms. 233 of the masses are biopsy proven to be malignant and 302 to be benign. Each case contained two mammographic views (CC view and MLO view or the lateral view). The total number of mammograms in the mass set is 1532 including 1070 current mammograms and 462 prior mammograms in which 35 cases have two prior exams and 3 cases have three prior exams. The true location of each mass was identified independently on each mammographic view by an experienced MQSA-approved radiologist. The masses on the current mammograms are referred to as “average” and the masses on prior exams are referred to as “subtle” because many of those may not show a well-perceived mass even on retrospective review. The normal data set contained 800 mammograms from 200 patients; each case included the CC view and MLO view of both breasts. The normal data set was only used for estimating the FP rate during testing. Figures 12 show the histograms of mass size and visibility, respectively, for the mass set.
Figure 1.
Distributions of the mass sizes for 535 average masses identified on the current mammograms and 190 subtle masses identified on the prior mammograms. The size for each mass is measured independently as the longest diameter on each mammographic view by an experienced MQSA radiologist. The mean sizes are 15.0±7.7 mm for average masses and 10.9±6.6 mm for subtle masses, respectively.
Figure 2.
Histogram of the mass visibility for 1070 average masses by view identified on the current mammograms and 462 subtle masses by view identified on the prior mammograms. The visibility is evaluated on a 10-point rating scale with 1 representing the most visible masses and 10 the most difficult case relative to the cases seen in their clinical practice. Each mass on a mammogram is rated independently by an experienced MQSA radiologist. There are 60 invisible masses on current mammograms and 124 invisible masses on prior mammograms.
Methods
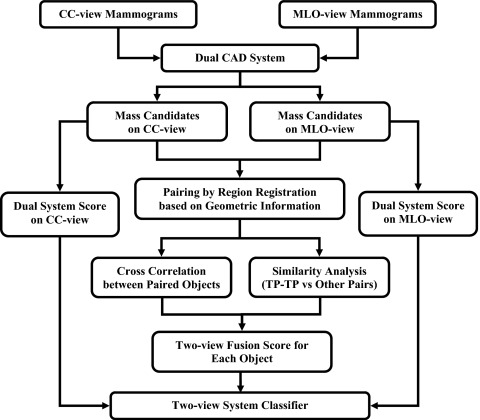
Figure 3 shows a schematic of our dual CAD system with two-view analysis. The two-view dual system approach is described in detail below.
Figure 3.
Schematic diagram of our dual system two-view approach for mass detection on mammograms. The system is developed for screening mammography in which all masses, regardless of malignant or benign, are considered positive.
Dual CAD system approach
An important purpose of a CAD system is to serve as a second reader to alert radiologists to subtle cancers that may be overlooked. Since the lesions identified on prior mammograms upon retrospective review represent difficult cases that are more likely to be overlooked by radiologists if similar lesions occur on screening mammograms, it is important to improve the sensitivity of the CAD system in detecting these lesions. On the other hand, when a CAD system is applied to a new mammogram in clinical practice, it has to detect breast lesions of all degrees of subtlety effectively. However, it is difficult to train a single CAD system to provide optimal detection for all lesions over the entire spectrum of subtlety because the classifiers have to make compromises to accommodate lesions of a wide range of characteristics.
We have developed a dual system approach and demonstrated that it could improve the overall performance of our CAD system.13 Briefly, the dual system is composed of two single CAD systems in parallel. The two systems have the same architecture that includes four processing steps: (1) Prescreening of mass candidates, (2) segmentation of suspicious objects, (3) feature extraction and analysis, and (4) FP reduction by classification of normal tissue structures and masses. They were optimized separately by using two different training sets, one contained current mammograms with average masses and the other prior mammograms with subtle masses. The two data sets did not need to come from the same subjects. After the two single systems were trained separately, they were trained together with a single training set for the dual system information fusion step using an artificial neural network. For an input unknown mammogram, the two systems are applied in parallel and each system estimates a mass likelihood score for every detected object, the trained artificial neural network merges the mass likelihood scores of the two single CAD systems for a given object to differentiate true masses from FPs. The details can be found in literature.13
The single-view dual system, described above, constitutes the first stage of the new two-view dual system in the current study. To perform the two-view analysis, a threshold was chosen to retain a small number of the most suspicious objects per mammographic view as input mass candidates to the two-view fusion stage, described next.
Two-view information fusion
The mass candidates on one view will be paired with mass candidates on the other view based on a regional registration method using geometric criteria. The paired objects will undergo two-view similarity analysis to differentiate TP and FP pairs. The two-view analysis is based on two assumptions: (1) The likelihood of detecting a true mass on both views is higher than that of detecting the same FPs on both views and (2) the corresponding true masses (TP-TP pair) on two different mammographic views will exhibit higher similarity than that of FP pairs (TP-FP pairs and FP-FP pairs) in terms of morphological features, texture features, and cross correlation.
The key process of our two-view CAD system is the information fusion in which the suspicious objects on different mammographic views are paired together and a unique fusion score is generated for each individual object. Our two-view information fusion scheme consists of four steps: (1) Regional registration by using geometric information, (2) estimation of image similarity measure between paired objects using cross correlation, (3) estimation of feature similarity measure by designing a classifier for differentiation of TP-TP pairs from other pairs, and (4) generation of two-view fusion score. Figure 3 shows the block diagram of the two-view information fusion process for suspicious objects on the CC and MLO views of the same breast. Each step is described below in detail.
Regional registration
Because of the compression of the highly deformable breast and the lack of invariant landmarks in most cases, it is virtually impossible to pinpoint the corresponding locations on different views. We previously developed a regional registration method for locating the approximate locations of corresponding objects on mammograms acquired at different views.4 From the geometry of the mammographic image acquisition, it is known that an object seen on the CC view can appear only in a limited region in the MLO view, and vice versa. Radiologists at our institution routinely use the nipple-to-object distance (NOD) to estimate the correspondence between objects seen on different views of the same breast. We emulate the radiologists’ technique and use the NOD as the geometric matching criterion for initial registration of potential pairs.
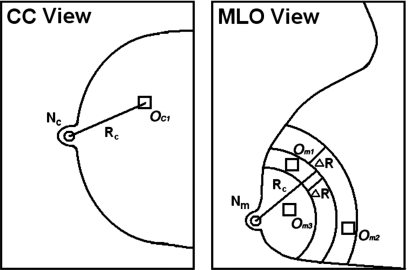
The regional registration is performed in a polar coordinate system the origin of which is located at the nipple location. Figure 4 illustrates the process of our regional registration method for a suspicious object on CC view. Using the distance NOD=Rc from the nipple Nc to the center OC1 of the object on CC view, an annular region that is bounded by two arcs of radii Rc±ΔR is defined on MLO view with the nipple Nm as the center. The radial width of the annular region 2ΔR was estimated with a large data set to be ±3 cm in our previous study.5 Any suspicious object on MLO view that fall within the annular region is paired with the object OC1 on the CC view. In this example, Om1 and Om2 are paired with OC1. After the regional registration process is performed for all suspicious objects detected on the CC view, a number of object pairs that include true mass pairs (TP-TP pairs) and false pairs (FP-TP, TP-FP, and FP-FP pairs) are generated.
Figure 4.
Illustration of the process of our regional registration method for locating potential object pairs on CC and MLO views.
We developed an automated nipple detection method previously15 but it did not detect the nipple location correctly in all mammograms. To evaluate the feasibility of the two view analysis method independent of the nipple detection errors, we used manually identified nipple locations in this study.
Cross correlation measure
In this step, a template matching approach is used to measure the similarity of the two objects in order to distinguish the truly matched object pairs from the incorrect object pairs. Cross correlation is a popular template matching method. A previous study from our laboratory found that cross correlation was superior to 11 other similarity measures for matching corresponding masses on serial mammograms.16 In this study, we therefore use cross correlation as the similarity measure to match the same mass appearing on different views. Assume that a mass candidate on the CC view has been paired with several detected objects in the annular region on the MLO view. For a given object pair, the suspicious regions on CC and MLO views are denoted as Ic and Im, respectively, where the region Ic is a box enclosing the mass candidate detected by the dual CAD system on the CC view and the size of which is determined by the segmentation of the object on this view. The region size is thus varied for each of the candidate object. Because the detected objects may not be centered at the bounding box, a 2×2 mm2 search region is defined with its center at the central location of the paired object on the MLO view. The center of the reference region Ic is placed within the search region and moved one pixel at a time over the entire search region. The cross correlation (r) between Ic and Im, where Im is a region with the same size as Ic and centered at each location on the MLO view, is calculated as shown below
| (1) |
where denotes the ith pixel in the region Ix (x=c,m), n is the number of pixels in the reference object region Ic, and
| (2) |
The cross correlation measure is defined as the maximum r value among all locations within the search region.
Two-view similarity classification
We assumed that the features of the same mass on different views will show more similar properties than those of false pairs so that true mass pairs (TP-TP pairs) can be distinguished from false pairs by performing feature classification in the combined space of similarity features.
Three groups of features, morphological features, Hessian features, and texture features are extracted from each object. Similarity features are derived as the absolute difference and the mean of the corresponding features of each object pair. These similarity features, in combination with the geometric similarity, i.e., the difference in NOD between the paired objects, formed the feature space for classification of true pairs from false pairs. A linear discriminant analysis (LDA) classifier was trained to estimate a two-view similarity score for each object pair as detailed in Sec. 2B4 below.
A total of 13 morphological features was extracted as the descriptors of the segmented mass shape. The morphological feature descriptors include the area in terms of the number of pixels in the object, circularity, contrast, convexity, Fourier descriptor, normalized radial length (NRL) mean, NRL area ratio, NRL entropy, NRL standard deviation, NRL zero crossing count, perimeter, perimeter-to-area ratio, and rectangularity. The detailed definitions were described in our previous study.17
Hessian features are derived from the eigenvalues of Hessian matrices in the region of interest (ROI) containing a suspicious object in order to distinguish circular objects from other objects. The Hessian matrix for a 2D image f(x,y) is defined as
| (3) |
where fxx=(∂2∕∂x2)f, fxy=fyx=(∂2∕∂x∂y)f, and fyy=(∂2∕∂y2)f. To enhance local structures of variable sizes and also reduce the noise, f(x,y) is convolved with multiscale Gaussian filters having a range of standard deviations (δs=4–10 mm) before calculating the Hessian matrices. We designed a response function for mass enhancement at a location (x,y) and a given scale as
| (4) |
where λ1 and λ2 are the eigenvalues of Eq. 3 with ∣λ1∣⩾∣λ2∣ at the scale with Gaussian filter δs. The Hessian feature at a location (x,y) is defined as the maximum value of the response at that location among all scales. Three Hessian features, the Hessian feature at the center location of the ROI (H1), the maximum Hessian feature within the ROI (H2), and the difference between H1 and H2, are calculated for each object.
The texture features are described by the run length statistics (RLS) as follows. The rubber-band straightening transform (RBST) is applied to each object. A band of 60-pixel-wide region around the object margin is transformed to a rectangular image. A gradient magnitude image of the transformed rectangular object margin is derived from Sobel filtering. Five RLS texture features—short run emphasis, long run emphasis, gray level nonuniformity, run length nonuniformity, and run percentage—are extracted from the gradient image in both the horizontal and vertical directions, resulting in a total of ten RLS texture features. Detailed definition of the RBST and the RLS texture features for mammographic masses can be found in the literature.18
Generation of two-view fusion score
Since the correspondence of the location of an object projected on different views cannot be determined accurately, several situations will occur. An object on one view may pair with a single object, with multiple objects, or with no object, depending on the number of objects within the annular region on the second view defined for the given object. Each object pair will obtain a similarity score after the LDA classification. We have designed a fusion method to assign a unique score for the suspicious object on the first view from the similarity analysis. The similarity LDA score of the object pair is first weighted by (i.e., multiplied with) the cross correlation measure of the pair. The weighted LDA score is then used as the fusion score for the object if there is only a single object pair. For an object that was paired with multiple objects, the maximum weighted LDA score among all object pairs is chosen as the fusion score for the object. For an object without object pairs, the fusion score is set to be −2.0 as penalty. The value of −2 was chosen because it was slightly smaller than the minimum fusion score obtained in the training set.
Two-view system classifier
During this final stage, we have designed a third LDA classifier with two input features, the mass likelihood score from the single-view dual system detection stage and the fusion score from the two-view analysis, to distinguish the mass from normal tissue on each view. The same two-view fusion process is applied to the mass candidates on each view so that each view will have a set of detected objects with individual scores at the output of this two-view system LDA classifier. The classifier training and testing processes are described below.
Training and testing
To train and test the proposed computerized methods, we randomly separated the mass data sets by case into two approximately equal-size independent subsets. Twofold cross validation was used for training and testing the algorithms. In each cross-validation cycle, we used the training subset for that cycle to select the optimal feature set and train the parameters of the classifiers for the single-view dual system, the two-view similarity analysis, and the two-view dual system. For each classifier, the classification accuracy for the training subset was optimized in terms of the area under the ROC curve, Az. The single-system LDA classifiers would be trained to combine the multidimensional features into the mass likelihood score for each object from the single-view system detection stage, and a neural network classifier was trained to merge the single system scores into a dual system score. The two-view fusion LDA classifier would be trained to combine the multidimensional similarity features into a similarity measure for the paired objects. The two-view dual system LDA classifier would be trained to differentiate TPs from FPs.
The LDA classifiers for the single-system and the two-view similarity analysis were trained with feature selection. Our procedures for feature selection and classifier design have been described in detail elsewhere.11, 19, 20 Briefly, feature selection with stepwise LDA (Ref. 21) and simplex optimization were used to select the best feature subset and reduce the dimensionality of the feature space. The best combination of the stepwise feature selection parameters, including the threshold values for feature entry, feature removal, and tolerance of feature correlation, was first chosen by using a leave-one-case-out resampling method and a simplex optimization procedure within the training subset. The Az from the leave-one-case-out testing was used as the figure of merit (FOM) to guide the search for the maximum in the parameter space. Using the best set of parameters and the training subset alone, a final stepwise feature selection was then performed to select a set of features and the weights of the LDA were estimated.
Once the training with one mass subset was completed, the parameters were fixed and applied to the cross-validation test subset. The entire training and testing processes were repeated for the other cross-validation cycle in which the training and test subsets were switched. The set of normal mammograms was not used during training. The trained system from each cycle was applied to the normal set to estimate its FP rate in screening mammograms.
Performance analysis
The detection performance of the two-view dual CAD system was assessed by free response ROC (FROC) analysis. An FROC curve was obtained by plotting the mass detection sensitivity as a function of FP marks per image at the corresponding decision threshold. The mass detection sensitivity was determined by the detected masses on the test mass subset, whereas the number of FP marks produced by the CAD system was determined by the detected objects on the normal cases only. FROC curves were presented on a per-mammogram and a per-case basis. For image-based FROC analysis, the mass on each mammogram was considered an independent true object. For case-based FROC analysis, the same mass imaged on the two-view mammograms was considered to be one true object and detection of either mass or both masses on the two views was considered to be a TP detection. Since we used twofold cross validation method for training and testing, we obtained two test FROC curves, one for each test subset, for each of the conditions (e.g., single-view approach or two-view approach). In order to compare the performance of the single-view and the two-view CAD systems, we applied the jackknife free-response ROC (JAFROC) method developed by Chakraborty et al.22 to each pair of the image-based FROC curves obtained with the two systems for the same test subset. To summarize the results for comparison, an average test FROC curve was derived by averaging the FP rates at the same sensitivity along the FROC curves of the two test subsets for each condition.
RESULTS
Single-view dual CAD system
During the first step of our two-view analysis, our previously developed dual CAD system13 was used as the single-view system to detect mass candidates as input to the later stages. We experimentally chose a criterion of using a maximum of five most suspicious mass candidates per image from the single-view detection stage which is a compromise between high sensitivity to retain masses on both views to be paired and the FP rate not being excessively high. With this criterion, the image-based and case-based sensitivities on the current mass set were 88.6% and 95.4%, respectively, while the corresponding sensitivities for the prior mass set were 71.3% and 80.7%, respectively.
Regional registration
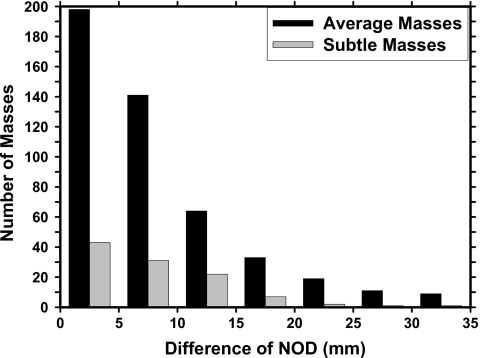
In this study, we used the NOD to register the mass candidates identified by the single view CAD system. Figure 5 showed the histogram of the NOD difference for the same mass which were identified by radiologists on different mammographic views. In our mass set, there were a total of 475 average masses on current mammograms and 107 subtle masses on prior mammograms which could be seen on both views. We used 30 mm as the upper bound to match the object pairs from the same breast and thus the annular region was chosen to have a radial width of ±30 mm. Under this condition, 9 out of 475 average masses and 1 out of 107 subtle masses were not able to be paired correctly. During the regional registration process, there were a total of 8271 object pairs from the two mass subsets which generated an average of 10.8 object pairs in the CC and MLO views of a breast and 4152 object pairs from the normal data set with an average of 10.4 object pairs in the two views of a breast. After the regional registration, we were able to match only 86.3% (410 out of 475) of the mass pairs on current mammograms and 57.9% (62 out of 107) of the mass pairs on prior mammograms. Of the average masses, 11.8% (56 out of 475) of the misses were caused by either one or both of the masses being missed by the dual CAD system, and only 1.9% (9 out of 475) of the average masses could not be matched because the difference in the NODs was larger than 30 mm. For the subtle masses on prior mammograms, the corresponding missed rates were 41.1% (44 out of 107) and 0.9% (1 out of 107), respectively.
Figure 5.
Distributions of the NOD differences for the same mass on different mammographic views identified by radiologists.
Two-view similarity classification
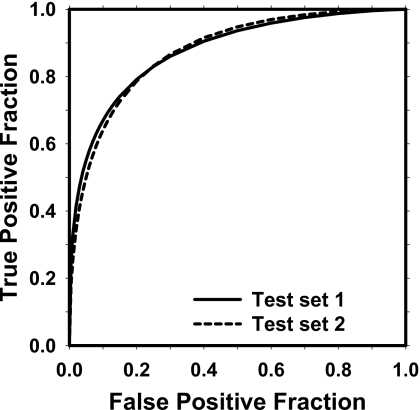
For two-view similarity classification, the number of the selected features from the two mass subsets was 6 (difference in NOD, average of segmented area, average of Hessian output, and three average RLS texture features) and 7 (Difference in NOD, average of segmented area, average of Hessian output, difference in NRL entropy, and three average RLS texture features), respectively. Figure 6 shows the test ROC curves of the two-view similarity classifier on mass subsets obtained from cross-validation testing with Az values of 0.87±0.01 and 0.88±0.01, respectively.
Figure 6.
The test ROC curves for classification of TP-TP pairs from other pairs on two test mass subsets. The Az values for the two mass subsets obtained from cross-validation testing were 0.87±0.01 and 0.88±0.01, respectively.
Detection performance comparison
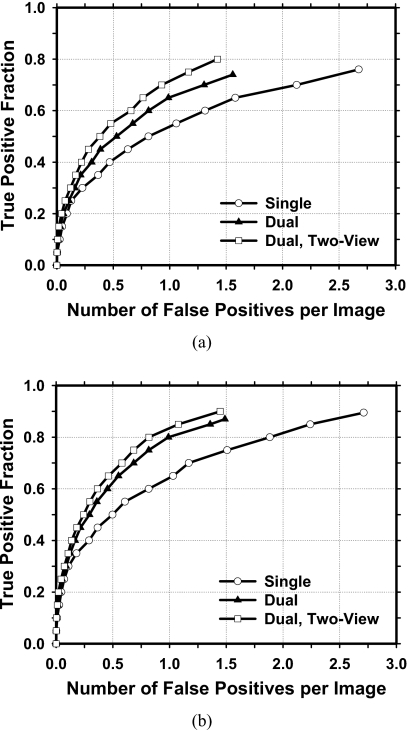
The test FROC curves for average masses on current mammograms are compared in Fig. 7. The FOMs and the p values of the difference between pairs of image-based FROC curves under different conditions estimated by JAFROC analysis are tabulated in Table 1. Because of the multiple comparisons, the p value to achieve statistical significance may be reduced to 0.002 (=0.05∕24) using the conservative Bonferroni correction.23, 24 All paired comparisons achieved statistical significance (p<0.002). When the single CAD system was applied to the test sets, the average case-based sensitivities were 50.6% and 63.6% at 0.5 and 1.0 FPs∕image, respectively, for the average masses on current mammograms. When the dual CAD system was applied to the test sets, the average case-based sensitivities were improved to 62.1% and 80.1%, respectively, at the same FP rates for the average masses. With the proposed two-view dual system, the average case-based sensitivities were further improved to 67.4% and 83.7%, respectively, at the same FP rates.
Figure 7.
Comparison of the average test FROC curves obtained from averaging the FROC curves of the two independent subsets for average masses on current mammograms. The FP rate was estimated from normal mammograms. (a) Image-based FROC curves. (b) Case-based FROC curves.
Table 1.
Estimation of the statistical significance of the difference between the FROC curves for three approaches: The single CAD system, the dual system, and the two-view dual system. The FROC curves with the FP marker rates obtained from the normal data set were compared. The pairs of image-based FROC curves were compared to JAFROC methodology. The figure of merit from JAFROC analysis for each curve is shown.
| JAFROC Analysis | FOM (average masses) | |||
|---|---|---|---|---|
| All cases | Malignant cases | |||
| Test subset 1 | Test subset 2 | Test subset 1 | Test subset 2 | |
| Single system | 0.63 | 0.63 | 0.58 | 0.60 |
| Dual system | 0.69 | 0.69 | 0.68 | 0.69 |
| p values | <0.0001 | <0.0001 | <0.0001 | <0.0001 |
| Dual system | 0.69 | 0.69 | 0.68 | 0.69 |
| Two-view dual system | 0.73 | 0.72 | 0.74 | 0.74 |
| p values | 0.0003 | 0.001 | <0.0001 | 0.0004 |
| Single system | 0.63 | 0.63 | 0.58 | 0.60 |
| Two-view dual system | 0.73 | 0.72 | 0.74 | 0.74 |
| p values | <0.0001 | <0.0001 | <0.0001 | <0.0001 |
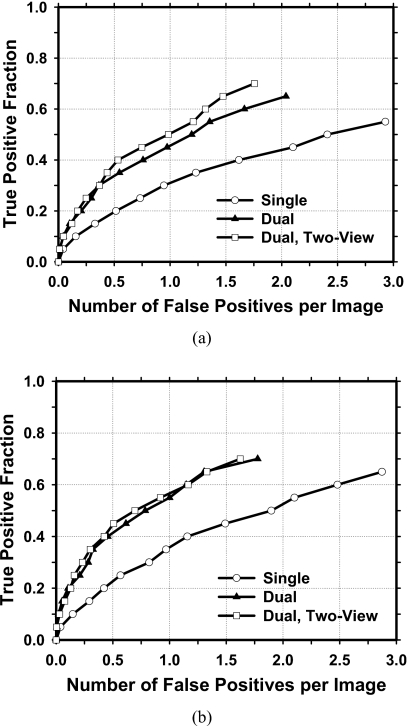
The improvement with the proposed approach was also analyzed for the subtle masses on prior mammograms (Fig. 8). The FOMs and the p values of the difference between pairs of image-based FROC curves under different conditions estimated by JAFROC analysis for subtle masses are tabulated in Table 2. The dual system and the two-view dual system have significantly higher (p<0.002) detection performances than the single system, whereas the difference between the dual system and the two-view dual system did not achieved statistical significance (p>0.002). When the single CAD system was applied to the test subsets, the average case-based sensitivities were 22.6% and 36.2% at 0.5 and 1.0 FPs∕image, respectively, for the subtle masses on prior mammograms. When the dual CAD system was applied to the test subsets, the average case-based sensitivities were improved to 41.5% and 55.5%, respectively, at the same FP rates. With the proposed two-view dual system, the average case-based sensitivities for subtle masses were further improved to 44.8% and 57.0%, respectively, at the same FP rates.
Figure 8.
Comparison of the average test FROC curves obtained from averaging the FROC curves of the two independent subsets for subtle masses on prior mammograms. The FP rate was estimated from normal mammograms. (a) Image-based FROC curves. (b) Case-based FROC curves.
Table 2.
Estimation of the statistical significance of the difference between the FROC curves for three approaches: The single CAD system, the dual system, and the two-view dual system. The FROC curves with the FP marker rates obtained from the normal data set were compared. The pairs of image-based FROC curves were compared to JAFROC methodology. The figure of merit from JAFROC analysis for each curve is shown.
| JAFROC Analysis | FOM (subtle masses) | |||
|---|---|---|---|---|
| All cases | Malignant cases | |||
| Test subset 1 | Test subset 2 | Test subset 1 | Test subset 2 | |
| Single system | 0.42 | 0.39 | 0.37 | 0.32 |
| Dual system | 0.48 | 0.46 | 0.48 | 0.45 |
| p values | <0.0001 | <0.0001 | <0.0001 | <0.0001 |
| Dual system | 0.48 | 0.46 | 0.48 | 0.45 |
| Two-view dual system | 0.52 | 0.49 | 0.52 | 0.48 |
| p values | 0.111 | 0.078 | 0.305 | 0.219 |
| Single system | 0.42 | 0.39 | 0.37 | 0.32 |
| Two-view dual system | 0.52 | 0.49 | 0.52 | 0.48 |
| p values | <0.0001 | <0.0001 | <0.0001 | <0.0001 |
DISCUSSION AND CONCLUSION
We have been developing CAD methods for mass detection on mammograms. We previously designed a dual system approach to improve the overall performance for mass detection.13 We also conducted a feasibility study of a new two-view analysis method.14 In this study, we combined these two new approaches into a two-view dual CAD system to further improve its detection accuracy and evaluated its performance in a relatively large data set. Our results indicated that the proposed system could significantly improve the mass detection accuracy in comparison to the single CAD system and the dual CAD system for average masses, whereas the difference in the performances between the two-view dual system and the single-view dual system did not achieve statistical significance for subtle masses.
The improvement achievable with the two-view fusion analysis depends strongly on the sensitivity of the single-view detection stage. If the lesion is missed in the single-view detection, the two-view analysis will not improve the sensitivity. We used the dual-system analysis as the first step in order to detect as many masses as possible (especially for subtle masses) on single views. Although the improvement by dual system analysis was substantial in comparison with the single CAD system, 110 masses (65 out of 475 average masses and 45 out of 107 subtle masses) still could not be matched after regional registration. The improvement that was achieved by the two-view analysis was therefore somewhat limited, especially for the subtle masses. For average masses on current mammograms, when we only analyzed the masses which could form TP-TP pairs during regional registration (410 for the average mass set), it was found that the average case-based sensitivities reached 73.4% and 85.7% at FP rates of 0.5 and 1.0 per image, respectively, with the two-view dual system. Similarly, for the subtle mass set, the average case-based sensitivities reached 67.7% and 80.6% (62 for the subtle mass set) at the same FP rates. It can therefore be expected that the improvement by two-view analysis will be greater when the single-view detection system can be further improved in the future.
It may be noted that the improvement in detection sensitivity obtained by two-view analysis is different from the apparent increase by case-based FROC analysis. In case-based FROC analysis, a mass is considered to be detected if it is detected either on one view or on two views. With two-view analysis, there is a true improvement in the detection sensitivity, as can be observed from the comparison of the image-based FROC curves. If an additional detected mass is in the other view of a breast for which the mass is already counted as TP in the case-based FROC curve for single-view analysis, this additional detection will not contribute to an improvement in the case-based FROC curve for two-view analysis. This is the reason that the difference between the two case-based FROC curves for the single-view and two-view analysis is smaller than that observed between the two image-based FROC curves. However, we could not conduct a statistical comparison for case-based FROC curves due to the fact that the FPs from the two views might not be independent and a statistical test is not yet available under this situation. Case-based performance is more generally reported by researchers and CAD system manufacturers so that it is more often used for comparing the detection performance between CAD systems. One should note that the actual image-based detection performance of two systems with similar case-based performance can be significantly different. For clinical applications, there is a practical advantage to increase the sensitivity by two-view analysis because radiologists have greater confidence in a lesion being a TP if the same lesion is detected on both views and are less likely to ignore the CAD mark. Dismissing correct CAD marks has been observed to be a major cause of some radiologists not gaining the benefit of using CAD.
In summary, we have developed a two-view dual CAD system to improve computerized detection of breast masses on mammograms. Our results indicate that the proposed CAD system significantly improved the detection performance as estimated by the JAFROC analysis. The improvement by two-view analysis is strongly related to the performance of the single-view detection system. The performance of the two-view dual system can potentially be further improved if the single-view CAD system is improved. We manually identified the nipple locations for the two-view analysis in this study. We will continue to improve the accuracy of our automated nipple detection method15 so that we can fully automate the two-view analysis in the future.
ACKNOWLEDGMENTS
This work was supported by U. S. Army Medical Research and Materiel Command Grant No. W81XWH-1-04-1-0475, USPHS Grant No. CA95153, and RX 4300-019-UM (Subcontract of USPHS Grant No. R21∕R33 CA 102960 from Georgetown University). The content of this paper does not necessarily reflect the position of the government and no official endorsement of any equipment and product of any companies mentioned should be inferred. The authors are grateful to Charles E. Metz, Ph.D., for the LABROC program and to Dev Chakraborty, Ph.D., for the JAFROC1 program.
References
- Thurfjell E., Taube A., and Tabar L., “One-view versus 2-view mammography screening—A prospective population-based study,” Acta Radiol. 35, 340–344 (1994). [PubMed] [Google Scholar]
- Warren R., Duffy S., and Bashir S., “The value of the second view in screening mammography,” Br. J. Radiol. 69, 105–108 (1996). 10.1259/0007-1285-69-818-105 [DOI] [PubMed] [Google Scholar]
- Kita Y., Highnam R. P., and Brady J. M., “Correspondence between different view breast x rays using curved epipolar lines,” Comput. Vis. Image Underst. 83, 38–56 (2001). 10.1006/cviu.2001.0908 [DOI] [Google Scholar]
- Paquerault S., Petrick N., Chan H. P., Sahiner B., and Helvie M. A., “Improvement of computerized mass detection on mammograms: Fusion of two-view information,” Med. Phys. 29, 238–247 (2002). 10.1118/1.1446098 [DOI] [PubMed] [Google Scholar]
- Paquerault S., Sahiner B., Petrick N., Hadjiiski L. M., Gurcan M. N., Zhou C., and Helvie M. A., “Prediction of object location in different views using geometrical models,” presented at the IWDM-2000, Toronto, Canada, June 11–14, 2000; in Digital Mammography IWDM 2000: 5th International Workshop on Digital Mammography, edited by Yaffe M. J. (Medical Physics, Madison, WI, 2000), pp. 748–755.
- van Engeland S. and Karssemeijer N., “Combining two mammographic projections in a computer aided mass detection method,” Med. Phys. 34, 898–905 (2007). 10.1118/1.2436974 [DOI] [PubMed] [Google Scholar]
- Sahiner B., Chan H.-P., Hadjiiski L. M., Helvie M. A., Paramagul C., Ge J., Wei J., and Zhou C., “Joint two-view information for computerized detection of microcalcifications on mammograms,” Med. Phys. 33, 2574–2585 (2006). 10.1118/1.2208919 [DOI] [PMC free article] [PubMed] [Google Scholar]
- Zheng B., Leader J. K., Abrams G. S., Lu A. H., Wallace L. P., Maitz G. S., and Gur D., “Multiview-based computer-aided detection scheme for breast masses,” Med. Phys. 33, 3135–3143 (2006). 10.1118/1.2237476 [DOI] [PubMed] [Google Scholar]
- Qian W., Song D. S., Lei M. S., Sankar R., and Eikman E., “Computer-aided mass detection based on ipsilateral multiview mammograms,” Acad. Radiol. 14, 530–538 (2007). 10.1016/j.acra.2007.01.012 [DOI] [PubMed] [Google Scholar]
- Velikova M., Samulski M., Lucas P. J. F., and Karssemeijer N., “Improved mammographic CAD performance using multi-view information: A Bayesian network framework,” Phys. Med. Biol. 54, 1131–1147 (2009). 10.1088/0031-9155/54/5/003 [DOI] [PubMed] [Google Scholar]
- Wei J., Sahiner B., Hadjiiski L. M., Chan H. P., Petrick N., Helvie M. A., Roubidoux M. A., Ge J., and Zhou C., “Computer aided detection of breast masses on full field digital mammograms,” Med. Phys. 32, 2827–2838 (2005). 10.1118/1.1997327 [DOI] [PMC free article] [PubMed] [Google Scholar]
- Wei J. et al. , “Computer aided detection systems for breast masses: Comparison of performances on full-field digital mammograms and digitized screen-film mammograms,” Acad. Radiol. 6, 659–669 (2007). 10.1016/j.acra.2007.02.017 [DOI] [PMC free article] [PubMed] [Google Scholar]
- Wei J., Chan H.-P., Sahiner B., Hadjiiski L. M., Helvie M. A., Roubidoux M. A., Zhou C., and Ge J., “Dual system approach to computer-aided detection of breast masses on mammograms,” Med. Phys. 33, 4157–4168 (2006). 10.1118/1.2357838 [DOI] [PMC free article] [PubMed] [Google Scholar]
- Wei J., Sahiner B., Hadjiiski L. M., Chan H.-P., Helvie M. A., Roubidoux M. A., Zhou C., Ge J., and Zhang Y., “Two-view information fusion for improvement of computer-aided detection (CAD) of breast masses on mammograms,” Proc. SPIE 6144, 241–247 (2006). [Google Scholar]
- Zhou C., Chan H.-P., Paramagul C., Roubidoux M. A., Sahiner B., Hadjiiski L. M., and Petrick N., “Computerized nipple identification for multiple image analysis in computer-aided diagnosis,” Med. Phys. 31, 2871–2882 (2004). 10.1118/1.1800713 [DOI] [PMC free article] [PubMed] [Google Scholar]
- Filev P., Hadjiiski L. M., Sahiner B., Chan H. P., and Helvie M. A., “Comparison of similarity measures for the task of template matching of masses on serial mammograms,” Med. Phys. 32, 515–529 (2005). 10.1118/1.1851892 [DOI] [PubMed] [Google Scholar]
- Sahiner B., Chan H. P., Petrick N., Helvie M. A., and Hadjiiski L. M., “Improvement of mammographic mass characterization using spiculation measures and morphological features,” Med. Phys. 28, 1455–1465 (2001). 10.1118/1.1381548 [DOI] [PubMed] [Google Scholar]
- Sahiner B., Chan H. P., Petrick N., Helvie M. A., and Goodsitt M. M., “Computerized characterization of masses on mammograms: The rubber band straightening transform and texture analysis,” Med. Phys. 25, 516–526 (1998). 10.1118/1.598228 [DOI] [PubMed] [Google Scholar]
- Chan H. P., Wei D., Helvie M. A., Sahiner B., Adler D. D., Goodsitt M. M., and Petrick N., “Computer-aided classification of mammographic masses and normal tissue: Linear discriminant analysis in texture feature space,” Phys. Med. Biol. 40, 857–876 (1995). 10.1088/0031-9155/40/5/010 [DOI] [PubMed] [Google Scholar]
- Hadjiiski L. M., Sahiner B., Chan H. P., Petrick N., Helvie M. A., and Gurcan M. N., “Analysis of temporal change of mammographic features: Computer-aided classification of malignant and benign breast masses,” Med. Phys. 28, 2309–2317 (2001). 10.1118/1.1412242 [DOI] [PubMed] [Google Scholar]
- Norusis M. J., SPSS for Windows Release 6 Professional Statistics (SPSS, Chicago, IL, 1993). [Google Scholar]
- Chakraborty D. P., “Validation and statistical power comparison of methods for analyzing free-response observer performance studies,” Acad. Radiol. 15, 1554–1566 (2008). 10.1016/j.acra.2008.07.018 [DOI] [PMC free article] [PubMed] [Google Scholar]
- Shaffer J. P., “Multiple hypothesis testing,” Annu. Rev. Psychol. 46, 561–584 (1995). 10.1146/annurev.ps.46.020195.003021 [DOI] [Google Scholar]
- Perneger T. V., “What’s wrong with Bonferroni adjustments,” Br. Med. J. 316, 1236–1238 (1998). [DOI] [PMC free article] [PubMed] [Google Scholar]


