Abstract
Purpose: The authors have developed a quantitative calibration method for a multileaf collimator (MLC) which measures individual leaf positions relative to the MLC backup jaw on an Elekta Synergy linear accelerator.
Methods: The method utilizes a commercially available two-axis detector array (Profiler 2; Sun Nuclear Corporation, Melbourne, FL). To calibrate the MLC bank, its backup jaw is positioned at the central axis and the opposing jaw is retracted to create a half-beam configuration. The position of the backup jaws field edge is then measured with the array to obtain what is termed the radiation defined reference line. The positions of the individual leaf ends relative to this reference line are then inferred by the detector response in the leaf end penumbra. Iteratively adjusting and remeasuring the leaf end positions to within specifications completes the calibration. Using the backup jaw as a reference for the leaf end positions is based on three assumptions: (1) The leading edge of an MLC leaf bank is parallel to its backup jaw’s leading edge, (2) the backup jaw position is reproducible, and (3) the measured radiation field edge created by each leaf end is representative of that leaf’s position. Data from an electronic portal imaging device (EPID) were used in a similar analysis to check the results obtained with the array.
Results: The relative leaf end positions measured with the array differed from those measured with the EPID by an average of 0.11 ±0.09 mm per leaf. The maximum leaf positional change measured with the Profiler 2 over a 3 month period was 0.51 mm. A leaf positional accuracy of ±0.4 mm is easily attainable through the iterative calibration process. The method requires an average of 40 min to measure both leaf banks.
Conclusions: This work demonstrates that the Profiler 2 is an effective tool for efficient and quantitative MLC quality assurance and calibration.
Keywords: MLC, calibration, quality assurance, MLC uncertainty
INTRODUCTION
Intensity modulated radiation therapy (IMRT) is a treatment modality that is used to deliver a dose prescription to a tumor site while minimizing the exposure to the surrounding healthy tissues. A popular method of implementing IMRT is to superpose a series of irregular fields that are shaped with a multileaf collimator (MLC) to create a complex radiation fluence map. The principles of radiation transport then govern the conversion of the fluence map to a dose map.
The correct placement of high-gradient dose regions in and near the target volume is dependent on an accurate positioning of the MLC leaves during the delivery of the IMRT fields. In a recent study, Mu et al.1 demonstrated that a systematic leaf positioning error of 1 mm in IMRT plans can result in dose errors of up to 7.6% and 12.2% for the target and critical structures, respectively. Errors of this size can have a biologically significant effect on the outcome of the therapy.2 For this reason, the MLC must be accurately calibrated and periodically tested.
MLC calibration requires the ability to precisely measure individual leaf positions. Traditional methods of calibration are time consuming and∕or nonreproducible in nature. These methods include the use of graph paper,3 radiosensitive film,3, 4 scanning water tanks, electronic portal imaging devices (EPID)s,5, 6, 7 detector arrays,8 and manufacturer’s proprietary methods. While each of these techniques has advantages and disadvantages, the current trend is toward more efficient and reproducible methods.
Recent publications have shown a refinement in measurement and calibration techniques. In 2006, Parent et al.5 used an EPID to measure and predict the positions of individual leaves on an Elekta MLC. In 2007, Lopes et al.8 used an ion chamber array mounted on a water tank to calibrate the individual leaf positions for a Siemens MLC. While both of these techniques are an improvement on the traditional methods, they still require a significant investment of time. Using an EPID to measure leaf positions requires mechanical and∕or software corrections as well as user-written code. The ion chamber array-based approach is susceptible to the volume averaging of the ion chambers and requires the setup of a scanning water tank along with ancillary equipment.
An integrated technique for MLC calibration exists as a proprietary method for Elekta MLC’s. The AUTOCAL (Elekta Oncology Systems, Crawley, UK) software suite uses EPID measurements to calibrate various machine items. This software has only recently become available and is used exclusively with the Elekta EPID. While it represents an important step toward more efficient and quantitative calibration techniques, our initial uses have shown that it is prone to delays and calibrations with unacceptable leaf positions. The purpose of our research was to develop a more efficient and reproducible method for calibrating an MLC.
MATERIALS AND METHODS
Materials
Linear accelerator and MLC
All tests were performed with an Elekta Synergy (Elekta Oncology Systems, Crawley, UK) linear accelerator (LINAC) using the 6 MV photon beam. The LINAC’s MLC is a 40 leaf-pair device that has been described in detail.9, 10 Each leaf projects to a width of 1 cm at the isocentric plane (100 cm from source). Each MLC leaf bank is located above a backup jaw that aids in beam collimation and reduces MLC radiation transmission. An MLC leaf bank and its associated backup jaw have parallel leading edges that travel in the cross-plane direction when the collimator is set to 0° (IEC 1217 Convention).11
Elekta leaf positions are controlled through an optical system that uses field light reflected from a marker on top of each leaf. Reference reflectors are located in the machine head outside the largest obtainable field and are used to define the MLC coordinate system. The reflected light rays trace through a series of mirrors to a charge coupled device (CCD) camera that is interfaced to a control computer.
Detector arrays
The Profiler 2 is a two-axis detector array (Sun Nuclear Corporation, Melbourne, FL) that consists of 139 diode detectors. The y axis of the device contains 83 detectors over a length of 32.8 cm and the x axis contains 57 detectors over a length of 22.4 cm. Both axes have a detector spacing of 4 mm and share a central detector. The inherent buildup of the device is 1 g∕cm2 of water-equivalent material. The device was chosen due to the detector spacing and the spatial measurement resolution of each detector (0.8×0.8 mm2). Data collected using the Profiler 2 software can be transferred (using copy and paste) to a spreadsheet program such as EXCEL (Microsoft, Redmond, Washington) for analysis.
The EPID used in this study is an Elekta iView GT. It has a pixel dimension of 0.4×0.4 mm2 and a sensitive area of 41×41 cm2. It operates at a fixed source to surface distance (SSD) of 160 cm. The iView software automatically projects collected images to the isocentric plane by scaling the pixel and field dimensions to 0.25×0.25 mm2 and 25.6×25.6 cm2, respectively. Since an MLC leaf bank projects to a maximum length of 40 cm at the isocenter, it is necessary to shift the EPID in order to fully image one MLC bank.
The method described herein is specific to the Elekta MLC. However, the principle is general and can be applied to other manufacturer’s MLCs provided that appropriate conditions for measurements are met.
Methods
We have termed this measurement technique the radiation defined reference line (RDRL) method. Application of the method operates under three assumptions. First, the leading edge of an MLC leaf bank is parallel to its backup jaw’s leading edge. Second, the backup jaw can provide a reproducible and uniform radiation field edge. This field edge defines the RDRL. Third, the measured radiation field edge created by each leaf end is representative of that leaf’s position.
The third assumption of the RDRL method requires detectors with a spatial measurement resolution that does not suffer from signal averaging in the high spatial frequency of the penumbra. Dempsey et al.12 showed that measurements with a detector size of 2 mm or smaller is sufficient for IMRT fields shaped with MLCs. The Profiler 2’s detector size satisfies this requirement, but the detector location must also be known with a precision better than the desired leaf position accuracy.
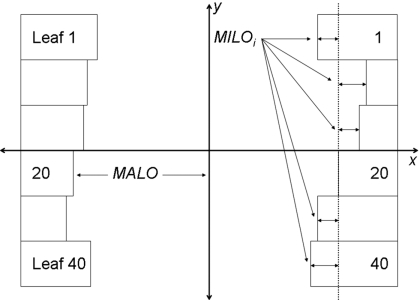
Elekta MLC leaf banks have traditionally been calibrated using standard measurement tools, e.g., film and scanning water tanks, to determine what are termed major and minor leaf offsets, as illustrated in Fig. 1. A reference leaf pair, leaf pair 20, is used in the control of the MLC. The major leaf offset (MALO) is a calibration value that defines the field size created by the reference leaf pair. Minor leaf offsets (MILOs) are the position alignment errors of the other leaves in relation to the reference leaf and are the first focus of this method.
Figure 1.
Minor leaf offsets are defined as the spatial offset of each leaf in a leaf bank relative to the reference leaf, leaf 20. Major leaf offsets are defined as the distance of the reference leaf to the radiation center of the beam.
Measuring minor leaf offsets
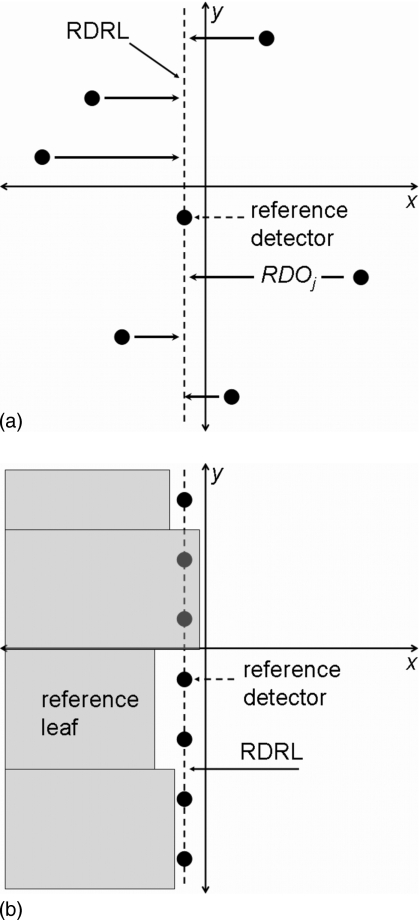
The method described below uses the jaw edge to precisely locate all of the y-axis detector’s offsets relative to the reference detector, as illustrated in Fig. 2a; the reference detector is located in the reference leaf’s direction of travel. These relative detector positions are termed RDOj, where j is the y-axis diode number 1≤j≤83; they effectively create a uniform RDRL. Once these detector positions are known, the detector array is used to measure the position of each leaf that results in a field edge at detector j, as seen in Fig. 2b.
Figure 2.
(a) The RDRL method requires precisely known detector positions; small positional errors in the array’s detectors can disrupt this method by introducing false offsets into the leaf positions. The detector offsets are corrected for, which effectively creates uniform detector positions. (b) Two detectors are located in the projection of each leaf and measure the position of the leaf end.
Profiler 2
The procedure that follows describes measuring the minor leaf offsets for the X1 leaf bank; the procedure is repeated for the X2 leaf bank but with appropriate collimator configurations. Three main steps were required to measure the minor leaf offsets with the Profiler 2 and the RDRL method: device setup, detector offset correction, and MLC measurement.
Step 1. Device setup: The collimator is rotated to 180° and the Profiler 2 is set on the treatment table at a source to surface distance, SSD, of 79 cm and a corresponding source to detector distance (SDD) of 80 cm. The Profiler 2’s x and y axes are then aligned with the collimator crosshair shadow such that the positive y axis of the Profiler 2 points toward the gantry.
This orientation places the y-axis column of 83 detectors perpendicular to the direction of the leaf movement. The orientation also directionally matches the ascending numerical order of the detectors (1–83) with that of the leaves (1–40). This directional match makes the on-screen evaluation easier during data collection with the Profiler 2 software. The same effect could have been achieved by rotating the Profiler 2 instead of the collimator.
Next, the Profiler 2 is shifted by 2 mm in the direction of its negative y axis. This centers the crosshairs between the central y-axis detector and its immediate upper neighbor. Since the projected leaf width at 80 cm from the source is 8 mm, this shift locates two detectors in the projection of each leaf, as seen in Fig. 2b, and positions the x axis of the Profiler 2 in the projection of the reference leaf.
Small rotational errors between the crosshair and the field edge of the backup jaw are tested by moving one of the MLC’s backup jaws to 3 mm before the central axis. A small consistent gap between the detector markers and the backup-jaw-field-edge indicates a proper alignment, while a divergence between the two is corrected by rotating the Profiler 2.
Since a visual alignment of the array was inadequate for a precise MLC calibration, an alignment to the LINAC’s radiation coordinate system is also performed. This is accomplished by measuring an alignment profile with the column of y-axis detectors. Before measuring the alignment profile, a y-axis profile is measured with both jaws opened. This open field profile is used to reference the slope of the alignment profile. The jaw and leaf bank settings that were used for the open field are shown in Table 1. The alignment profile measurement is taken with the leaves retracted and with the backup jaw positioned at the central axis (CAX) so that the measured profile lies within the jaw’s penumbra. The jaw and leaf bank settings that were used to measure the alignment profile for the X1 backup jaw are also shown in Table 1.
Table 1.
List of collimator settings for Profiler 2 measurements of the X1 MLC leaf bank at CAX for minor leaf offsets in Sec. 2B1a. Settings are based on the IEC 1217 Convention.
| Field name | Collimator | |||||
|---|---|---|---|---|---|---|
| MLC X1 (mm) | MLC X2 (mm) | Backup jaw X1 (mm) | Backup jaw X2 (mm) | Jaw Y1 (mm) | Jaw Y2 (mm) | |
| OF | 100 | −100 | 100 | −100 | 200 | 200 |
| Alignment | 150 | −150 | 0 | −100 | 200 | 200 |
| RL 30% | 150 | −150 | −1 | −100 | 200 | 200 |
| RL 50% | 150 | −150 | 0 | −100 | 200 | 200 |
| RL 70% | 150 | −150 | 1 | −100 | 200 | 200 |
| MLC 30% | −1 | −150 | 100 | −100 | 200 | 200 |
| MLC 50% | 0 | −150 | 100 | −100 | 200 | 200 |
| MLC 70% | 1 | −150 | 100 | −100 | 200 | 200 |
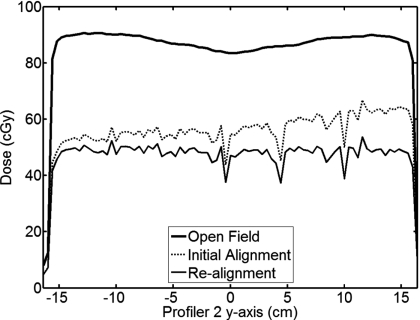
A tilt in the initial alignment profile indicates that the Profiler 2 was not aligned with the backup jaw, as seen in Fig. 3. For this case, a slight manual rotation of the Profiler 2 is made and the measurement is repeated, which minimizes the misalignment. Corrective rotations and remeasurement of the alignment profile can be performed until the profile tilt is minimized.
Figure 3.
The measurements required to radiographically align the array. The thick solid line shows an open field measurement used for comparing the alignment profiles, the dashed line shows the initial setup of the array, and the thin solid line shows a correct radiographic alignment with the backup jaw after repositioning the array.
Step 2. Determining detector offset corrections: Although the Profiler 2’s diode detectors are precisely attached to the circuit board, small inherent errors in their fixed positions cause spikes and dips in the measured profiles when the measurements are taken in a region of high dose gradient. This is apparent in the alignment profiles of Fig. 3. A correction for these detector positions is necessary before accurate measurements of the leaf edge positions can be performed. Detector position corrections are determined as follows.
Immediately following the Profiler 2 setup, three y-axis profiles are measured with the X1 backup jaws positioned at −1, 0, and +1 mm relative to the CAX. To avoid mechanical hysteresis, the backup jaw is retracted in the same direction before each measurement. The MLC and backup jaw positions that are used to measure these three profiles are shown in Table 1, where reference line (RL) 30%, RL 50%, and RL 70% correspond to the measurements taken with the X1 backup jaw positioned at −1, 0, and +1 mm of the CAX, respectively. The three profiles lie in the high dose gradient region at approximately 30%, 50%, and 70% of the values measured at the center of the open field (OF) profile of Table 1. These three measurement positions were chosen because the penumbra within this region is linear.
The data from these measurements are transferred from the Profiler 2 software to an EXCEL worksheet for analysis. The data obtained with each detector is then normalized to the OF measurement using
| (1) |
where NRLn,j is the normalized reference line measurement for backup jaw positions n (−1, 0, and +1 mm) and y-axis detectors j (1≤j≤83), MRLn,j is the reference line measurement for a single detector j, and OFj is the open field value for corresponding detector j. Linear regression on the three data pairs for each detector j (NRL−1,j, NRL0,j, and NRL+1,j) produces slopes mj and intercepts bj for each detector. A linear interpolation is then used to obtain the 50% dose position DPj for each detector using
| (2) |
This value is a linear measure of the jaw position that results in a field edge at each detector.
The detector offset correction for each detector relative to a reference detector, ref, is termed the relative detector offset, RDOj, and is calculated using
| (3) |
The calculation of the RDO values sets a common origin for each detector that allows for a spatially unbiased measurement of MLC positions. Note that although two detectors are in the projection of the reference leaf, either one can be used as the reference detector.
Step 3. Determining relative leaf positions: To measure the leaf positions for an MLC leaf bank, the procedure followed in the previous step is repeated using the MLC leaf bank instead of the backup jaw. The collimator configurations used for the fields MLC 30%, MLC 50%, and MLC 70% are shown in Table 1, which correspond to measurements taken with the X1 leaf bank positioned at −1, 0, and +1 mm of the CAX, respectively. The resulting profiles in the high dose gradient region are again approximately 30%, 50%, and 70% of the value measured at the center OF profile. Since the array is aligned with the backup jaw in step 1, a tilt in these profiles indicates that the MLC bank may be in need of calibration. It is possible to calculate the degree of tilt in the reference line measurement and subsequently correct further measurements; however, this increases the complexity of the algorithm and is not used.
The detector data are copied from the Profiler 2 software to the EXCEL spreadsheet and is normalized to an open field measurement using
| (4) |
where NMLCn,j is the normalized MLC measurements for MLC leaf bank positions n and y-axis detector j; MMLCn,j is the leaf bank measurement for a single detector.
As in the DPj calculations, the 50% dose position for each leaf and detector combination, MLCPj, is linearly interpolated using
| (5) |
where the y intercept bj and slope mj for each detector is determined by using linear regression on the three data pairs for each detector j. This value is a linear measure of the leaf position that would result in a field edge at the corresponding detector.
Next, the leaf offset correction for each leaf and detector combination relative to the reference leaf, ref, and reference detector is termed the relative leaf offset, RLOi,j, and is calculated using
| (6) |
The relative detector offsets are then removed from the relative leaf offsets to provide MILOs using
| (7) |
The MILOi,j values are averaged for the two detectors lying in the projection of each leaf to provide MILOi. The MILOi values are then linearly scaled to the isocentric plane at a 100 cm distance from the source.
EPID
The Profiler 2 MILO results were checked using an EPID based version of the RDRL method. With this approach, the EPID was used to image the fields RL 50% and MLC 50%, shown in Table 1. The data density of the EPID made it unnecessary to image the 30 and 70% RL and MLC fields.
Since the active field size and fixed SDD of the EPID limited its field of view to only 25 leaves, it was necessary to shift the EPID panel to fully measure a leaf bank. The EPID was first positioned so that the projected edge of the backup jaw for the RL 50% field falls at the center of the EPID in the in-plane direction. It was then shifted in the in-plane direction to a position that allows the RL 50% and MLC 50% fields to be imaged for leaves 1–25. After these images were taken, the EPID was shifted in the in-plane to a position that allowed for the RL 50% and MLC 50% fields to be imaged for leaves 16–40.
The RL 50% and MLC 50% fields were exported from the EPID, in tiff format, into the MATLAB environment (MathWorks, Natick, MA) for analysis. An in-house edge detection algorithm was then used to locate the field edges for the reference line DPv and each leaf MLCPi,v, where i is the leaf number and v is the pixel number. Once these are known, the pixel distance of each leaf end’s position to the reference line was calculated and converted to a spatial distance SDi,v using
| (8) |
where 0.25 mm∕pixel was the inherent pixel gain. The reference leaf’s spatial distance was then subtracted from the spatial distance for each of the other leaves to determine the minor leaf offsets using
| (9) |
The MILO values from the two EPID positions were accepted based on the difference in leaf positions for leaves 16–25 and the published leaf reproducibility. These leaves were chosen since they fall within the RL 50% and MLC 50% images taken for both of the EPID positions described above. The EPID was not used to measure major leaf offsets; its purpose was to check the results obtained with the Profiler 2.
Measuring major leaf offsets
The method described below determines the position of the reference leaf pair, and therefore the leaf bank, relative to previously measured baseline positions at three MLC locations—retracted, CAX, and extended. The setup geometry for the array is the same as was used during the minor leaf offset measurements; the field configurations are similar. Note that the projection of the center of the reference leaf for the measured leaf bank, X1 or X2, lies along the x axis of the array. The determination of the major leaf offsets with the array involves three steps in addition to those required for determining the minor leaf offsets, they are off-axis MLC measurement, array offset correction, and baseline comparison.
Step 1. Off axis MLC measurement: The procedure for measuring the MLC at off-axis positions is similar to step 3 of Sec. 2B1a. For the minor leaf offsets, the MLC is measured at the CAX; therefore, no additional measurements are required at this position. For the major leaf offsets, retracted and extended reference leaf positions are measured at ±7.5 cm on the x axis. These positions were chosen because they correspond to the largest IMRT fields our clinic regularly uses (∼20 cm). Since the SDD of the array is 80 cm, these positions corresponded to the ±6 cm x-axis detectors on the array.
The retracted and extended reference leaf positions are measured with three MLC geometries, three fields per geometry. The retracted reference leaf positions are measured with symmetric MLC fields. The collimator configurations used for the symmetric fields SYM 30%, SYM 50%, and SYM 70% are shown in Table 2, these correspond to measurements taken with the reference leaf pair incrementally being retracted over the −6 and +6 cm detectors. The resulting measurements in the high dose gradient region are approximately 30%, 50%, and 70% of the value measured with the OF field at the same detector.
Table 2.
List of additional collimator settings for Profiler 2 measurements of the major leaf offsets in Sec. 2B2. The fields listed are for measurement of the X1 reference leaf at retracted, SYM fields, and extended, X1 fields; the CAX fields were measured during the minor leaf offsets in Sec. 2B1a. Settings are based on the IEC 1217 Convention.
| Field name | Collimator | |||||
|---|---|---|---|---|---|---|
| MLC X1 (mm) | MLC X2 (mm) | Backup jaw X1 (mm) | Backup jaw X2 (mm) | Jaw Y1 (mm) | Jaw Y2 (mm) | |
| SYM 30% | 74 | −74 | 100 | −100 | 200 | 200 |
| SYM 50% | 75 | −75 | 100 | −100 | 200 | 200 |
| SYM 70% | 76 | −76 | 100 | −100 | 200 | 200 |
| X1 30% | −76 | −150 | 100 | −100 | 200 | 200 |
| X1 50% | −75 | −150 | 100 | −100 | 200 | 200 |
| X1 70% | −74 | −150 | 100 | −100 | 200 | 200 |
The extended leaf positions are measured, in turn, by extending the X1 or X2 leaf bank over the center of the array to an off-axis position of −7.5 or +7.5 cm, respectively. The collimator configurations used to measure the extended X1 MLC fields X1 30%, X1 50%, and X1 70% are show in Table 2, these correspond to measurements taken with the X1 leaf bank, respectively, positioned at −7.6, −7.5, and −7.4 cm. Once again, the resulting measurements in the high dose gradient region are approximately 30%, 50%, and 70% of the value measured with the OF field at the same detector. Collimator configurations for the extended X2 MLC fields follow the same pattern but for the +7.5 cm position.
The measured data are then copied from the Profiler 2 software and pasted into the EXCEL worksheet. The worksheet contains the same linear-interpolation method, as previously described in step 3 of Sec. 2B1a, for determining the MLC position that results in a 50% open field value for the specific detector. These positions are labeled MLCk,m, where k represents the −6, 0, or +6 cm x-axis detector position and m is the X1 or X2 reference leaf. Depending on the setup precision of the array relative to the CAX, all of the normalized values from the three measurements may have been either above or below the 50% open field value, if this was the case then shifted collimator configurations were necessary.
Step 2. Array offset correction: The offset of the array relative to the radiation CAX is determined using
| (10) |
where DP42,X1 and DP42,X2 are the respective locations of the backup jaws X1 and X2 as determined by the detector array, which has an offset AO, the calculated midpoint between jaws.
Each time the array was set up to measure the MLC, its position relative to the CAX is slightly different from the previous measurement setup. This uncertainty does not affect the MILO values since they are relative values. However, the setup uncertainty does affect the major leaf offsets and is removed from the reference leaf positions using
| (11) |
where MALOk,m are the major leaf offset values for the X1 and X2 reference leafs.
Step 3. Baseline comparison: Before the baseline measurements are made, proper calibration of the MLC should be verified. Therefore, the ideal time to establish baseline values is during the LINAC acceptance-testing∕commissioning phase and∕or following the annual LINAC QA. The initial set of major leaf offset measurements establishes baseline values; subsequent measurements provide a comparison to the baseline values using
| (12) |
where BOk is the baseline offset for x-axis detector position k and reference leaf m and baselinek,m is the initial set of MALO value. Major leaf offsets that differ from the baseline by more than a preset tolerance are then in need of calibration.
MLC calibration
Elekta MLCs have a leaf offset gain of 14 units∕mm (0.071 mm∕unit). Multiplying this gain by the minor leaf offsets and∕or baseline offsets gives the adjustment values to bring each quantity into tolerance. These values are then entered into the Elekta LINAC software to complete the calibration for the minor and major leaf offsets. The calibration process is repeated if the leaf positions are not within our target tolerance of ±0.3 mm (±4 units), the published Elekta MLC reproducibility.9
Other MLC types
Multileaf collimators with leaves of mixed width require a variation in the described method. For example, an MLC that has leaf widths of 5 and 10 mm requires the same setup as described for the Elekta MLC used in this work. However, instead of two detectors being in the projection of each leaf, there are either two (for the 10 mm leaves) or one (for the 5 mm leaves). The “backup” jaw and MLC movements need to be altered due to sharper penumbras produced by the jaw and MLC. Multileaf collimators with leaf widths other than 5 or 10 mm require a different SDD for the Profiler 2. For example, an MLC with a 4 mm leaf width at the isocenter would require a 100 cm SDD and a 2 mm shift. This would locate one detector in the projection of each leaf.
RESULTS
Detector offsets
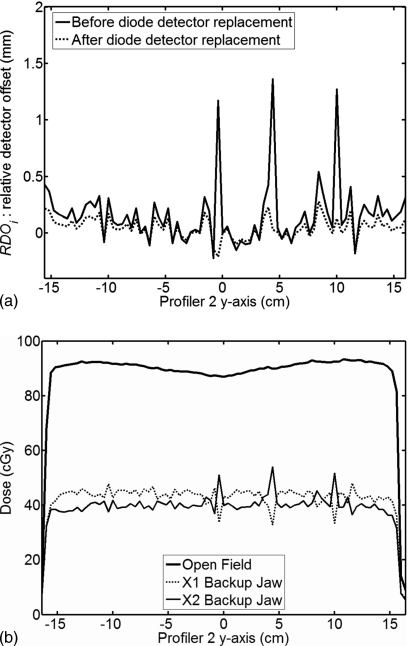
The linear dose gradient measured across the field edge (defined as 50% of the open field value) for each backup jaw was 15.2% per mm. The RDO values measured using the X1 backup jaw are shown in Fig. 4a as a solid black line. This quantity was measured ten consecutive times to determine the short-term reproducibility. The maximum difference between the measured values was 0.10 mm with an average standard deviation of 0.01 mm. This level of reproducibility indicates that the Profiler 2 is stable for measurements over a short period of time.
Figure 4.
(a) Detector offsets relative to a reference detector. The reference detector is chosen based on which detector lies in the projection of the reference leaf. Detectors at −0.4, 4.4, and 10 cm displayed a larger than average offset value as shown by the solid line. After detector replacement, the dashed line shows the nominal offsets. (b) Measurements with each backup jaw located at the CAX position. The mirrored behavior of the three large spikes on the profiles indicates that they are due to positional errors.
There were three outliers in the RDO results in Fig. 4a, at −0.4, 4.4, and 10 cm on the y axis, whose positions were approximately 1 mm off the nominal axis. We speculated that the cause was a detector placement error in the off-axis direction. While placement errors of this magnitude are not a factor in the intended use of the product, i.e., profile measurements, they do play a factor in measuring leaf positions. Figure 4b shows measurements of the X1 backup jaw, the X2 backup jaw, and the OF field. The mirrored behavior of the spikes at these three positions verified the placement error speculation. The detectors at these three locations were replaced by the manufacturer, which brought the RDO values closer to the population average. The RDO values determined for the new detectors are shown in Fig. 4a as the dashed line. In practice, the detector placement error is compensated by the correction techniques described herein; ongoing replacement of outliers is not necessary.
MLC measurement comparison and reproducibility
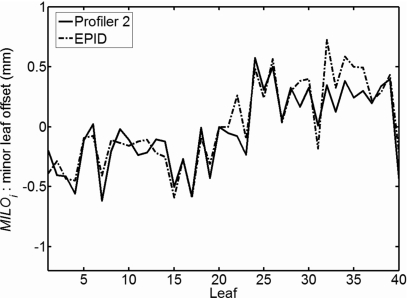
The average dose gradient across the MLC leaf ends, defined as 50% of the open field value, was 13.5%∕mm. Figure 5 displays the MILO values measured with both the array and EPID. The MILO results for the devices matched each other well, with a mean difference of 0.11±0.09 mm.
Figure 5.
MLC leaf offsets relative to leaf number 20, the reference leaf.
We conducted both short- and long-term reproducibility measurements using the RDRL method. For the short-term measurements, ten consecutive MILO and MALO measurements were made with the array over a two hour period. The maximum observed difference between individual values was 0.22 mm with a mean standard deviation of 0.07 mm. The long-term reproducibility was studied by obtaining five sets of MILO and MALO measurements over a period of 12 weeks. The maximum difference found was 0.51 mm with a mean standard deviation of 0.09 mm; this is in reasonable comparison to Elekta’s stated reproducibility of ∼0.3 mm. Both the short- and long-term reproducibilities were comparable to previously published values.9 Reproducibility was not evaluated using the EPID. However, the MILO results for leaves 16–25 of the EPID images (the leaves common to both sets of images for one leaf bank) provide some quantification of its short-term reproducibility. The largest difference observed between MILO values for these leaves was 0.12 mm.
MLC service issues
Mechanical alterations may affect the optically based MLC control system, which in turn could invalidate the MLC calibration. Two examples are illustrated.
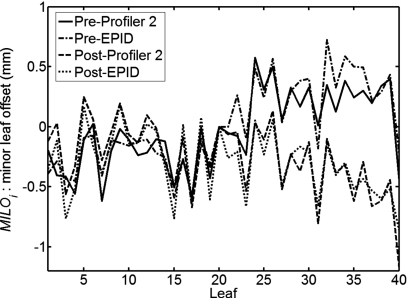
Example 1. Replacement of the primary Mylar mirror: EPID and array MILO values were determined using the RDRL technique prior to replacement of the primary Mylar mirror. Measurements were repeated using the same method after replacement of the mirror. The postreplacement measurements indicated that the values had changed by as much as 1 mm in the upper half of the leaf bank, as shown in Fig. 6.
Figure 6.
Change in the relative MLC offsets after replacement of the primary Mylar mirror.
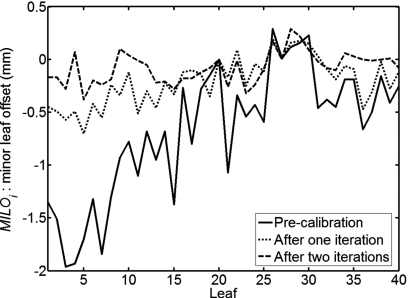
Example 2. CCD camera replacement: During LINAC maintenance, the CCD camera that is used to control the MLC leaf positioning was replaced. After the procedure, radiographic film was used to check the MLC leaf positions. No problems were found with a simple visual check of the film. Afterward, however, unacceptable passing rates were obtained during routine patient-specific IMRT QA measurements. An MLC calibration was therefore performed using the RDRL method with the array. Before calibration the initial leaf spread of the X1 leaf bank was nearly 2 mm, as shown in Fig. 7. The leaves were then calibrated, using the “MLC calibration” method described above, to within the manufacturer’s specified tolerance. A second calibration iteration was then performed to further tighten the spread.
Figure 7.
Calibration of the X1 MLC leaf bank. Measurements show the relative MLC positions before calibration and after two iterations of the RDRL method with the profiler.
DISCUSSION
MLC calibration stability and QA
Our long-term reproducibility results indicated that the Elekta MLC was stable over a period of 3 months. For an IMRT program that includes patient-specific QA, monthly MLC checks should be sufficient to ensure the quality of patient treatment. However, if patient-specific IMRT QA is not performed, we feel that MLC QA should be done weekly.
Our experience after the replacement of both the primary Mylar mirror and the CCD camera indicates that Elekta leaf positions must be checked after any type of maintenance that could affect the optical control system of the MLC.
Device comparisons
The Profiler 2 and EPID each have unique advantages and disadvantages when used with the RDRL method.
The primary advantage of the Profiler 2 approach is time efficiency. Measuring the minor leaf offsets for both leaf banks takes an average of 30 min with an additional 10 min required for the major leaf offsets. Entering the leaf adjustments into the Elekta software and remeasuring the calibrated positions takes an additional 30 min. However, the time requirement could be dramatically decreased if the entire procedure were incorporated into the Profiler 2 software using a series of automatically delivered step-and-shoot fields. This has been requested of the manufacturer.
The Profiler 2 is a very stable measurement platform, as indicated by the detector offset reproducibility. Therefore, deviations in the measured leaf positions are the result of leaf positions rather than device instability. Other benefits of the array include the ease of data analysis with compatible-user-friendly formats such as EXCEL. The array can also be used to measure an entire MLC bank without repositioning whereas the EPID requires a shift in position to perform the same function. It is also flexible in the sense that it can be used to calibrate any MLC on the market by simply setting it up at the correct SDD and correct in-plane axis position.
A disadvantage of the Profiler 2 is the need to measure fields at 1 mm increments for the determination of the relative detector offsets and MLC leaf positions, which increases the required measurement time. A second disadvantage is the inability to measure an entire leaf bank at off-axis positions; this could be overcome by moving the array off axis. The manufacturer is incorporating a motorized table that is capable of shifting the array up to (±) 20 cm off axis. This will allow leaf bank measurements over the entire field.
The EPID based approach is also a viable means of calibrating an MLC with the RDRL method. Two major advantages of the EPID are its integration with the LINAC and its larger cross-plane field of view. The larger cross-plane field of view means that only one field is required for the reference line and the MLC measurements.
Disadvantages exist for the EPID. A scarcity of commercial software necessitates user-based code and associated software for data analysis, which makes it inefficient with regard to time and resources. For rigorous EPID measurements, many time consuming corrections are required to account for the rotation, tilt, and sag of the amorphous silicon panel.5
Considering the advantages and disadvantages, the efficiency with which routine MLC QA and calibration can be performed is comparable for the two devices. The major advantage of the Profiler 2 lies in its compatibility with EXCEL for data analysis, whereas the EPID requires user-based code that is generally beyond EXCEL import capabilities.
CONCLUSION
The purpose of this study was to develop an efficient and quantitative method for calibrating an Elekta MLC. The RDRL method measures leaf end positions relative to a radiation reference line defined by the MLC backup jaw. The Profiler 2 detector array was used to implement the method and the results were verified with an EPID. The results obtained with the two devices agree well with each other and reproducibility values agree with previously published values. The Elekta leaf positioning accuracy was found to be vulnerable to alterations of the MLC optical control environment. Therefore, MLC QA should be performed after any component of the MLC optical control system is disturbed. The RDRL calibration procedure with the Profiler 2 is efficient for a number of reasons. Primary among these reasons is the ease of data handling using widely available software such as EXCEL. Our method can be easily utilized by any facility with access to a Profiler 2.
ACKNOWLEDGMENT
The authors would like to thank Phil Basset for many useful discussions and assistance in implementing the procedure.
References
- Mu G., Ludlum E., and Xia P., “Impact of MLC leaf position errors on simple and complex IMRT plans for head and neck cancer,” Phys. Med. Biol. 53, 77–88 (2008). 10.1088/0031-9155/53/1/005 [DOI] [PubMed] [Google Scholar]
- ICRU, Report No. 24, 1976.
- Boyer A., Biggs P., Galvin J. M., Klein E., LoSasso T., Low D., Mah K., and Yu C., Report No. 72, 2001.
- Pasquino M., Borca V. C., Catuzzo P., Ozzello F., and Tofani S., “Transmission, penumbra and leaf positional accuracy in commissioning and quality assurance program of a multileaf collimator for step-and-shoot IMRT treatments,” Tumori 92, 511–516 (2006). [DOI] [PubMed] [Google Scholar]
- Parent L., Seco J., Evans P. M., Dance D. R., and Fielding A., “Evaluation of two methods of predicting MLC leaf positions using EPID measurements,” Med. Phys. 33, 3174–3182 (2006). 10.1118/1.2335490 [DOI] [PubMed] [Google Scholar]
- Mamalui-Hunter M., Li H., and Low D. A., “MLC quality assurance using EPID: A fitting technique with subpixel precision,” Med. Phys. 35, 2347–2355 (2008). 10.1118/1.2919560 [DOI] [PubMed] [Google Scholar]
- Mohammadi M. and Bezak E., “Evaluation of MLC leaf positioning using a scanning liquid ionization chamber EPID,” Phys. Med. Biol. 52, N21–N33 (2007). 10.1088/0031-9155/52/1/N03 [DOI] [PubMed] [Google Scholar]
- Lopes M. C., Chaves A., and Capela M., “A dosimetric calibration method for a double-focused multileaf collimator,” Med. Phys. 34, 3473–3474 (2007). 10.1118/1.2766757 [DOI] [PubMed] [Google Scholar]
- Jordan T. J. and Williams P. C., “The design and performance characteristics of a multileaf collimator,” Phys. Med. Biol. 39, 231–251 (1994). 10.1088/0031-9155/39/2/002 [DOI] [PubMed] [Google Scholar]
- Palta J. R., Yeung D. K., and Frouhar V., “Dosimetric considerations for a multileaf collimator system,” Med. Phys. 23, 1219–1224 (1996). 10.1118/1.597678 [DOI] [PubMed] [Google Scholar]
- International Exchange Commission, Report No. IEC 1217, 1996.
- Dempsey J. F., Romeijn H. E., Li J. G., Low D. A., and Palta J. R., “A Fourier analysis of the dose grid resolution required for accurate IMRT fluence map optimization,” Med. Phys. 32, 380–388 (2005). 10.1118/1.1843354 [DOI] [PubMed] [Google Scholar]


