Abstract
In this article, a new method is introduced for estimating the motion of the heart due to respiration in gated cardiac SPECT using a rigid-body model with rotation parametrized by a unit quaternion. The method is based on minimizing the sum of squared errors between the reference and the deformed frames resulting from the usual optical flow constraint by using an optimized conjugate gradient routine. This method does not require any user-defined parameters or penalty terms, which simplifies its use in a clinical setting. Using a mathematical phantom, the method was quantitatively compared to the principal axis method, as well as an iterative method in which the rotation matrix was represented by Euler angles. The quaternion-based method was shown to be substantially more accurate and robust across a wide range of extramyocardial activity levels than the principal axis method. Compared with the Euler angle representation, the quaternion-based method resulted in similar accuracy but a significant reduction in computation times. Finally, the quaternion-based method was investigated using a respiratory-gated cardiac SPECT acquisition of a human subject. The motion-corrected image has increased sharpness and myocardial uniformity compared to the uncorrected image.
Keywords: quaternion, respiratory motion, motion correction, cardiac SPECT
INTRODUCTION
In cardiac imaging modalities requiring scan times longer than a single breath hold (e.g., PET, SPECT, MR), the motion of the heart due to respiration introduces blur into the tomographic images.1, 2, 3, 4, 5 By sensing the phase of the respiratory cycle, a gating procedure may be used to produce a time series of images with reduced motion blur. When combined with electrocardiographic (ECG) gating of the cardiac contraction cycle, the acquisition is referred to as a dual-gated study6, 7 and produces a matrix of projection sets. A drawback to respiratory gating, similar to ECG gating, is higher noise levels in the gated images.8, 9 To combat the increased noise levels of respiratory-gated images in emission tomography, motion correction using an estimate of the heart motion between the image frames combined with temporal summing has been proposed.7, 10, 11, 12, 13, 14, 15, 16, 17, 18, 19
Gating of the respiratory cycle may be accomplished by affixing a piezoelectric elasticized belt around the patient’s chest. As the patient breathes, a signal is generated corresponding to the tension in the belt. The signal may be input to the imaging device as a representation of the respiratory cycle, similar to ECG gating of the cardiac contraction cycle. Image data may be binned in terms of respiratory amplitude or phase, where amplitude binning has less in-frame motion blur than phase binning, but phase binning has better noise level uniformity across bins.20
Given the gated image frames, many techniques currently exist for estimating respiration-induced heart motion. Physical devices have been used that track the motion of markers placed on the patient’s chest throughout the acquisition.10, 11, 12 These devices offer high precision; however, the motion of deeply embedded structures within the body may be different than that of the surface of the body. Furthermore, implementation of physical tracking methods requires hardware integration and calibration for each scanner in a facility, which may be expensive and require regular quality assurance.
Motion estimation methods based on image data analysis alone are easier to implement and have the advantage of estimating the motion of the organ directly. Rigid-body,13, 14, 15, 16 affine,17, 18 and deformable models3, 7 of the respiratory heart motion have all been shown to successfully decrease respiration-induced artifacts in cardiac imaging. In SPECT, the rigid-body model of the heart21 has been used widely due to spatial resolution constraints, which place an upper bound on the extent of the improvement possible using motion estimation and temporal summing. A drawback of image data analysis methods is that their accuracy is highly influenced by image noise, reconstruction artifacts, and available computational resources.
Within the data analysis approach, both analytical and iterative methods have been investigated in estimating the respiratory heart motion from tomographic data. Analytical methods13, 14, 15, 16 are generally faster than iterative methods,17, 18, 19 but their accuracy may be highly dependent on the level of noise in the images. Iterative methods, aside from their high computational costs, often require a good initial estimate to reach convergence.22 In Ref. 17 the affine motion for a given frame pair used an initial estimate defined as the motion estimate from the immediately preceding frame pair. A cost function was implemented which penalized deviations from this starting estimate. The method showed convergence but required a user-defined weighting parameter on the cost function, which may complicate the use of the method in a clinical environment. Furthermore, the authors reported an average computation time of 720 s. The method in Ref. 18 used spatiotemporal penalty terms which penalized deviations from the simple-harmonic oscillation equation. The method demonstrated convergence but again required user-defined weighting parameters on the penalty term.
We have previously investigated a method for estimating and correcting the respiratory motion of the heart iteratively without user-defined parameters or penalty terms.19 The method used a rigid-body model with rotation parametrized by Euler angles and iteratively minimized an image-registration function using an optimized conjugate gradient method. The Euler angles correspond to a rotation about the x axis followed by a rotation about the y axis, followed by a second rotation about the x axis. In Ref. 19 the motion was estimated after summing the ECG-gated frames. This summing adds motion blur to the images but increases the SNR. The method was slow due to repeated calculation of the objective function and its derivatives which required extensive trigonometric evaluations. On modern computer architectures, trigonometric functions are approximated using simple iterative equations,23 and thus may be ill suited for use in deeply embedded loops.
To improve the computational efficiency of the method in our previous work19 while maintaining high accuracy and convergence, here we investigate the use of the quaternion parametrization of rotation24 in iteratively estimating the rigid-body respiratory motion of the heart. Quaternions have been used extensively in computer animation and gaming industries due to their simplicity and improved physical characteristics25 compared to Euler representations. For example, gimbal lock, a condition resulting when the second Euler angle is equal to 90° and a degree of freedom is lost, is avoided using the quaternion representation. Furthermore, a quaternion-parametrized rotation matrix is free of trigonometric functions, and we hypothesize that this simplification will reduce the computational burden of repeated calculations of the objective function and its partial derivatives. We compare this method quantitatively in terms of speed, accuracy, and robustness to several other iterative and analytical techniques using simulated data of a mathematical phantom. The quaternion method is further evaluated on a respiratory phase binned human SPECT image in terms of computation time and image quality after correction by the estimated motion. It is shown that the use of the quaternion representation enables a fast, accurate, and robust model for respiratory motion correction in cardiac SPECT.
THEORY
We represent the image space by a discrete space variable r=(x,y,z) and assume a series of tomographic image frames f1,f2,…,fJ. We assume that the frame-to-frame motion of an object can be modeled as a rigid body. We consider the problem then of forming a single composite image by registering and summing all frames to the “reference frame” f1 using an estimate of the rigid-body motion between each frame and the reference frame.
The rigid-body motion between f1 and fj is estimated by minimizing the image-registration objective function:
| (1) |
where b is the 3D translation motion, fj is the image at frame j, r is the discrete 3D spatial coordinate for each voxel center, and Q is the 3D rotation matrix. The sum is taken over all voxels. A total of six parameters (three translational, three rotational) are needed to compute Ej. In contrast to other iterative methods, no user-specified parameters or penalty terms are used. Since the rigid-body motion is a smooth vector field which is completely specified by a few (six) parameters and the images contain orders of magnitude more voxels that are being matched, we do not see the need to include any additional penalty terms in the objective function.
The rotation matrix Q may be parametrized by 12 different sets of three Euler angles, where each angle represents a rotation about a Cartesian axis. In each case, specific rotation matrices have multiple distinct parametrizations. This nonuniqueness is due to the dependence of these representations on trigonometric functions. This motivated us to use the quaternion representation which has a unique representation, and only involves simpler algebraic functions.24
For the reader’s convenience we give a brief outline of quaternion-parametrized rotation. See Ref. 24 for a more complete treatment. A quaternion q may be viewed as the sum of a scalar and a 3D vector as follows:
| (2) |
where , , and are unit vectors in 3-space and θ0, θ1, θ2, and θ3 are scalars. q is a unit quaternion if
| (3) |
The unit quaternion represents the rotation through the angle ω about the axis parallel to the unit vector (with initial point the origin), where the direction of rotation and form a right-handed system (i.e., ω is the direction of rotation of a right-handed screw being tightened with the tip moving in the direction of ). Thus, we impose the condition θ0>0, which guarantees the unique quaternion parametrization for rotation matrices. So, from Eq. 3, we have . Thus, by using this representation, each rotation matrix is determined by the unit quaternion vector which is explicitly stated in Appendix A, Eq. A1. Thus we minimize the objective function in Eq. 1 with respect to the variables θ1, θ2, θ3, b1, b2, and b3, where b=[b1,b2,b3].
This minimization was performed by using the modified conjugate gradient algorithm CG̱DESCENT developed by Hager and Zhang.26, 27 This is a globally convergent nonlinear conjugate gradient method with guaranteed descent and a fast and highly accurate line search technique. As a result, we refer to the proposed method as the conjugate gradient quaternion (CGQ) method. The partial derivatives of Eq. 1 used in the CGQ algorithm are given in Appendix B. The CGQ algorithm was initialized with each component of set to zero and each component of b found by calculating the 3D center of mass (COM) in each frame. In the rare case that θ0 became imaginary, a very large negative number (approaching −∞) was returned for each rotational component of the gradient. The conjugate gradient algorithm (CG̱DESCENT) was stopped when the change in the objective function between successive iterations was less than 0.l%.
EXPERIMENTAL METHODS
The proposed CGQ motion estimation method was compared with two existing methods on three different data sets using both quantitative metrics and visual inspection of corrected images. In this section we discuss details of the implementation of the motion estimation algorithms, how these motion estimates were used to determine a single summed image, the generation of the simulated data and a description of the patient data, and the evaluation metrics for the motion obtained from all three methods applied to the three data sets.
Methods for comparison to CGQ
We compared CGQ with two other methods: (1) The principal axis transformation28, 29 and (2) a method which uses the same CG̱DESCENT algorithm to minimize the objective function in Eq. 1 but represents the rotation matrix by Euler angles19 instead of quaternions. Both of these methods are briefly detailed here.
Principal axes
In the principal axis method the translational motion is first estimated as the difference in the COMs between the reference and deformed frames. The rotational motion is estimated from analytic relationships between the singular value decompositions (SVDs) of the inertia matrices for the reference and translated deformed frames. This method is not based on iterative algorithms for minimizing an objective function as the CGQ and CGPYR methods, so it is much simpler to implement, but there is no compensation for noise in the reconstructed images. The accuracy and speed of this algorithm are very dependent on how the SVDs are computed. In this paper, we used the SVD algorithm of the LAPACK (Refs. 30, 31) software library (driver routine DSYEVD). One disadvantage of the principal axis method is that it cannot distinguish the true rotation ϕ from the conjugate rotation ϕ+180°.28 To avoid this problem, the principal axis code for these studies substituted the conjugate rotation when the estimated rotation was greater than 90°. In practice it can be assumed that the true rotation is less than 90°.
Iterative motion estimation using an Euler angle notation
Instead of using quaternions, methods have been developed based on Euler angle representations of the rotation matrix Q in Eq. 1.17, 18, 19 Here we compare our method with one which uses the “pitch-yaw-roll” system (φ,θ,ψ) corresponding to rotations about the x axis, the y axis, and the z axis, in that order. The rotation matrix and partial derivatives for this system are given in Appendix C. The algorithm was initialized with each rotational component (φ,θ,ψ) set to zero and each component of b found by calculating the 3D center of mass in each frame. The stopping rule was identical to that used in CGQ. We refer to this as the conjugate gradient pitch-yaw-roll (CGPYR) algorithm.
Mathematical phantom evaluation
Image generation
Tests were performed on an ensemble of ten noise realizations of a dual-gated (respiratory and ECG binning) cardiac SPECT scan generated by the 4D NURBS-based cardiac-torso (NCAT) phantom.32 Relative organ activity concentrations were based on rest -sestamibi studies taken from Gilland et al.33 and are given in Table 1.
Table 1.
Relative organ activity concentrations for the simulated NCAT phantom.
| Organ | Relative activity |
|---|---|
| Myocardium | 75 |
| Heart blood pool | 6 |
| Liver | 13 |
| Gall bladder | 324 |
| Lung | 6 |
| Kidney | 45 |
| Spleen | 45 |
| Bowel | 37 |
| Background (body) | 6 |
To generate realistic motion blur within the ECG-gated frames, ECG gating was simulated with 32 frames for one cardiac contraction cycle and then averaged to a final sampling of 8 frames. Respiratory motion was simulated by rotating and shifting each of the ECG frames for a total of 32 respiratory frames per ECG gate. These frames were then averaged to a final sampling of eight respiratory frames per ECG gate. These transformations resulted in an 8×8 [(respiratory cycle bins)×(ECG bins)] matrix of phantom images. The motion used to generate the respiratory frames is given in Table 2. These values were taken from human MR studies in Ref. 3 and represent a slightly larger than average displacement. In the table, bx represents the lateral translation, by represents the anterior-posterior translation, bz represents the craniocaudal translation, φ represents the rotation about the lateral axis, θ represents the rotation about the anterior-posterior axis, and ψ represents the rotation about the craniocaudal axis. This notation is identical to that used in CGPYR. Nonrigid deformation of the heart due to respiration was not modeled. It should be noted that the NCAT program has the ability to simulate respiratory motion of the heart; however, the software simulates only the translational components of respiratory motion, and so would not serve the purposes of this study.
Table 2.
Respiratory motion in the mathematical phantom images relative to frame 1. Translations are given in pixels and rotations in degrees.
| Frame interval | bx | by | bz | ψ | φ | θ |
|---|---|---|---|---|---|---|
| 1→1 | 0.0 | 0.0 | 0.0 | 0.0 | 0.0 | 0.0 |
| 1→2 | −0.28 | −0.864 | −0.96 | −1.675 | −1.65 | −0.375 |
| 1→3 | −0.56 | −1.728 | −1.92 | −3.35 | −3.3 | −0.75 |
| 1→4 | −0.84 | −2.592 | −2.88 | −5.025 | −4.95 | −1.125 |
| 1→5 | −1.12 | −3.456 | −3.84 | −6.7 | −6.6 | −1.5 |
| 1→6 | −0.84 | −2.592 | −2.88 | −5.025 | −4.95 | −1.125 |
| 1→7 | −0.56 | −1.728 | −1.92 | −3.35 | −3.3 | −0.75 |
| 1→8 | −0.28 | −0.864 | −0.96 | −1.675 | −1.65 | −0.375 |
Projection data for each of the dual-gated phantom distributions were simulated using the SIMIND Monte Carlo program.34 Scatter, attenuation, detector stopping power, and detector response were modeled assuming a gamma energy of 140 keV, crystal thickness of 1.27 cm, pixel size of 0.3125 cm, 64 projections over 180° from the left-posterior-oblique to right-anterior-oblique angles, 128×128 detector elements, 15% energy resolution, 20% energy window, and a low energy general purpose parallel-hole collimator. The simulations were allowed to run until the average relative noise in the projection data was less than 2%. The average relative noise was defined as the standard deviation of a 4×4 region of interest (ROI) located in the liver (near homogeneous) divided by the mean of the ROI and averaged over five equally spaced angles. The data were then scaled to approximately 14 000 total counts in a 3 mm midventricular slice per frame. This count level is typical of a -sestimibi study. Finally, Poisson noise was simulated in each projection set a total of ten times, generating an ensemble of noise realizations. Each of the noise realizations was reconstructed using five iterations of ordered-subsets expectation maximization (OSEM) (Ref. 35) with eight subsets without attenuation correction. The dual-gated reconstructed images were summed over the ECG frames to generate the eight respiratory-gated frames upon which the motion estimation methods were tested.
Evaluation metrics
For any motion estimate determined by the rotation matrix and the translation vector , we define the phantom matching error (PME):
| (4) |
where fP,j is the original phantom image without extramyocardial activity at frame j. The rotational error is defined as the absolute difference between the estimated rotation and true rotation in the Euler representation, in degree units. The translational error is defined as the absolute difference between the estimated translation and true translation, in pixel units.
Each of the motion estimation methods were tested on the original, noise-free phantom images without extramyocardial activity and on the noisy reconstructed images. Their accuracy was quantified in terms of translational, rotational, and phantom matching errors, each averaged over all eight frames. In the case of the motion estimated from the original phantom images, the PME is a measure of the optimal registration accuracy of each method. The total computation times over all frames were also compared.
The noise-free phantom frames were corrected by translating and rotating frames two to eight based on the estimated motion and summing with frame 1. The resulting images were evaluated by visual inspection and profile analysis. For comparison purposes, three other images were generated: (1) An uncorrected image, i.e., a summation over the respiratory frames without any motion estimation, (2) an image corrected with the known, true motion, and (3) an ideal image that contained only within frame respiratory motion blur (i.e., respiratory frame 1).
Effect of segmentation
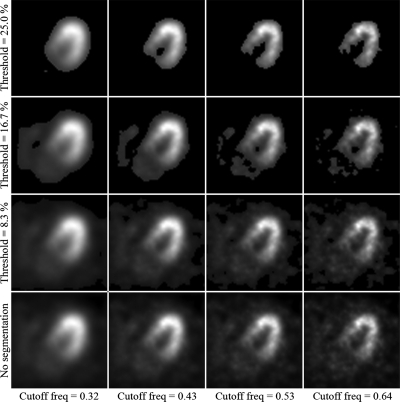
Estimating the respiratory motion of the heart on images with extramyocardial activity requires segmentation of the myocardial activity due to the nonuniform displacement of organs in the thorax during respiration. To investigate the effects of segmentation on the motion estimation methods, we segmented the left ventricular (LV) wall of the noisy reconstructions over a range of segmentation levels. The different segmentations were created by first varying a 3D Butterworth filter cutoff frequency from 0.32 to 0.64 cycle∕cm with a step size of 0.04 cycle∕cm. Then, an intensity threshold was varied from 0% to 25% of the maximum pixel intensity with a step size of 2.5%. Pixel values below this threshold were set to zero. This resulted in 99 different segmentations for each noise realization (990 total segmented images). Figure 1 shows 16 of the 99 segmentations for the first noise realization. We can see that as the threshold is increased, less of the extramyocardial activity is included.
Figure 1.
Select segmentation levels. The images are summations over the cardiac cycle and shown at end-expiration. Threshold is given in units of percentage of maximum pixel intensity and cutoff frequency is given in units of cycles∕cm.
Comparison of methods at optimal segmentation
In order to ensure a fair comparison, the accuracy and computation time of the motion estimation methods were compared at the optimal segmentation level for each. The optimal level of segmentation was defined as that which generated the lowest average PME. The motion estimation errors were computed as averages over all ten noise realizations and all eight respiratory frames. A single noise realization was corrected using the estimated motion from each method, followed by a 3D Butterworth filter of cutoff frequency 0.48 cycle∕cm. This level of smoothing was chosen empirically to be comparable to that which we may expect in a clinical setting. The resulting images were evaluated by visual inspection and profile analysis. Again for comparison, uncorrected, true-motion-corrected, and ideal images were also generated.
It should be noted that in a clinical setting it may not be practical to determine the optimal segmentation for every patient. Our assumption is that in a clinical implementation of any of the motion estimation methods, a physicist would need to determine a single “optimal” segmentation setting based on a collection of typical studies. This optimal setting would then be added to the initial stage of the motion estimation and correction automation.
Effect of motion correction on calculation of ejection fraction
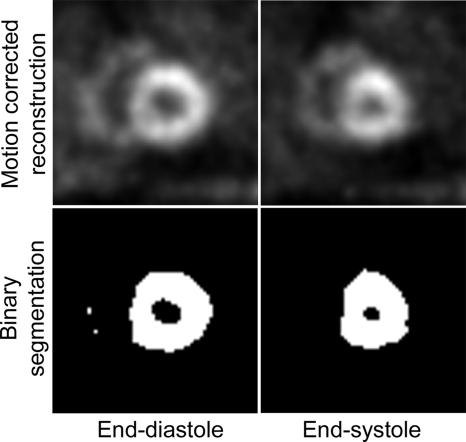
The ejection fraction (EF) was calculated from each of the motion-corrected images in Sec. 3B4. First, a binary segmentation of the heart region was determined for each image using a segmentation threshold equal to 40% of the maximum pixel intensity (Fig. 2). Then, the volume contained by the myocardial walls (i.e., the blood pool) at end diastole, VED, and end systole, VES, was determined using six consecutive midventricular slices. The EF was calculated as EF=(VED−VES)∕VED.
Figure 2.
Example binary segmentation used in the calculation of ejection fraction. The blood pool is the black area contained by the myocardial wall.
Effects of varying levels of extramyocardial activity
In a clinical setting, we would expect to see a high variability in the level of extramyocardial activity present among patients. The maximum standard deviation of extramyocardial activity in Ref. 33 was 75%. It is not practical, however, to adapt the motion estimation algorithm (e.g., the segmentation method) on a case-by-case basis. To test the robustness of the methods under these variable conditions, we calculated the average PME over ten noise realizations for each method at optimal segmentation as the extramyocardial activity was varied from 0% to 300% (2.5 standard deviations from average). A single noise realization for 25% and 175% background activity scaling levels was corrected using the motion estimation methods, followed by a 3D Butterworth filter of cutoff frequency of 0.48 cycle∕cm.
Respiratory-gated patient SPECT images
The methods were further evaluated with a respiratory-gated acquisition of a human subject. The patient was imaged at rest after injection of -sestimibi with a matrix size of 128×128 and pixel size of 0.467 cm, with 68 angles over 204° about the left-anterior-oblique angle. Gating of the respiratory cycle was performed using a chest belt as described earlier, with eight gates per respiratory cycle binned postacquisition according to phase.
The data were first reconstructed using five iterations of OSEM with four subsets. To estimate the respiratory motion, a segmentation of the LV wall was created by first smoothing with a 3D Butterworth filter of cutoff frequency 0.4 cycle∕cm, followed by an intensity threshold of 27% of the maximum pixel intensity. These parameters were chosen empirically to provide a clear image of the LV wall while suppressing all other extramyocardial activity which may not move identically to the LV wall. A user-specified 3D elliptical ROI in each frame was drawn around the LV, and all voxels outside this ROI were set to zero. The images were then cropped to a final matrix size of 24×24 with 24 slices. A transaxial slice of the segmentation at end expiration is shown in Fig. 3.
Figure 3.
Transaxial slice of the segmented human image used for motion estimation (shown at end expiration).
The motion estimation methods were applied to the data, and the resulting motion estimates were used to correct the original, unfiltered reconstruction. This was followed by a 3D Butterworth filter of cutoff frequency 0.37 cycle∕cm. This level of smoothing was chosen empirically to be comparable to that which we may expect in a clinical setting. For comparison, an uncorrected image was also created by summing the original, unfiltered reconstructions across the respiratory frames and smoothing with an identical 3D Butterworth filter of cutoff frequency of 0.37 cycle∕cm. Since the true motion is not known in these images, the resulting images were evaluated only by visual inspection of myocardial wall blur and uniformity and computation time.
RESULTS
All motion estimation methods were implemented on a standard Linux workstation with dual AMD Opteron 250 (2.4 GHz) processors and 4 Gbytes of memory per processor. In testing, the methods were restricted to execute on a single processor.
Motion estimation on the noise-free phantom frames
Results for the motion estimates on the noise-free phantom frames are given in Table 3. These results indicate that in terms of accuracy, all correction methods have similar registration and translational and rotational errors. The principal axis method is the computationally fastest followed by CGQ and CGPYR. Note that using the same CG algorithm but only changing the parametrization of the rotation matrix from the Euler angle representations used in CGPYR and our previous work19 resulted in a 50% reduction in the computation time.
Table 3.
Motion estimates from the noise-free phantom images.
| Method | Translational error (pixels) | Rotational error (deg) | PME | Computation time(s) |
|---|---|---|---|---|
| CGQ | 0.15 | 0.01 | 100.03 | 61.00 |
| CGPYR | 0.15 | 0.15 | 100.03 | 119.72 |
| Principal axes | 0.15 | 0.01 | 100.81 | 0.13 |
| No correction | 1.4 | 2.5 | 4447.94 | – |
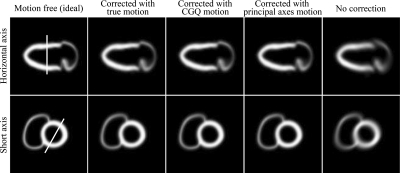
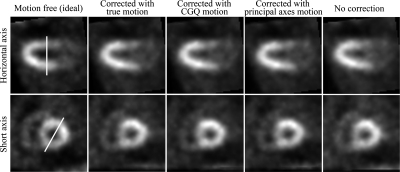
Figure 4 shows selected short and horizontal views of the noise-free phantom with respiratory motion corrected by the true-, CGQ-estimated, and principle axis-estimated motion, and with respiratory motion with no correction. CGQ and principal axis corrected images are displayed here because they represent the fastest of the iterative and analytical methods, respectively. The images are shown at the end-diastolic phase of the cardiac contraction motion. The images corrected with CGQ and principal axes are more similar to the image corrected with the true motion in terms of uniformity and sharpness throughout the LV and RV walls than the uncorrected image.
Figure 4.
Select slices of the phantom images at end diastole.
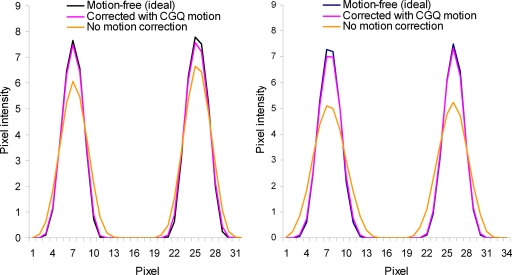
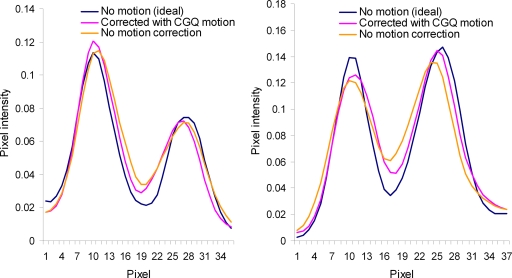
Profiles for the lines shown in Fig. 4 are given in Fig. 5 for the images corrected with the true- and CGQ-estimated motion and the uncorrected image. Profiles for the image corrected with the principal axis motion were nearly identical to the CGQ profile and thus are not displayed here. The corrected profiles are taller, indicating better contrast, and thinner, representing better spatial resolution, than the uncorrected image profiles. The FWHM calculated from the horizontal axis view was 3.8 for motion-free, 3.9 for CGQ correction, and 4.8 for no correction at the superior wall and 4.2 for motion-free, 4.2 for CGQ correction, and 4.8 for no correction at the inferior wall. The FWHM calculated from the short axis view was 4.1 for motion-free, 4.2 for CGQ correction, and 5.8 for no correction at the superior wall and 3.7 for motion-free, 3.8 for CGQ correction, and 5.3 for no correction at the inferior wall. Based on the similar accuracy but significantly worse computation time of CGPYR to CGQ and principal axes, CGPYR was excluded from any further evaluation.
Figure 5.
Horizontal (left) and short (right) axis profiles for Fig. 3.
Effect of segmentation
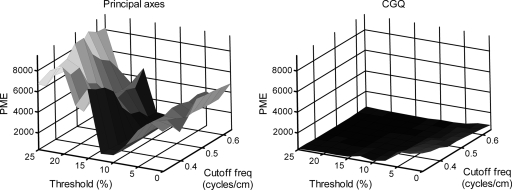
The results of the segmentation investigation on the reconstructions of the simulated data are shown in Fig. 6. The figure shows for the principal axis and CGQ methods a plot of the average PME as a function of intensity threshold and 3D Butterworth cutoff frequency. We can see that CGQ generates a relatively flat and low surface, indicating accurate motion estimation across a wide range of segmentation levels. The optimal segmentation for CGQ was at threshold=17.5% and cutoff frequency=0.44 cycle∕cm, generating an average PME of 343.26. Principal axes were highly unstable across the range of segmentations, with optimal segmentation at threshold=12.5% and cutoff frequency=0.48 cycle∕cm, generating an average PME of 757.23. The differences between the two plots are most profound for thresholds greater than 15%. These levels of segmentation correspond to the top two rows of Fig. 1.
Figure 6.
Results for average PME found by varying the segmentation parameters. Threshold is given in percentage of maximum pixel intensity and cutoff frequency is given in cycles∕cm.
Comparison of methods at optimal segmentation
The average motion estimation results for principal axes and CGQ at optimal segmentation over all ten noise realizations are given in Table 4. CGQ performed significantly better than principal axes in terms of PME accuracy and redundancy (standard deviation) with an average PME of 343.26±100.52. However, the average computation time of CGQ was 55.10±11.13 s. The average PME for principal axes was 757.23±158.38, but it again executed on average in under 1 s. The difference in the average PME for CGQ and principle axes was investigated using a paired t test and found to be significant at the 5% level.
Table 4.
Average motion estimation errors for the ten noisy simulated images with background activity at optimal segmentation.
| Method | Translational error (pixels) | Rotational error (deg) | PME | Computation time (s) |
|---|---|---|---|---|
| CGQ | 0.24±.05 | 1.05±.16 | 343.26±100.52 | 55.10±11.13 |
| Principal axes | 0.31±.07 | 2.25±.42 | 757.23±158.38 | 0.08±.04 |
| No correction | 1.4 | 2.5 | 4447.94 | – |
Figure 7 shows selected short and horizontal views of the noise-free phantom with respiratory motion corrected by the true-, CGQ-estimated, and principle axis-estimated motion, and with respiratory motion with no correction. The images are shown at the end-diastolic phase of the cardiac contraction motion. The images corrected with CGQ and principal axes are more similar to the image corrected with the true motion in terms of sharpness throughout the LV walls as well as LV blood pool contrast than the uncorrected image. Profiles for the lines shown in Fig. 7 are given in Fig. 8 for the true- and CGQ-corrected images and the uncorrected image. Profiles for the image corrected with the principal axis motion were again nearly identical to the CGQ profile and thus are not displayed here. The FWHM calculated from the horizontal axis view was 8.6 for motion-free, 8.8 for CGQ correction, and 9.8 for no correction at the superior wall and 9.0 for motion-free, 10.2 for CGQ correction, and 11.6 for no correction at the inferior wall. The FWHM calculated from the short axis view was 7.3 for motion-free, 9.2 for CGQ correction, and 9.4 for no correction at the superior wall and 9.2 for motion-free, 9.4 for CGQ correction, and 10.7 for no correction at the inferior wall.
Figure 7.
Reconstructions of the noisy simulated images at end diastole.
Figure 8.
Horizontal (left) and short (right) axis profiles for Fig. 6.
Effect of motion correction on calculation of ejection fraction
The results of the EF calculation for the motion correction methods are given in Table 5. The true EF of the NCAT phantom was 62%. The EF calculated using the image corrected with the true motion was most accurate, followed by CGQ, and principle axes, respectively. The image corrected with CGQ improved the accuracy of the EF calculation by 6%.
Table 5.
Ejection fraction calculated from the motion-corrected images. The actual EF of the NCAT phantom is 62%.
| Motion estimate | Ejection fraction (%) |
|---|---|
| True motion | 63 |
| CGQ | 67 |
| Principle axes | 70 |
| No correction | 73 |
Effect of varying level of extramyocardial activity
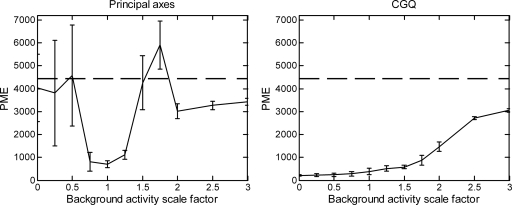
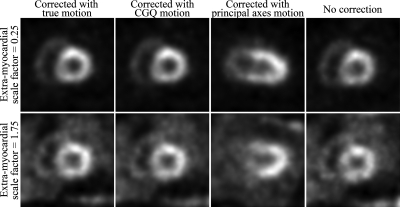
In a clinical setting we would expect a large variation in interpatient extramyocardial activity levels. Therefore, here we examine how the motion estimation methods behave (at optimal segmentation) as the extramyocardial activity level is varied. The results for principal axes and CGQ as the background activity levels are varied from 0% to 300% are shown in Fig. 9. We can see that the accuracy of CGQ improves as the level of background activity decreases and worsens as the background levels are increased. However, even as the background activity is increased to 300%, the CGQ-generated motion estimate is still more accurate than a motion estimate of zero for each component (dashed line at 4447.94). This shows good robustness on the part of CGQ over a large range of background activities, as we may expect to see in a clinical setting. In contrast, the principal axis method is highly unstable across the range of background activity levels. Images obtained using principal axes and CGQ at background activity scaling factors of 0.25 and 1.75 (±1 standard deviation) are shown in Fig. 10. The CGQ-corrected images are more similar to the images corrected with the true motion in terms of LV wall uniformity and definition than the uncorrected images. The images corrected with the principal axis-estimated motion are less similar to the images corrected with the true motion than the uncorrected images. An examination of the principal axis motion estimates found that for several frames at each background activity scaling level, the method generated rotational estimates with errors greater than 90°.
Figure 9.
Results for average PME found by varying the background activity concentration at optimal segmentation. Error bars indicate the standard deviation of the PME over the ten noise realizations for each scale factor. The dashed line at 4447.94 represents the PME of an uncorrected image.
Figure 10.
Reconstructions of the simulated data at extramyocardial activity levels of 0.25 and 1.75 (fraction of average). CGQ-corrected images are nearly indistinguishable from images corrected with the true motion.
Human SPECT image
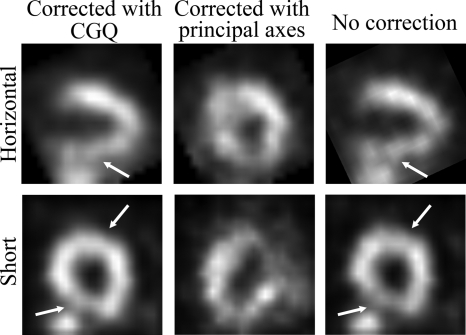
The CGQ-corrected, principal axis-corrected, and uncorrected human images are shown in Fig. 11. We can see that the CGQ-corrected images are more uniform and have decreased blurring in areas running perpendicular to the axial direction (marked with arrows) compared to the uncorrected image. The principal axis-corrected image does not resemble the expected activity distribution. Examination of the motion estimation obtained from principal axes found that two frames had rotational estimates greater than 90°. The average objective function at convergence for CGQ was 431.16. An average objective function value calculated using the principal axis-estimated motion was 1368.48. These may be compared to an average objective function of 631.32 calculated using a motion estimate of zero for all components (i.e., no correction). Contrary to the previous studies using the phantom and noisy reconstructions, the computational time for CGQ was 6 s. This may be attributed to the larger pixel size of the human study that enabled a small segmented ROI (24×24×24) to be used for the motion estimation. The computation time for principle axes was less than 1 s.
Figure 11.
Reconstructions of the human images with CGQ correction, principal axis correction, and no correction, respectively. The CGQ-corrected image has increased uniformity and sharpness in areas perpendicular to the axial motion (marked with arrows) compared to the uncorrected image.
SUMMARY AND DISCUSSION
In this work, we have developed a new method for correction of respiration-induced cardiac motion using a rigid-body model with a rotation matrix parametrized by a unit quaternion. The method minimizes an image-registration function using an optimized conjugate gradient routine. The implementation uses no user-defined input parameters or prior terms, simplifying the use of the method in a clinical setting. Images corrected with the quaternion-based motion estimate were found to be more similar to images corrected with the known, true motion compared to uncorrected images on both phantom and simulated data. The ejection fraction calculated from images corrected with the method demonstrated a 6% improvement in accuracy over uncorrected images. Our method was also tested on a respiratory-gated study of a human subject. The corrected images have increased uniformity and decreased motion blur in areas of the myocardium running perpendicular to the axial direction. Furthermore, the method was shown to be relatively insensitive to changes in segmentation and extramyocardial activity level, a key requirement for clinical use. The computation time ranged from 61 s on a phantom image to 55.1 s on reconstructions of simulated data to 6 s on a human SPECT image. More human studies over a range of detector configurations are needed to determine a typical computation time in routine clinical use, but all of the times reported here are within an acceptable range, especially when hardware acceleration techniques are considered. The CGQ method was also tested using an initial motion estimate generated from the principal axis method. However, due to inaccuracies in the initial principal axis estimate, no improvement in convergence speed was observed.
Another approach to improving the computational burden of the Euler angle method could be to calculate Eqs. C2, C3, C4, C5 using the approximations sin(A)=A and cos(A)=1. These approximations are generally valid for small A, such as the rotations used in this paper. For example, if we set A=6.7°, the largest rotation used in this paper, we calculate an error of <1% using the approximation sin(A)=A. However, it is important to note that the actual spatial transformation [Eq. C2] applied to an image matrix uses many sums and products of trigonometric functions, and thus the error in the actual registration is a complicated accumulation of all errors in Eq. C2. The effect of this error propagation can be significant. For example, assume a 3D image with matrix size=128×128×128 which undergoes a true rotation of (φ,θ,ψ)=(6.7°,6.7°,6.7°). Plugging these values of the Euler angles into Eq. C2 and multiplying by r=(32,32,32), an area of the image we might expect the heart to lie in, we calculate the new position, . However, if we calculate Eq. C2 using the suggested trigonometric approximations and multiply by r=(32,32,32), we calculate . The Euclidean error (vector difference) between and is 0.9 pixel. With a pixel size of 3.125 mm, the error is equal to 2.7 mm, a significant misregistration. Furthermore, if we investigate the error in the same location with a larger rotation (φ,θ,ψ)=(6.7°,15.0°,6.7°), such as that used in Ref. 14, we calculate a Euclidean error of 6.7 mm.
It should be noted that although consistent improvement between corrected and uncorrected images was found in this paper, the difference was not always considerable, and it is unclear at this time how respiratory motion correction may impact diagnostic accuracy in cardiac SPECT. Future work will focus on a mathematical observer study as well as a human receiver operating characteristic study on the effects of correcting cardiac respiratory motion blur in cardiac SPECT.
ACKNOWLEDGMENTS
This work was supported by the National Institutes of Health under Grant No. RO1HL073336 and by the United States Army Medical Research and Materiel Command under Award No. W81XWH-04-1-0594 and by the National Science Foundation under Grant No. 0619080. The authors would like to thank Dr. Michael King and Dr. Joyoni Dey of the University of Massachusetts Medical School for providing the human SPECT images, as well as useful discussions on the acquisition methods. They would also like to thank Dr. Bing Feng of the University of Massachusetts Medical School for allowing them to use his generalized centers of mass code, as well as for useful discussions on the principal axis method. The authors would also like to thank Timothy Turkington of Duke University for kindly allowing them to use his image viewing program, SPECTER.
APPENDIX A: QUATERNION-PARAMETERIZED
The orthogonal (rotation) matrix R corresponding to a rotation by q is
| (A1) |
With the substitution in place, the partial derivatives of Q are
| (A2) |
| (A3) |
| (A4) |
APPENDIX B: PARTIAL DERIVATIVES OF EQ. (1)
The partial derivatives of E with respect to each of the parameters are
| (B1) |
| (B2) |
| (B3) |
| (B4) |
| (B5) |
| (B6) |
APPENDIX C: EULER ANGLE REPRESSENTATION
In the Euler representation, Q is the product of the rotation matrices about each axis:
| (C1) |
The orthogonal (rotation) matrix Q corresponding to a rotation by (φ,θ,ψ) is
| (C2) |
In computing the partial derivatives of our objective function, the products , , and are needed:
| (C3) |
| (C4) |
| (C5) |
References
- Ter-Pogossian M. M., Bergmann S. R., and Sobel B. E., “Influence of cardiac and respiratory motion on tomographic reconstructions of the heart: Implications for quantitative nuclear cardiology,” J. Comput. Assist. Tomogr. 6, 1148–1155 (1982). [DOI] [PubMed] [Google Scholar]
- Wang Y., Riederer S. J., and Ehman R. L., “Respiratory motion of the heart: Kinematics and the implications for the spatial resolution in coronary imaging,” Magn. Reson. Med. 33, 713–719 (1995). 10.1002/mrm.1910330517 [DOI] [PubMed] [Google Scholar]
- McLeish K., Hill D. L. G., Atkinson D., Blackall J. M., and Razavi R., “A study of the motion and deformation of the heart due to respiration,” IEEE Trans. Med. Imaging 21(9), 1142–1150 (2002). 10.1109/TMI.2002.804427 [DOI] [PubMed] [Google Scholar]
- Livieratos L., Rajappan K., Stegger L., Schafers K., Bailey D. L., and Camici P. G., “Respiratory gating of cardiac PET data in list-mode acquisition,” Eur. J. Nucl. Med. 33(5), 584–588 (2006). 10.1007/s00259-005-0031-0 [DOI] [PubMed] [Google Scholar]
- Shechter G., Ozturk C., Resar J. R., and McVeigh E. R., “Respiratory motion of the heart from free breathing coronary angiograms,” IEEE Trans. Med. Imaging 23(8), 1046–1056 (2004). 10.1109/TMI.2004.828676 [DOI] [PMC free article] [PubMed] [Google Scholar]
- Klein G. J., Reutter B. W., Hol M. H., Reed J. H., and Huesman R. H., “Real-time system for respiratory-cardiac gating in positron tomography,” IEEE Trans. Nucl. Sci. 45(4), 2139–2143 (1998). 10.1109/23.708323 [DOI] [Google Scholar]
- Martinez-Moller A., Zikic D., Botnar R. M., Bundschuh R. A., Howe W., Ziegler S. I., Navab N., Schwaiger M., and Nekolla S. G., “Dual cardiac-respiratory gated PET: Implementation and results from a feasibility study,” Eur. J. Nucl. Med. Mol. Imaging 34(9), 1447–1454 (2007). 10.1007/s00259-007-0374-9 [DOI] [PubMed] [Google Scholar]
- Hoffman E. J., Phelps M. E., Wisenberg G., Schelbert H. R., and Kuhl D. E., “Electrocardiographic gating in positron emission computed tomography,” J. Comput. Assist. Tomogr. 3, 733–739 (1979). 10.1097/00004728-197903060-00005 [DOI] [PubMed] [Google Scholar]
- Detorie N. C., Kesner A. L., Solberg T. D., and Dahlbom M., “Evaluation of image noise in respiratory gated PET,” IEEE Trans. Nucl. Sci. 54(1), 66–70 (2007). 10.1109/TNS.2006.890014 [DOI] [Google Scholar]
- Beach R. D., Pretorius P. H., Boening G., Bruyant P. P., Feng B., Fulton R. R., Gennert M. A., Nadella S., and King M. A., “Feasibility of stereo-infrared tracking to monitor patient motion during cardiac SPECT imaging,” IEEE Trans. Nucl. Sci. 51(5), 2693–2698 (2004). 10.1109/TNS.2004.835786 [DOI] [PMC free article] [PubMed] [Google Scholar]
- Bruyant P. P., Gennert M. A., Speckert G. C., Beach R. D., Morgenstern J. D., Kumar N., Nadella S., and King M. A., “A robust visual tracking system for patient motion detection in SPECT: Hardware solutions,” IEEE Trans. Nucl. Sci. 52(5), 1288–1294 (2005). 10.1109/TNS.2005.858208 [DOI] [PMC free article] [PubMed] [Google Scholar]
- Beach R. D., Depold H., Boening G., Bruyant P. P., Feng B., Gifford H. C., Gennert M. A., Nadella S., and King M. A., “An adaptive approach to decomposing patient-motion tracking data acquired during cardiac SPECT imaging,” IEEE Trans. Nucl. Sci. 54(1), 130–139 (2007). 10.1109/TNS.2006.887471 [DOI] [PMC free article] [PubMed] [Google Scholar]
- Bruyant P. P., King M. A., and Pretorius P. H., “Correction of the respiratory motion of the heart by tracking of the center of mass of thresholded projections: A simulation study using the dynamic MCAT phantom,” IEEE Trans. Nucl. Sci. 49(5), 2159–2166 (2002). 10.1109/TNS.2002.803678 [DOI] [Google Scholar]
- Feng B., Bruyant P. P., Pretorius P. H., Beach R. D., Gifford H. C., Dey J., Gennert M. A., and King M. A., “Estimation of the rigid-body motion from three-dimensional images using a generalized center-of-mass points approach,” IEEE Trans. Nucl. Sci. 53(5), 2712–2718 (2006). 10.1109/TNS.2006.882747 [DOI] [PMC free article] [PubMed] [Google Scholar]
- Livieratos L., Stegger L., Bloomfield P. M., Schafers K., Bailey D. L., and Camici P. G., “Rigid-body transformation of list-mode projection data for respiratory motion correction in cardiac PET,” Phys. Med. Biol. 50, 3313–3322 (2005). 10.1088/0031-9155/50/14/008 [DOI] [PubMed] [Google Scholar]
- Kovalsi G., Israel O., Keidar Z., Frenkel A., Sachs J., and Azhari H., “Correction of heart motion due to respiration in clinical myocardial perfusion SPECT scans using respiratory gating,” J. Nucl. Med. 48(4), 630–636 (2007). 10.2967/jnumed.106.037390 [DOI] [PubMed] [Google Scholar]
- Klein G. J., Reutter B. W., and Huesman R. H., “Four-dimensional affine registration models for respiratory-gated PET,” IEEE Trans. Nucl. Sci. 48(3), 756–760 (2001). 10.1109/23.940159 [DOI] [Google Scholar]
- Dey J., Feng B., Johnson K. L., McNamara J. E., Pretorius P. H., and King M. A., “Respiratory motion correction in cardiac SPECT using affine and free-form deformation registration with temporal and spatial constraints,” Proceedings of the Ninth International Meeting Fully 3D Image in Radiology and Nuclear Medicine, 2007, pp. 201–204.
- Parker J. G., Mair B. A., Gilland D. R., and Mahoney M., “Cardiac emission tomography with 3D respiratory motion correction,” Proceedings of the Ninth International Meeting Fully 3D Image in Radiology and Nuclear Medicine, 2007, pp. 413–416.
- Lu W., Parikh P. J., Hubenschmidt J. P., Bradley J. D., and Low D. A., “A comparison between amplitude sorting and phase-angle sorting using external respiratory measurement for 4D CT,” Med. Phys. 33(8), 2964–2974 (2006). 10.1118/1.2219772 [DOI] [PubMed] [Google Scholar]
- Korin H. W., Ehman R. L., Riederer S. J., Felmlee J. P., and Grimm R. C., “Respiratory kinematics of the upper abdominal organs: A quantitative study,” Magn. Reson. Med. 23, 172–178 (1992). 10.1002/mrm.1910230118 [DOI] [PubMed] [Google Scholar]
- Thevenaz P., Ruttimann U. E., and Unser M., “A pyramid approach to subpixel registration based on intensity,” IEEE Trans. Image Process. 7(1), 27–41 (1998). 10.1109/83.650848 [DOI] [PubMed] [Google Scholar]
- Kantabutra V., “On hardware for computing exponential and trigonometric functions,” IEEE Trans. Comput. 45(3), 328–339 (1996). 10.1109/12.485571 [DOI] [Google Scholar]
- Horn B. K. P., “Closed-form solution of absolute orientation using unit quaternions,” J. Opt. Soc. Am. A 4, 629–642 (1987). 10.1364/JOSAA.4.000629 [DOI] [Google Scholar]
- Mukundan R., “Quaternions: From classical mechanics to computer graphics, and beyond,” Proceedings of the Seventh Asian Technical Conference in Mathematics, 2002, invited paper.
- Hagar W. W. and Zhang H., “A new conjugate gradient method with guaranteed descent and an efficient line search,” SIAM J. Optim. 16, 170–192 (2005). 10.1137/030601880 [DOI] [Google Scholar]
- Hagar W. W. and Zhang H., “Algorithm 851: CG̱DESCENT, a conjugate gradient method with guaranteed descent,” ACM Trans. Math. Softw. 32, 113–137 (2006). 10.1145/1132973.1132979 [DOI] [Google Scholar]
- Faber T. L. and Stokely E. M., “Orientation of 3-D structures in medical images,” IEEE Trans. Pattern Anal. Mach. Intell. 10(5), 626–633 (1988). 10.1109/34.6771 [DOI] [Google Scholar]
- Alpert N. M., Bradshaw J. F., Kennedy D., and Correia J. A., “The principal axes transformation – A method for image registration,” J. Nucl. Med. 31, 1717–1722 (1990). [PubMed] [Google Scholar]
- Anderson E., Bai Z., Bischof C., Blackford S., Demmel J., Dongarra J., Du Croz J., Greenbaum A., Hammarling S., McKenney A., and Sorensen D., LAPACK Users’ Guide, 3rd ed. (University of Tennessee, Knoxville, 1999). [Google Scholar]
- Press W. H., Flannery B. P., Teukolsky S. A., and Vetterling W. T., Numerical Recipes in C: The Art of Scientific Computing (Cambridge University Press, Cambridge, 1993). [Google Scholar]
- Segars W. P., Lalush D. S., and Tsui B. M. W., “A realistic spline-based dynamic heart phantom,” IEEE Trans. Nucl. Sci. 46(3), 503–506 (1999). 10.1109/23.775570 [DOI] [Google Scholar]
- Gilland D. R., Jaszczak R. J., Hanson M. W., Greer K. L., and Coleman R. E., “An experimental phantom based on quantitative SPECT analy-sis of patient MIBI biodistribution,” J. Nucl. Med. 37, 154 (1996) [Google Scholar]; presented at the Society of Nuclear Medicine 43rd Annual Meeting, Denver, CO, 2–6 June 1996.
- Ljungberg M. and Strand S. E., “A Monte-Carlo program simulating scintillation camera imaging,” Comput. Methods Programs Biomed. 29, 257–272 (1989). 10.1016/0169-2607(89)90111-9 [DOI] [PubMed] [Google Scholar]
- Hudson H. and Larkin R., “Accelerated image reconstruction using ordered-subsets of projection data,” IEEE Trans. Med. Imaging 13(4), 601–609 (1994). 10.1109/42.363108 [DOI] [PubMed] [Google Scholar]


